
Failed Reporting System May Add to Delays.
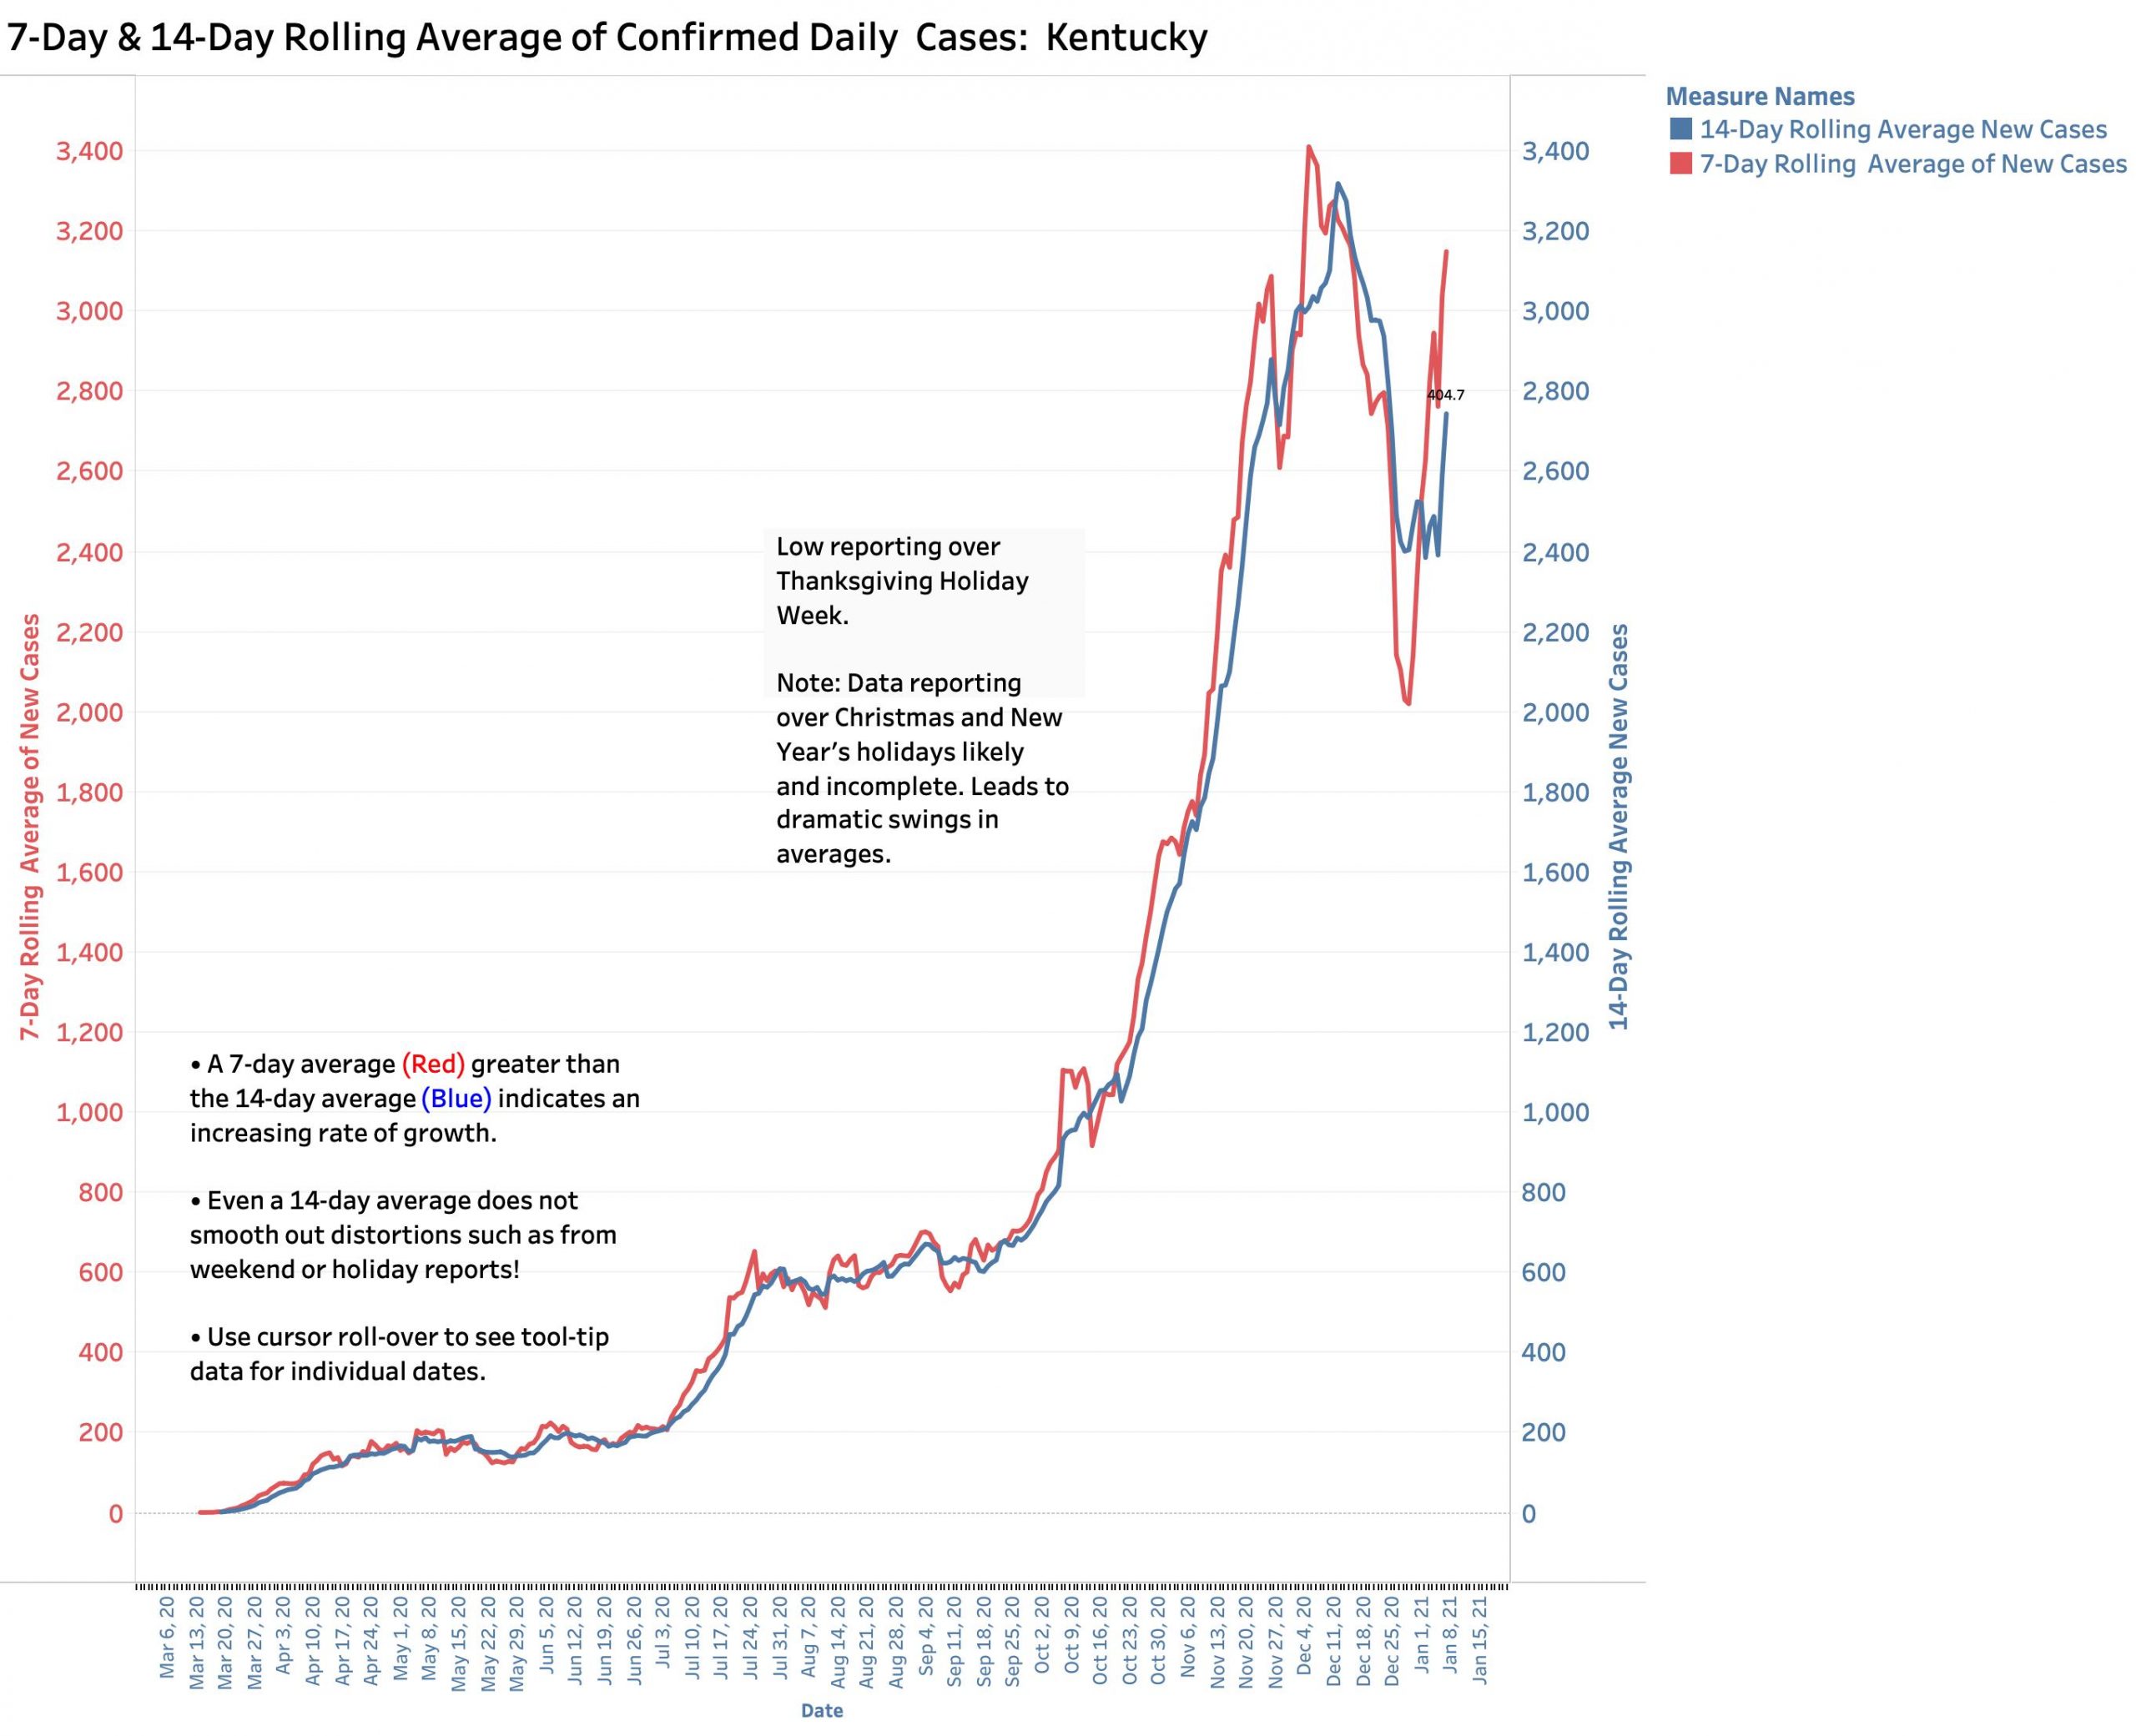
I intended to wait until the end of this week to present my usual Covid-19 status update. I wanted to give our Kentucky testing and reporting system more time to settle out. An initial dramatic fall in new case counts over the December holidays was expected both here and nationally. As might be anticipated, Kentucky’s 7-Day average of new daily cases fell 40% from its post-Thanksgiving record high of 3387 new cases on Dec. 6, to 2021 new cases on Dec. 29. (See figure below.) Some headlines around the country actually reported this as if it represented a turning of the epidemic tide when it actually largely reflected holiday delays in testing and reporting! As of yesterday, Jan. 7, the 7-Day average of new Kentucky cases rebounded to 3150 with back-to-back daily counts of 5705 and 4889 for the two most recent days. Given the very low relative counts of the three previous days, it is virtually certain that our 7-Day average will continue to soar. The same scenario is playing out nationally. “On fire” is a term often used.
Emerging new virus strains.
There are multiple reasons to heightened concern and to maintain public health measures more strictly than we are now. We must assume that the more highly transmissible variant of the Coronavirus that is currently plaguing England, France and other countries is already spreading widely in the United States. One can reasonably speculate that to the extent of allowing the virus preventable time to evolve, the emergence of a more “successful” versions (from the viruses’ point of view) becomes more likely. This demonstrates evolution in action and it has not stopped!
Vaccines haven’t had enough time to have their overall impact.
While there are two vaccines available today with more to come, the roll-out has been disappointedly slow and most estimates are that months will be needed to cover the necessary number of people. The reasons for the slow start will be debated for some time to come.
Great treatments for sick people not yet discovered.
While initial studies of several treatments for Covid-19 showed some benefit for some patients, the benefits are marginal at best. Some that were tried in the real world proved ineffective or worse. Those whose professional expertise is to judge the quality of studies of the clinical effectiveness of Covid-19 treatments available to date are concerned. Suffice it to say that no “magic bullets” have yet emerged.
Hospitals and clinical systems overwhelmed in several states.
This is a real issue in some places and is requiring actual patient tirage. Not all modalities are available to all patients. Allocation of treatment settings and modalities are in some places actually being based on determinations of potential survivability. Some will legitimately and ethically label this as avoiding futile treatment, while others will consider it rationing. (The truth is we ration health care all the time in other ways. Not everyone gets the full treatments available to most of us.)
Plateau or saturation?
In Kentucky the numbers of Covid-19 patients in hospitals and ICUS are as high as they have ever been but total numbers statewide are not currently rising in a major way. One can call this a plateau, but the situation will be different for every one of the 100+ hospitals in Kentucky. I am hearing from professional friends in Louisville that at least some hospitals with the greatest patient loads are struggling. Additional intensive care beds are being set up in new hospital locations. Hospital staff are under terrific pressures and limitations may be driven more by numbers of healthcare and other staff than the counts of physical beds. I do not have the necessary in-the-trenches information to offer an opinion about the sufficiency of current hospital capability. I do assume that individual hospitals face a different set of challenges, and that a flat utilization curve may represent both a sub-maximal “plateau” of acceptable capability or alternatively, saturation of available resources.
Testing:
The number of reported tests for Coronavirus in Kentucky have been declining significantly since the end of November. Last week was the lowest in several months even as eligibility for individuals to be tested has been expanded to anyone who wants one. I am not well informed about who is getting what type of test or where, and what is being reported or not. I do know that there has always been considerable volatility in daily reports by the Commonwealth. For this reason, Kentucky has been calculating a Test Positivity Rate as 7-Day rolling average of a subset of daily tests but using only tests for the gold-standard PCR- viral RNA, and only those submitted by testing companies that report their results to the state electronically. That Positivity Rate has been rising significantly and is currently almost 12%. (For most of December it was between 8 and 9%.) This figure provides a rough estimate of the incidence of viral infection in the community, but its calculation is critically dependent on who is being tested and the completeness of reporting. If only symptomatic people are tested, the percent positive will be high. If asymptomatic people are tested, the percent positive will be low. Unfortunately, a failure of the result -reporting system of one of Kentucky’s major testing vendors broke down as recently as last week. I do not know if this has been reported previously so I do so below.
Broken Reporting of test results to individuals by Bluewater Diagnostic.
On Monday morning, Dec. 28, with some minor upper respiratory symptoms and perhaps an overabundance of caution, I drove to the drive-through testing center at Southeast Christian Church in Louisville, one of two local state-promoted testing sites available to people without an appointment. There were perhaps understandable parking-lot navigation issues. I was screened for symptoms and relevant contact and health insurance information. Administrative matters included hand-carrying the paper data-collection forms to computers housed in small trailers adjacent to the line. (It was, after all, a parking lot.) I think things went as smoothly as could be expected and I was able to leave about 3 hours after I arrived. When I asked, I was told that I would receive the results by email or text 4 days later– Thursday, Dec 31.
By late Thursday afternoon (New Year’s Eve), I had not yet received any result and was looking at the long holiday weekend ahead and anticipating a longer wait. My physical symptoms had cleared rapidly. I have been very careful about avoiding exposure to the virus, but I had been to my doctor’s office the week before and do not live alone so I was anxious to know the result. I could not find a phone number to call. Looking through Bluewater’s website, I found a browser-based form that I could fill out to request my test result. I uncharacteristically noted in the form that I was a physician and disappointed that a test result was being delayed to the point or eliminating the diagnostic or epidemiologic value of the test at all.
I was both surprised and pleased in very short order to receive an understandable email telling me that my test was negative. This first communication was obviously a “generic” email generated from the personal information I gave. This impersonal report was followed up quicky by a personal email apologizing for the delay and addressing my professional concerns. I was told that the usual turnaround time was 48-72 hours, but that “recently” the company had to start sending out results manually to respond to website queries due to “our Sphere system being down.” There were hopes to have a “new and updated system up in the next week or so.”
I do not know what the “Sphere system” is, a statewide system or one used only by Bluewater. Perhaps the inability to report results automatically was limited to individuals (or physicians) like me. However, it occurred to me that if the reporting problems extended to reporting to the Department of Public Health, that the daily reported numbers would have been inaccurate. Daily numbers of tests and positives would be artifactually lower than was the case. Depending on how many results from self-referred or asymptomatic individuals like me tested around the state in outpatient settings were excluded fom the calculation of Test Positivity Rate, that statistic would be unrepresentative– indeed likely artifactually high.
I do not know when the reporting failure began, or when or if it has been repaired. I have not yet seen any reports on the issue. Yesterday morning I emailed both principal media relations officers in the Governor’s office to notify them of what I had found. I asked if the Governor’s office knew about the reporting problem, if so, how long had it been going on; and most importantly if the failure carried over to electronic reporting of daily test counts and results to the Department Public Health. As of this writing, I have not had a reply but I will keep trying.
To conclude this abbreviated article:
I updated the Tableau Public website with the state data as of January 7. For now, I can only reiterate my opinion from the previous article that it will take another two weeks of reporting cycles to determine with confidence where we are headed. I believe our public health efforts so far have been effective and I fully support the efforts of our Governor and Director of Public Health. For reasons outlined above and others, I think we need to be more rigorous rather than less. It bothers me to see photos in the papers of college basketball games out in the state with crowded stands and few visible masks. I am concerned that promised actions of our legislative majority will reverse the gains we have made. The Dogs of Disease are still stalking among us. To set them free of their leashes can only lead to disaster.
Peter Hasselbacher, MD
Emeritus Professor of Medicine, UofL
January 8, 2021
[Addendum Jan 10, 2021. ] I updated the Tableau Public website with numbers up to yesterday Jan 9. The 7-Day average for new cases is rising stratospherically. It is as high now as it has ever been. The 7-Day average is increasingly outstripping the 14-Day average compatible with faster spread of the virus. I believe that our public health measures had been effective, and certainly reporting and testing delays are playing a major role in the recently rising counts as they get incorporated into the totals, but there is no indication yet that things are slowing down. I fear we are in big trouble and can only hope I am wrong. Superspreaders are on the cusp of being given a free pass.
Peter Hasselbacher, MD
I updated the KHPI’s Tableau Public website with data as of yesterday, January 8. There are now three days in a row with the highest number of new daily cases ever. The 7-Day rolling average of new cases is also now as high as it has ever been, as is the rate of epidemic expansion. Of course, some of this extreme short term volatility is due to holiday disruptions, but the troubling trend upward looks robust.
I have not heard back from Frankfort about the status of Bluewater’s reporting system, and my written question for yesterday’s media briefing by the Governor was not addressed. (I hope my finding was not new for the Department!) It was announced that America has its own new viral variety, the characteristics of which I know nothing. Evolution in action!
I also updated several of the other data sets on Tableau Public including those which the epidemiologic case profile of every county in Kentucky (or America) can be visualized by date. Take a look.
Peter Hasselbacher, MD