
Since mid-October there were suggestions, and then evidence, that the rapid decline in new cases of Covid-19 in Kentucky that began in September was beginning to slow towards a potential “plateau” in the shape of the epidemic curve. By early November, there were suggestions that Kentucky’s epidemic was actually getting worse. As of yesterday (Friday), the number of new cases reported supports that an expansion is real– at least in the short term. Kentucky is not alone among the states or nations in which epidemic surges are occurring. We in the Commonhealth are not immune.
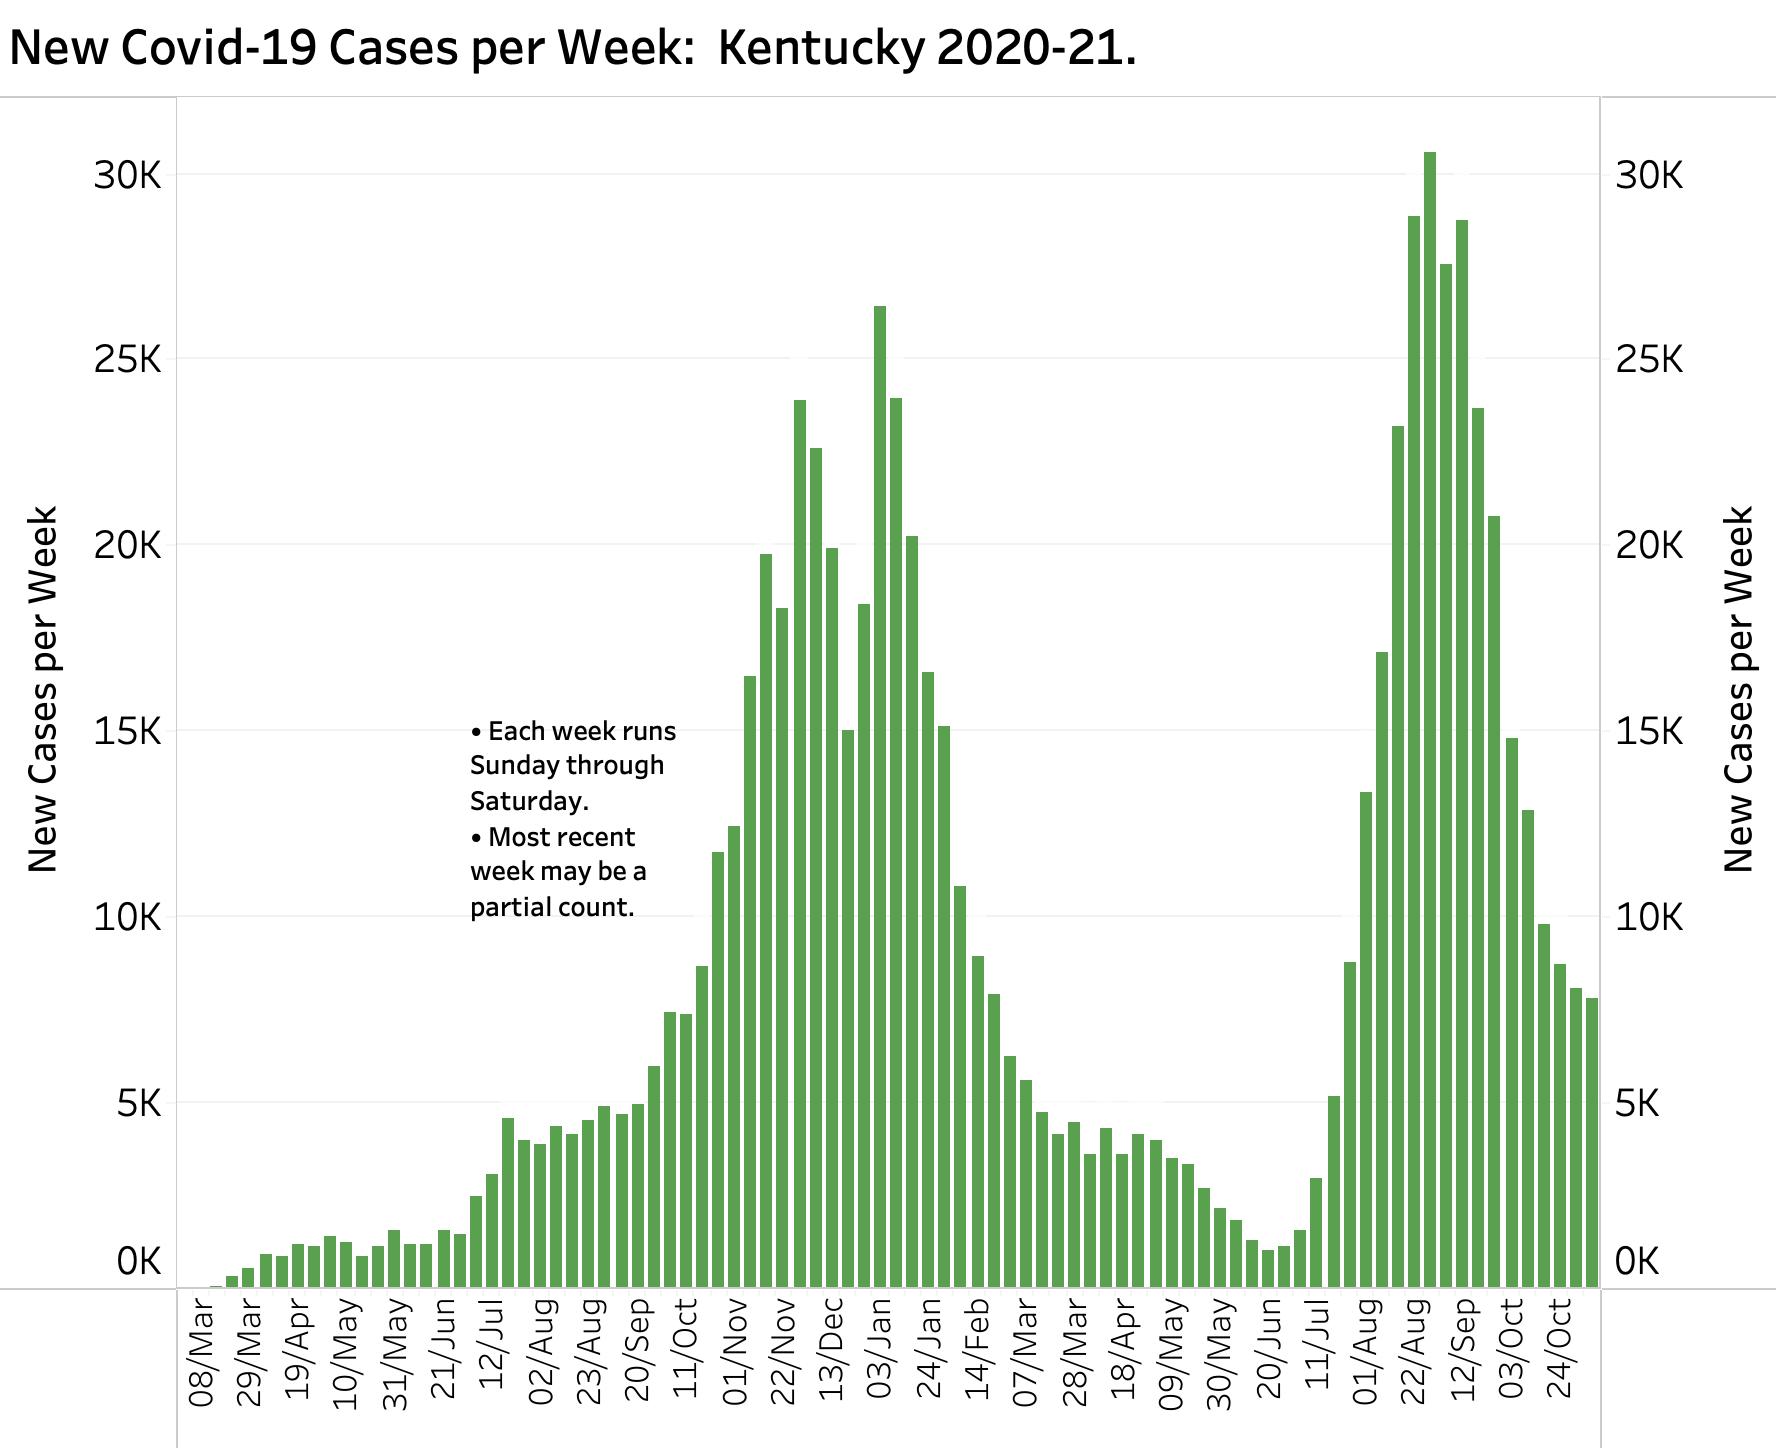
Increase in Weekly Total Cases.
KHPI defines a week as the days from Sunday to Saturday and new cases as the daily increment in total cases. Last week’s total case-counts include those of Sunday, Monday, and a federal holiday– days for which counts have been historically lower due to issues of data collection. Yesterday’s final count for the week-ending Saturday, November 13 will not be available until next Monday evening. Even without Saturday’s count, the total number of new cases for the first 6 days of last week is only 253 fewer than the previous week’s. There is no doubt that with the addition of today’s cases, the total last week will exceed that of the previous week by several hundred. A reversal in the decline of weekly case counts has not occurred for the previous 10 weeks since its peak of the fall surge.
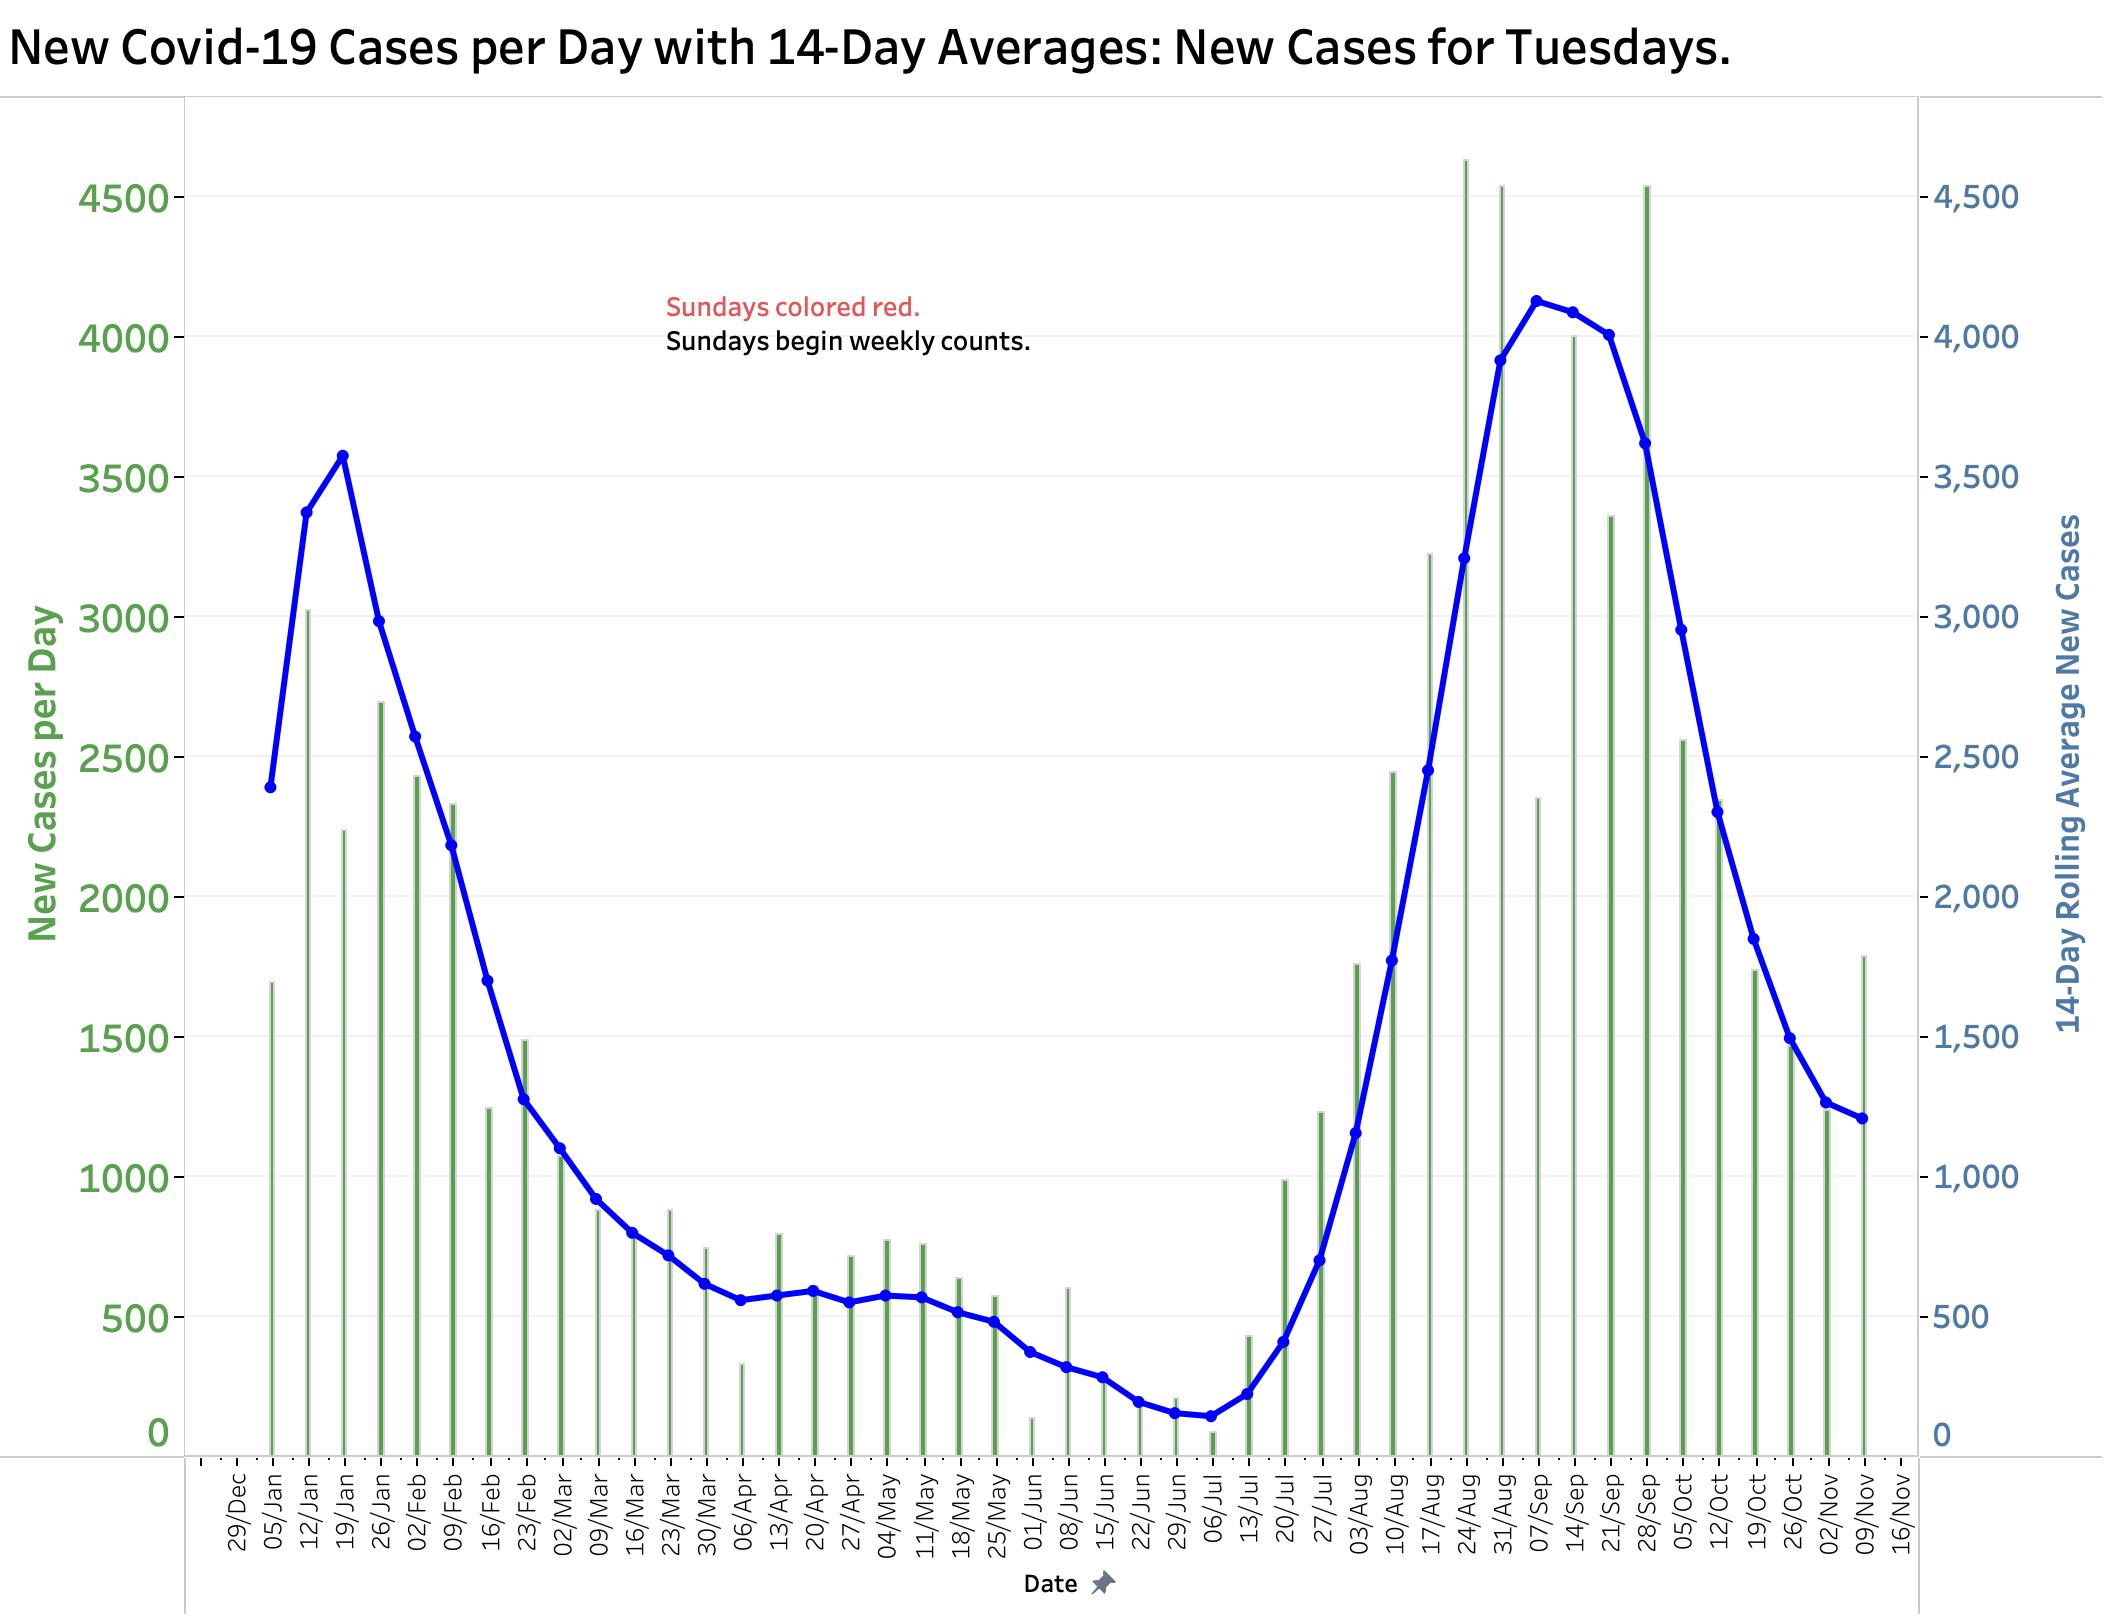
New Cases on a Given Weekday Higher Than in Previous Weeks.
Last Monday’s count was higher than the previous 2 Mondays; Tuesday’s and Wednesday’s than the previous 3 weeks; and Thursday’s (Memorial Day) was greater only than the previous week. Friday’s new case count was lower than the previous week’s, but it was post-holiday.
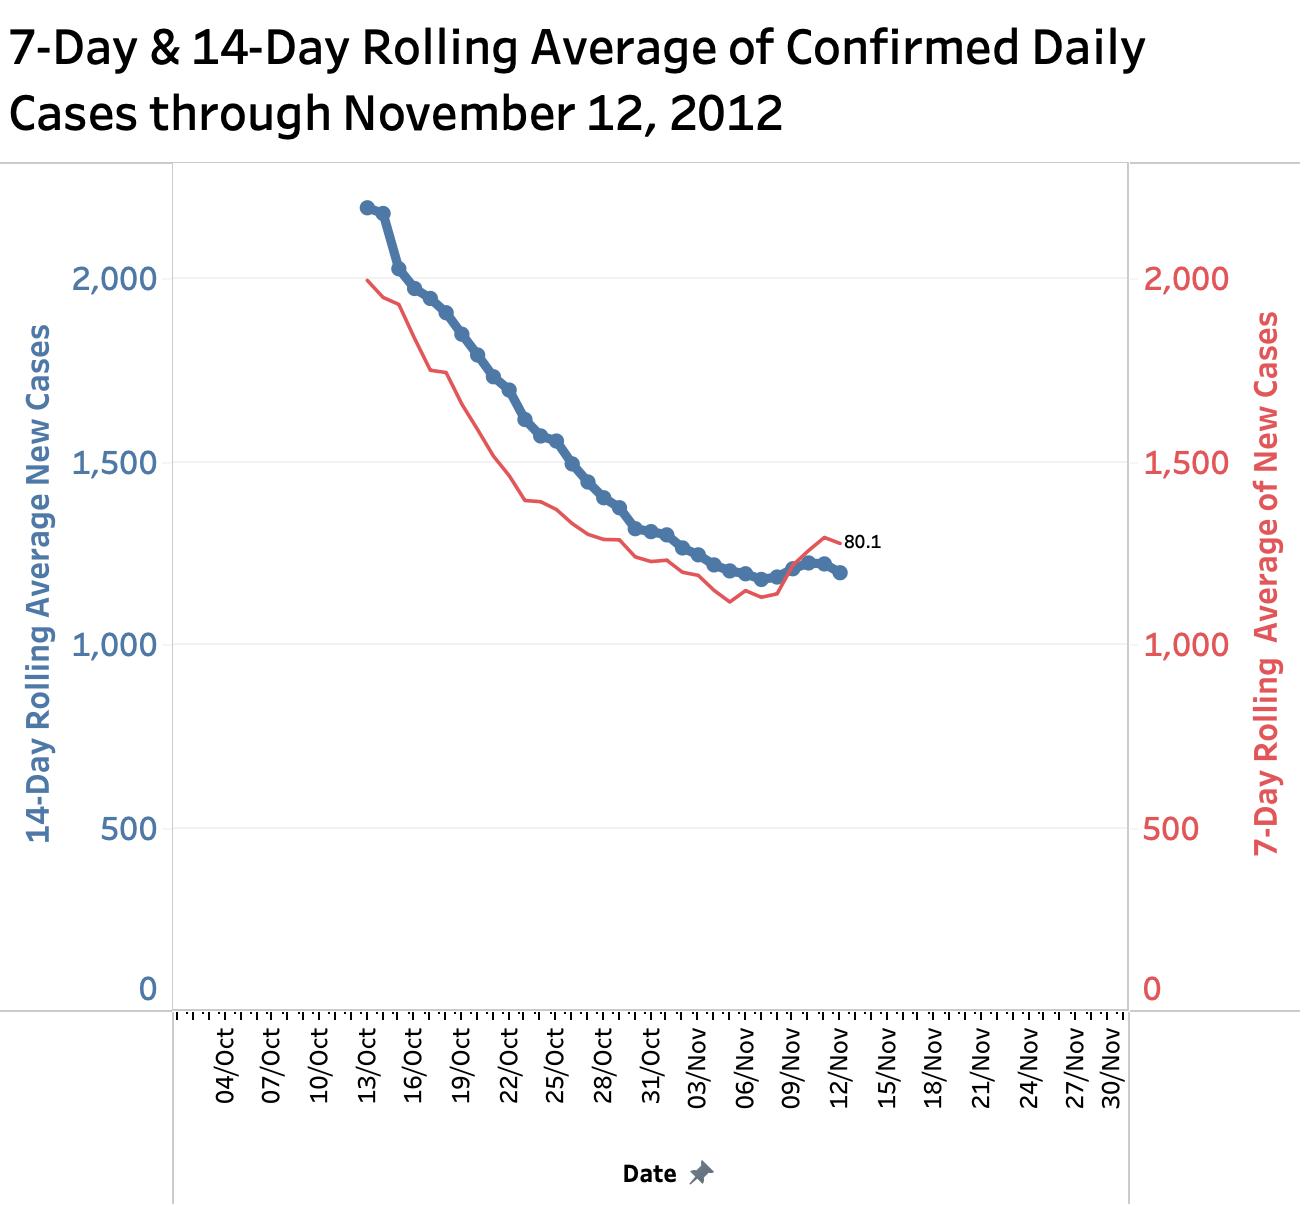
Both 7-Day and 14-Day Rolling Averages of New Cases Are Rising.
The tremendous volatility in day-to-day counts of cases and deaths plays havoc with our ability to plot our course in the short run. For this reason, virtually all trackers of the epidemic nationally rely on averaging counts over a week or more of days to better judge longer term trends. When the 7-Day average is rising faster than the 14-Day one, the epidemic can be said to be expanding. This has been the case in Kentucky since November 9.
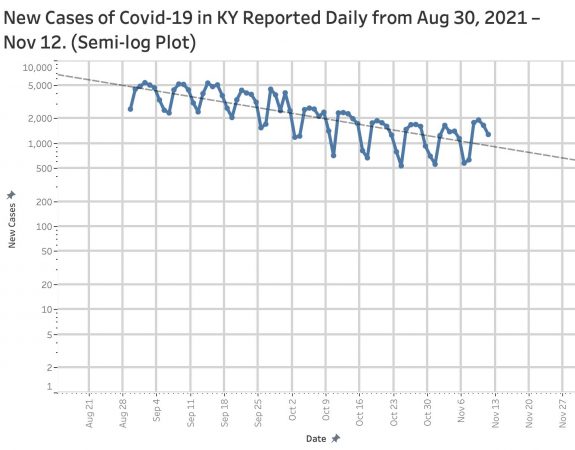
Semi-log-Plot of New Daily Cases No Longer Falling.
When dealing with exponentially changing numbers it can be tricky to judge the rate and direction of change to allow insight into the future. One solution is to is to plot the logarithm of case numbers against time in Semi-log plot. I have found this method to be a useful tool in this series of articles. When the linear trend line in such a plot slopes in a downward direction, it can be said that the epidemic is slowing down. A horizontal trend line indicates a steady state. At best, since mid-October that is where we have been. However, a case-count in excess of 1000 per day is not a happy place to be.
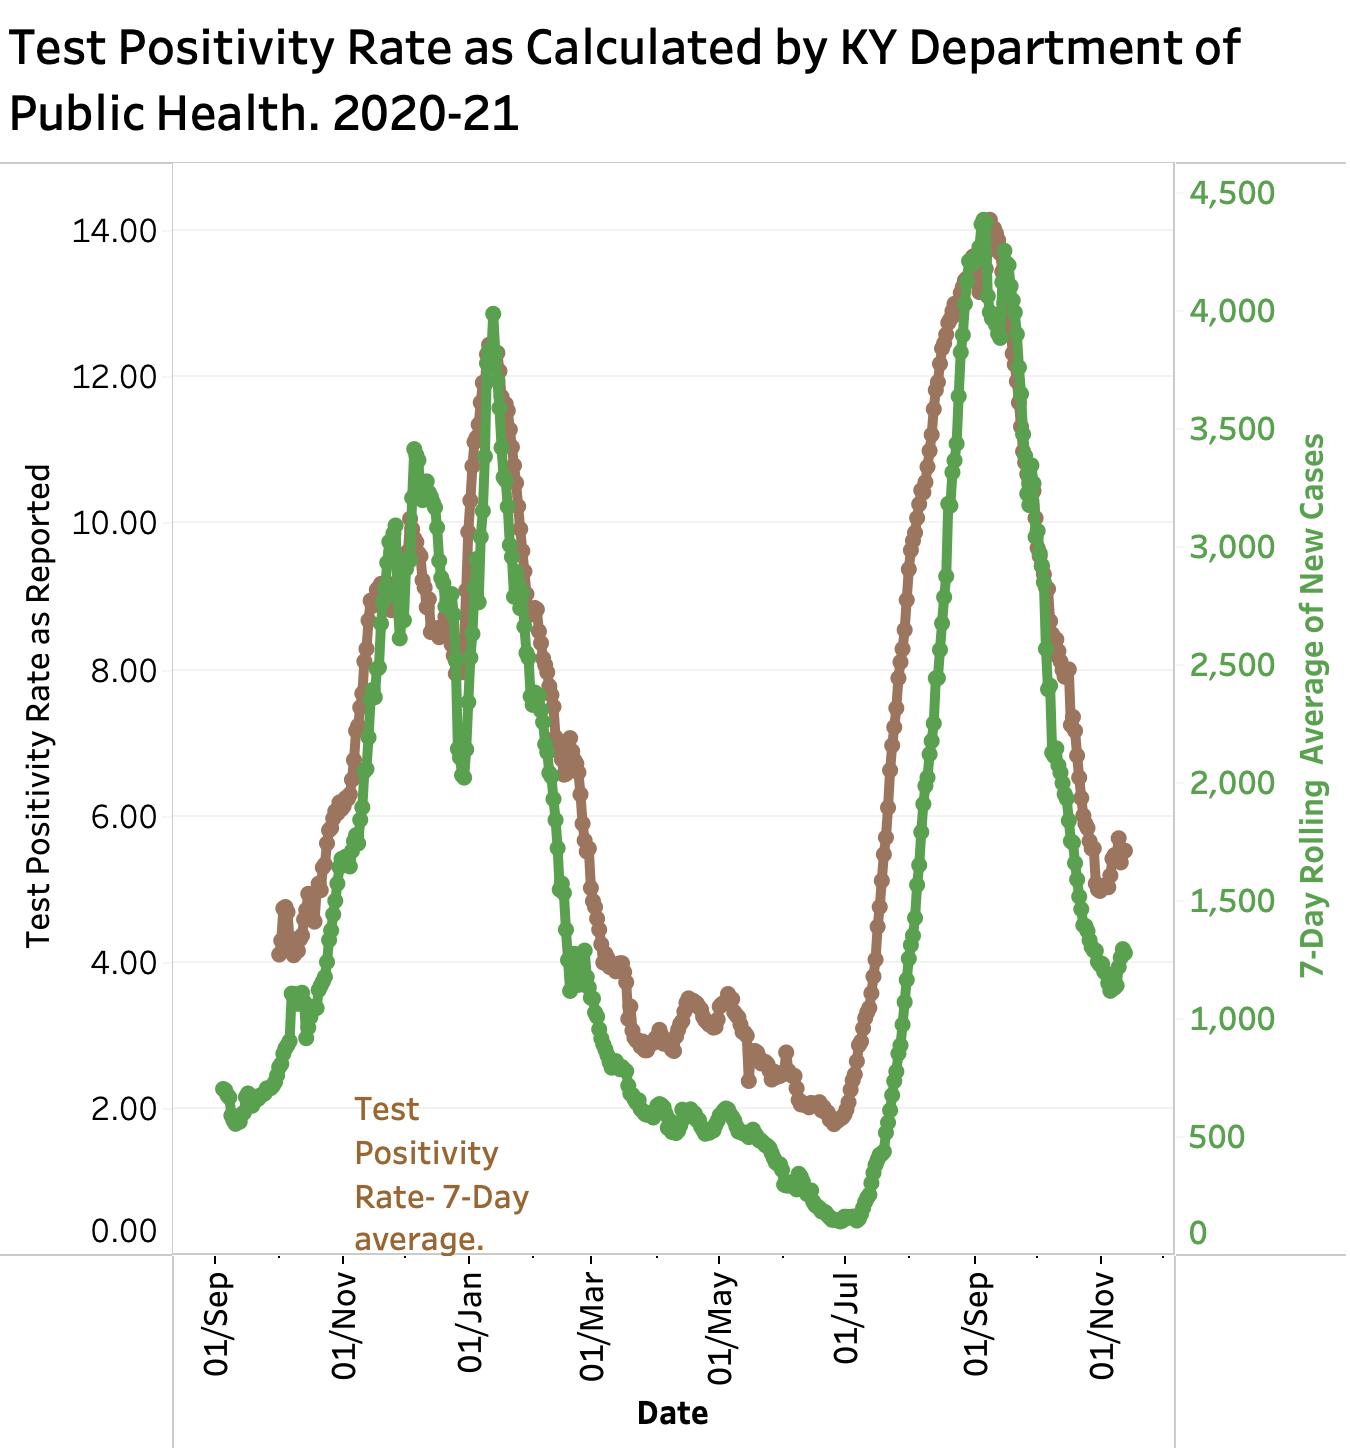
Test Positivity Rate (TPR) Has Been Rising.
If no testing were being done, many fewer cases would be identified and reported. There has been a trend for fewer tests over the past two months, but testing remains at a high level. Kentucky calculates a 7-Day average of the both number of tests performed and the percent of those reported electronically that are positive for the virus. The TPR is one indicator of the prevalence of infection in the community and has tracked closely with both new cases and hospital utilization. Since November 1, a progressively falling TPR has been rising in parallel with the 7-Day case-rate which most recently is 5.53%.
Summary of New Case Indicators.
I began this series of articles in March 2020 seeking a way to best understand visually our path through what has become by any measure a global catastrophe. I believe the measures I have been using correlate well with those of both Kentucky and the nation. Predictions to which the data have led me have by-and-large been on target. These current indicators lead me to conclude that for the past two weeks the direction of our local epidemic has changed in the direction of expansion. The most favorable alternative interpretation is that we have entered a steady-state situation of endemic infection albeit at a troublingly high level.
Other Indicators.
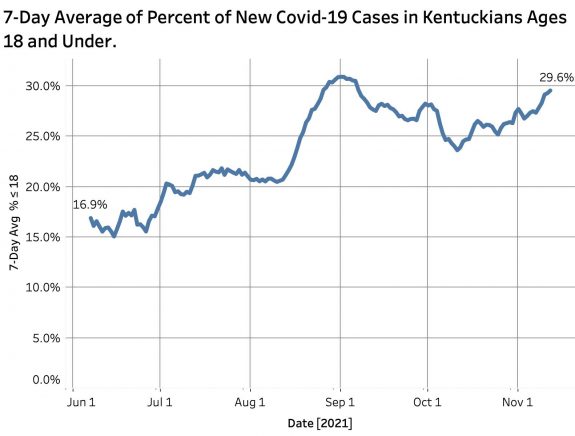
It is also a little disconcerting to see that over the past 4 days and for the first time in many weeks, the number of people currently in-hospital or ICU has been ticking up. Also rising progressively towards its previous peak in early September is the percent of new cases in school-age individuals 18 years old or younger which is now at a 7-Day average of 29.6% of total cases. As expected, the 7-Day average of deaths reported daily is now at 30 and is certain to rise several-fold, the consequence of September and October’s infections.
You can explore the full panel of interactive data visualizations at KHPI’s Tableau Public website.
To Conclude.
My prayer is that the apparent current reversal in epidemic indicators summarized above is a fluke. Our public health reporting systems here and nationally have certainly revealed to us their limitations. They beg to be improved to allow us to deal in a more timely and effective way to the inevitable next epidemic that turns our lives upside-down. My hope is that we Kentuckians and Americans will believe, as I do, that we as a community are no healthier than the sickest among us, and that in our interconnected world diseases like Covid that are anywhere will be everywhere.
Over the past century or more, public health measures have done more to improve our health and prolong our lives than pills or surgeries. Therefore stay healthy!
Peter Hasselbacher, MD
Emeritus Professor of Medicine, UofL
Saturday, November 13, 2021