
Is there any rational justification?
Summary.
This article in a series further examines the prescription of opioid analgesics in Kentucky and Indiana, I identify the individual prescribers in each of some 70 different Medicare-designated specialties in both states who prescribed the highest number of opioid prescriptions. The differences within individual specialties, between specialties, and between the two states are staggering and beggar any obvious explanation. Single or small numbers of prescribers are outliers that shift the averages of their specialties significantly. Even within their own peer group, some pain-management providers are far-outliers. Some cities seem to have more than their share of highest prescribers. Cancer and designated hospice providers to not appear to be big users of opioids in this data. Much “pain-management” probably occurs within specialties traditionally considered as generalist. Generalist specialties should not be considered differently than pain-management specialties in public health and law enforcement efforts to deal with prescription drug abuse and diversion.
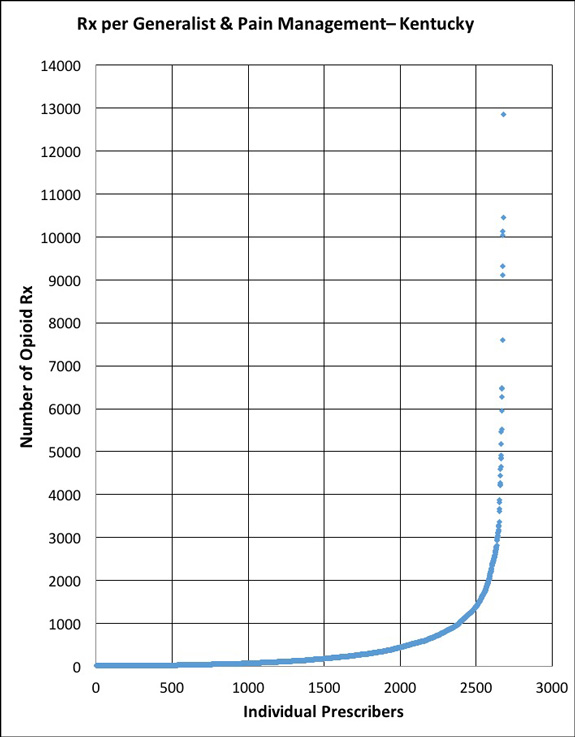
One of the most obvious observations made upon inspection of the 2013 Medicare Part-D prescription database is the extraordinarily wide range in the rate of prescription of virtually all drugs. The most common explanation for the bulk of such variation is simple preference rather than evidence-based medicine. The rate of prescribing of narcotic analgesics by individual providers is no exception to the rule. The chart below plots the number of prescriptions written by each of 2563 Kentucky generalists and 117 pain-management providers to Part-D Medicare beneficiaries in 2013. There is one dot for each individual prescriber. [See earlier articles for a description and limitations of the Medicare database. The database identifies providers by name who prescribe a given drug to more than 10 Medicare patients.]
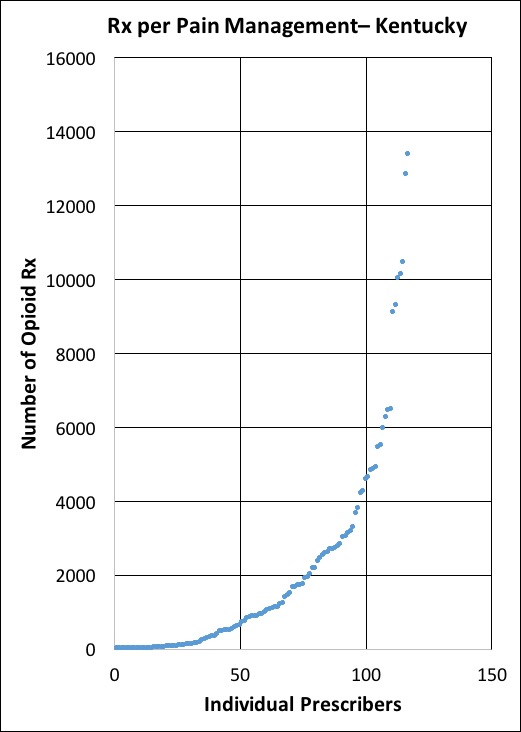
Altogether, providers in these six Kentucky specialties prescribed 1,126,110 prescriptions for opioids. The average number of Rx per provider was 420. However, the prescription rate was skewed heavily to the right such that the median (the middle number in a sorted list) was only 133. The prescription rates at the higher end of the curve ranged from very high to astronomical! The top prescriber was a Lexington anesthesiologist who wrote 13,382 prescriptions for this group of Medicare patients. Statistically, that puts this physician 15 standard deviations above the overall average. Two standard deviations out is all that is needed to reach the customary p?.05 value of statistical significance ruling against chance alone in explaining outlier values. This in-the-next-universe value, and the other outliers on the chart have other explanations behind them that it behooves us to understand– wouldn’t you think? We could be looking at great medicine or something else altogether.
One might anticipate that the curves for the pain specialties (Anesthesiologist, Interventional Pain Management, Pain Management) would be different from that of the “generalist” specialties (Family Practice, Internal Medicine, Nurse Practitioner). Indeed, the median number of prescriptions for pain-management is 943 compared to 128 for the generalists. In addition, a much greater proportion of pain-management providers write more than 1000 prescriptions, a useful break-point for comparisons.

Nonetheless, the curves for the two groups share a basic shape: a heavy skew to the right with some providers hitting out of the ballpark. For example, a Family Practice physician from Lexington prescribing 7596 times to these Medicare patients lies 13 standard deviations above the average for generalists. In fact, only 6 pain-management providers prescribe at a higher rate. Looking at the pain-management providers alone, and making an assumption that this is the peer-group against which one should compare prescription rates, the highest pain-prescriber is still 4 standard deviations above the mean of the same specialties. On the other side of the coin and equally striking is the fact that 50% of the designated pain-management providers prescribe fewer than 1000 prescriptions for opioids! What are they doing differently from the other 50%? What might we learn from examining the difference?
There is no doubt that Medicare’s classification of a given provider’s “specialty” will be erroneous in some unknown number of cases. On the other hand, many self-designated generalists emphasize pain management or otherwise prescribe large amounts of narcotics in their practices. After all, there are only 117 providers in the database that Medicare places in the pain-management specialties, fewer than I had guessed. The presence of high-prescribers in both groups and the shear number of prescriptions written by the generalists as opposed to pain-managers (884,257 vs. 241,853) dictates that attempts to understand and control the overuse and diversion of opioids should approach both clusters of specialties in the same way. Pain doctors need not feel picked on!
Comparison with Indiana.
In earlier articles, I detailed the rate of narcotic prescription in Indiana, and in particular in small towns surrounding the narcotic-, HIV-, and Hepatitis-C plagued town of Austin, Indiana. I do not believe it is coincidental that the Indiana hotspots for the prescription of Opana (the Austin drug of choice) are within 40 miles of that town. Is there any conceivable reason why the small towns of New Albany and Seymour, IN should be third and fourth only to Fort Wayne and Indianapolis in the number of prescriptions of Opana written?
Here are the prescribing profiles for the generalists and pain-management providers of Indiana as defined above for Kentucky. The shapes of the curves are very similar. The most striking difference is that Kentucky pain-managers prescribe more than Indiana’s. Note the difference in the vertical scale in the charts of the two state’s pain-managers: Kentucky’s is double that of Indiana. I will also place a table of descriptive statistics comparing the two groups of providers in both states.

Where and how do the highest-prescribers practice?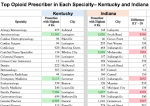
There are high prescribers or far-outliers in many of the specialties identified by Medicare. In the attached table, I identify the highest-prescribing individual in each major specialty. Highlighted in green are the ten highest prescription rates. Pain-management providers had the highest rates of all, but there were very active opioid prescribers in several other specialties. No cancer or end-of-life provider was anywhere near the top of this list. I wonder if healthcare providers in these specialties and cities would be able to predict who their highest prescribers are?
A few cities had more of their share of highest-prescribers.
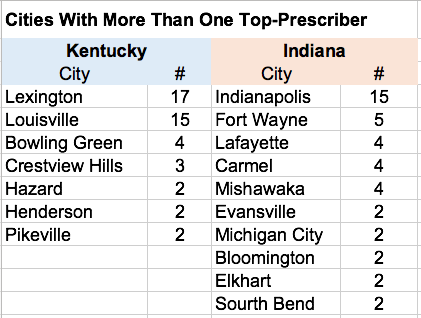
Lexington is home to the highest provider of 17 different specialties and Louisville to 15. Recall that there is only one “highest-provider” per specialty.
Highest-Prescribers in Kentucky and Indiana compared.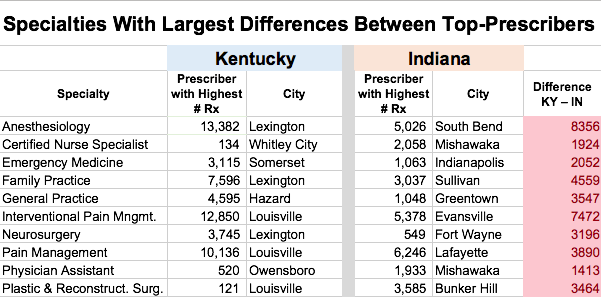 To explore another measure of practice variation, I calculated the difference in prescription rates between the top prescribers in each of 64 specialties in Kentucky and Indiana. These could be striking, exceeding 1000 prescriptions in 11 specialties. Of these, the rates were higher in Kentucky for: Anesthesiology, Emergency Medicine, Family Practice, Interventional Pain Management, Pain Management, Neurosurgery, and Physical Medicine. The specialties in Indiana where rates were higher included: Certified Nurse Specialist, Internal Medicine, Nurse Practitioner, and Plastic & Reconstructive Surgery. Inspection of individual provider-files suggests that outlier prescription rates by one or a handful of prescribers can provide an explanation.
Conclusion.
This prescribing data can be sliced and diced ad infinitum, but the overwhelming immediate conclusion is that there is colossal variation in the way physicians and other providers prescribe opioid analgesics. In my opinion, based on similar examinations in a variety of medical areas, the main driver of this variation is not going to turn out to be best medical practices or even medically necessary practice, but individual personal preference instead. In the domain of controlled substances, one contributor to personal “preference” will be intentionally criminal behavior, and another unintentionally uninformed or sloppy medical practice. I maintain that it should be the responsibility of all physicians to sort out for our public the good from the inferior, the unnecessary, or the illegal. If we don’t do it, we pass on that ultimately professional responsibility by default to law enforcement and civil court action. Being seen to look after our own house can only restore our collective reputation among our patients, for those who pay the bills for them, and for those who would take our places as health care providers of the future.
Peter Hasselbacher, MD
President, KHPI
Emeritus Professor of Medicine, UofL
September 7, 2015
Look it up yourself!
Medicare made available today a “Part-D Prescriber Look-up Tool” that allows anyone to do searches without a high-powered computer or software. You will need to enter a city and state and/or a providers name. You will get a list of providers, and if you click a name you will get a list of all drugs prescribed to more than 10 patients by that provider with the number of prescriptions and the cost.
A more sophisticated interactive portal than the “Look-up” allows more refined searches with the ability to download whatever subset you want in an Excel or other format file. For example, you could download an Excel file with the prescribing data for all the Family Physicians in Ashland, Kentucky or all providers in Kentucky who prescribe Opana.
If you want the whole tamale, the database and some subsets of manageable size are also available from Medicare: Here you can also access a file that is based on individual drugs and not the prescriber. The drug-based file does not identify the prescriber, but includes even drugs prescribed to fewer than 11 patients by a given prescriber and is therefore more complete.
Contact me if you need help. Have fun!
Peter