
Without further changes in public behaviors, at this rate of epidemic expansion, Kentucky can hit 10,000 new cases per day by the end of August.
Yesterday, Friday August 13, there were 4009 new cases of Covid-19 reported in Kentucky. The last time more than 4000 cases were reported was January 14 when we were still in the worst of Covid times of the Commonwealth. The highest daily report of new cases to date was 5705 on January 6. Review of daily case reports, test positivity rates (TPR) and Covid-19 hospital utilization all reveal that we are circling back from the lowest indicators of epidemic activity back to the highest in a matter of only 6 weeks.
The usual displays of daily, weekly, and monthly cases, deaths, and tests are available on KHPI’s Tableau website. Below are three different data visualizations that show were we have been, and where we appear to be going.
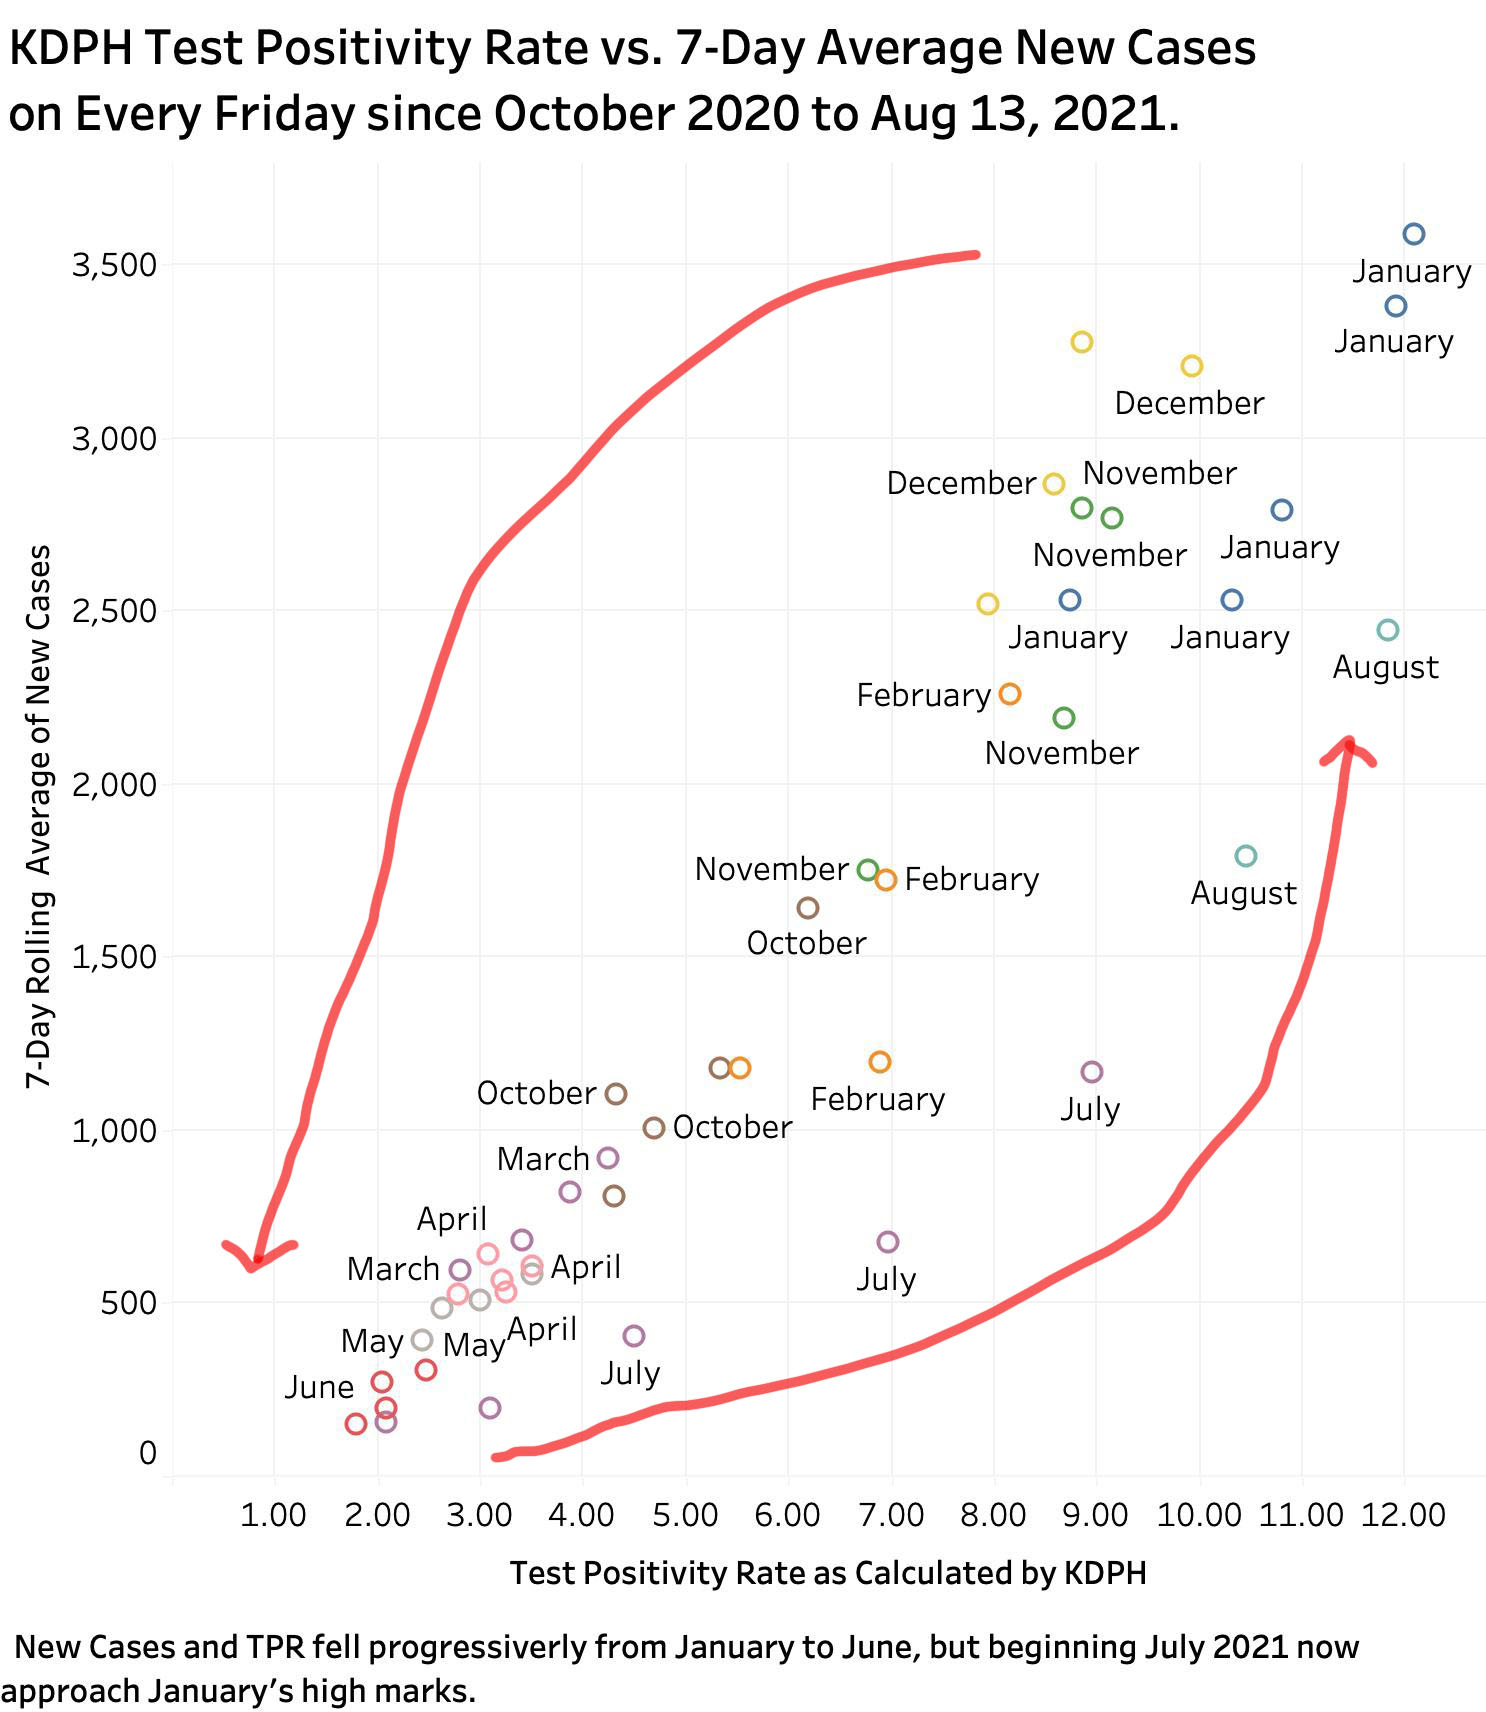
Beginning last October, both TPR and new cases rose to their peak values in December and July of 2020-21. By June 2021, the availability of vaccines and at least some adherence to public health measures drove both measures down to the lowest levels of the entire epidemic. We were feeling good about things. Masks came off, people got together, vaccinations stalled, and the Delta variant entered the scene. Much faster than most of us (including me) could imagine, we have in the span of only 6 weeks rocketed back to the worst of our Kentucky epidemic experience.
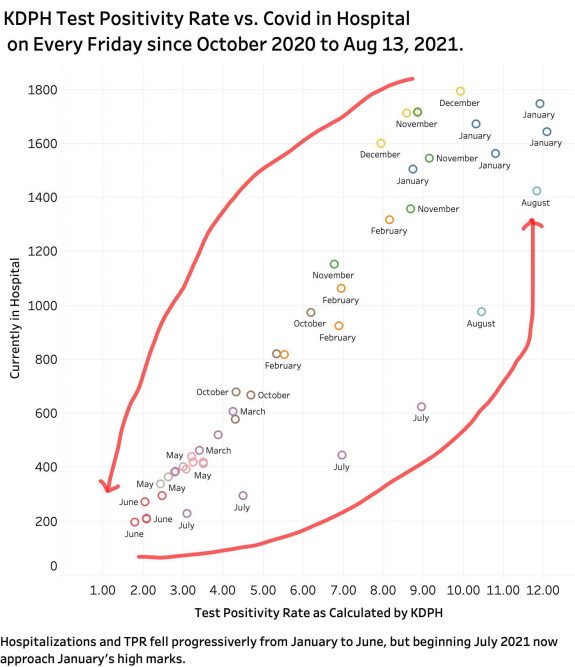
Our hospitals are getting clobbered. The corresponding plot below puts us right back into December-January territory. This is going to hurt!
We will not have additional case and death updates until next Monday evening. I have to trust the good sense of Kentuckians that we are buckling down again in the interest of protecting health and our economy and keeping ourselves and our children in school and the work places. However, unless nothing else changes, and based on actual daily reported cases since last July 1, we are on a path to disaster.
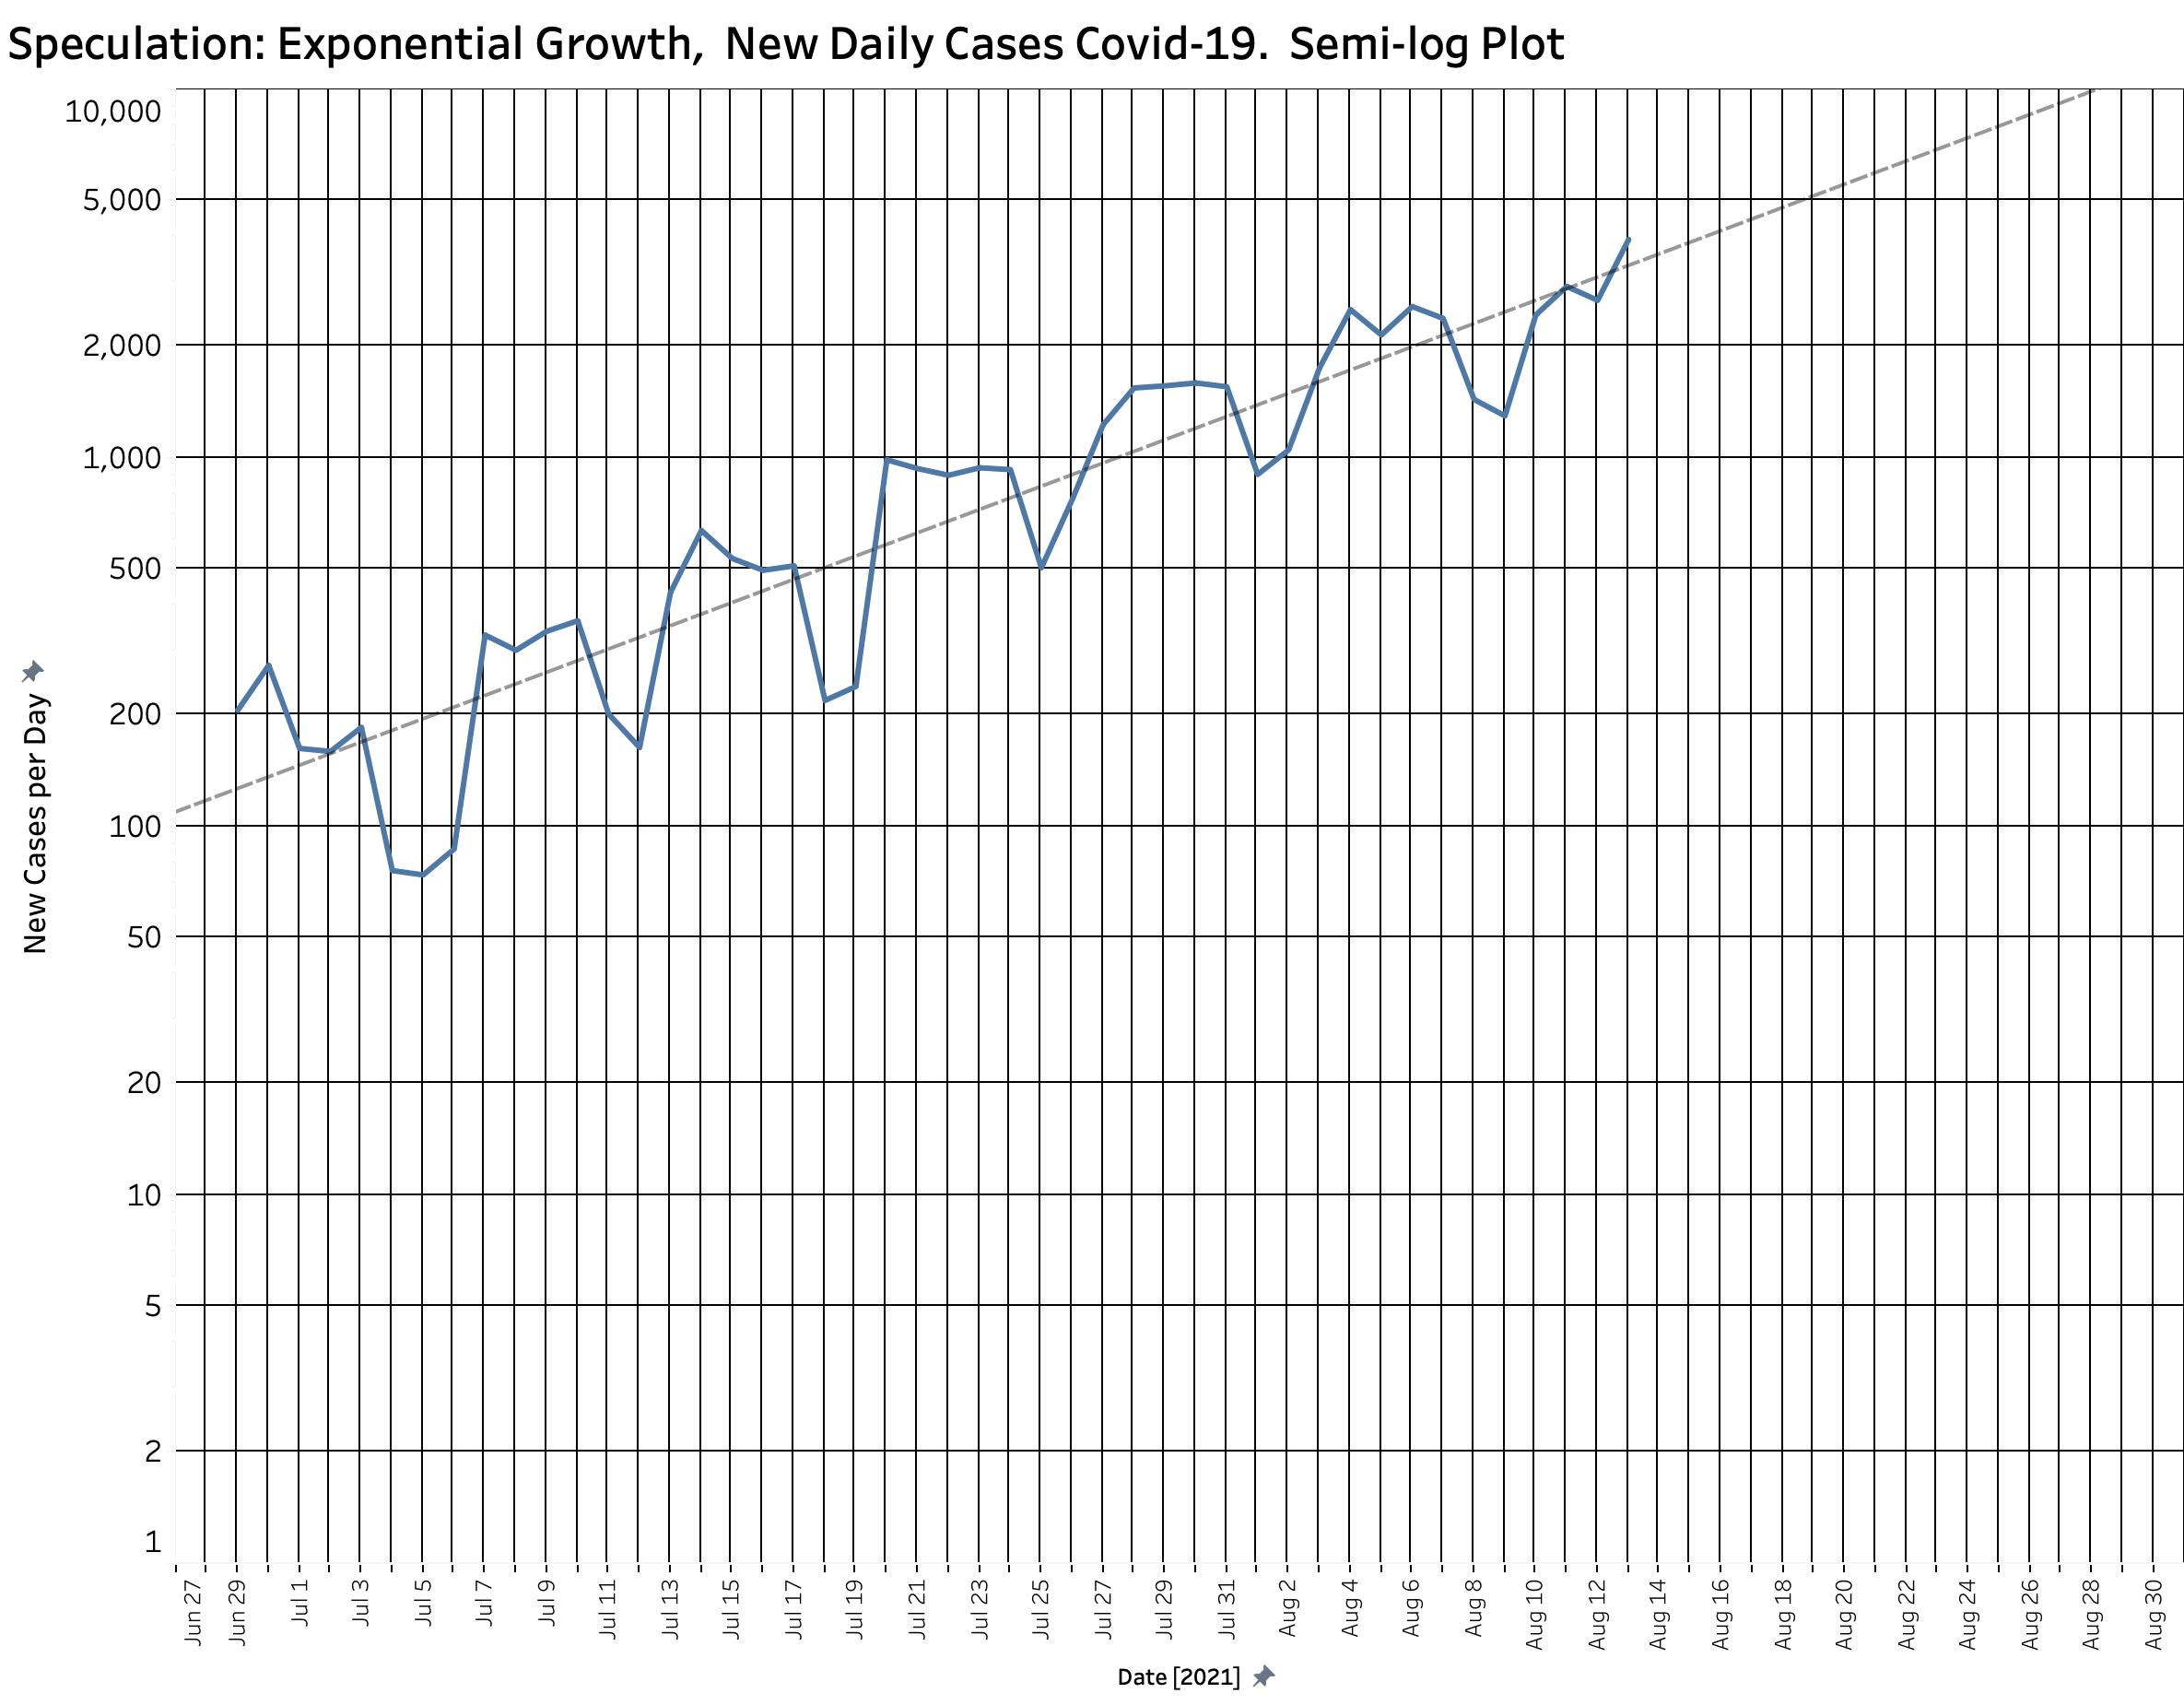
[Plotting cases against time on a semi-logarithmic graph turns a curved exponential line into a straight one. The straight line shown below is highly statistically significant even with the day-to-day variation in case counts. (R-squared= 0.83, p= 0.0001.)]
As impossible as we would like to believe, this projection (which has proven accurate so far) would forcast 5000 new cases by August 19, and 10,000 by August 28, doubling every 9 to 10 days. We have the tools available to lessen the damage and put us back on a glide slope to a more normal way of life. The CDC, national and Kentucky public health officials and healthcare providers, the Kentucky state school board, colleges and universities, and private employees are taking matters into their own hands by enforcing pubic health protections and even mandatory vaccination. Our Governor and his cabinet are trying mightily to guide us out of this wilderness but are opposed by self-serving individuals and political entities within the state offering nothing more than a let-er-rip approach. The graphic above shows where that will take us if we do nothing. We are not lemmings. I believe that the better and wiser angels of our nature will guide us out of this nightmare.
Peter Hasselbacher, MD
Emeritus Professor of Medicine, UofL
14 August 2021