
As of Wednesday September 1, several lines of data point to a decreasing rate of new reported cases if not a peaking– albeit at record high levels. However, hospitalizations and deaths are expected to rise further!
Cases:
It’s hard to be content with 4941 new cases Wednesday. Last week delivered the highest number of cases in any week of Kentucky’s epidemic, even higher than those of last December and January. Except for one aberrant reporting day on January 6, last week contained the two highest daily case counts for the entire 544 days of known Coronavirus in our state. The 28,850 new net cases added last week (from Sunday through Saturday) were 2,423 more than the highest week of last Winter! This August had only 618 cases fewer than the previously high month of month of January 2021. Today’s 7-Day average of new cases of 4,212 is the highest to date even with the low counts over the weekend. The 14-Day average is also at a record high.
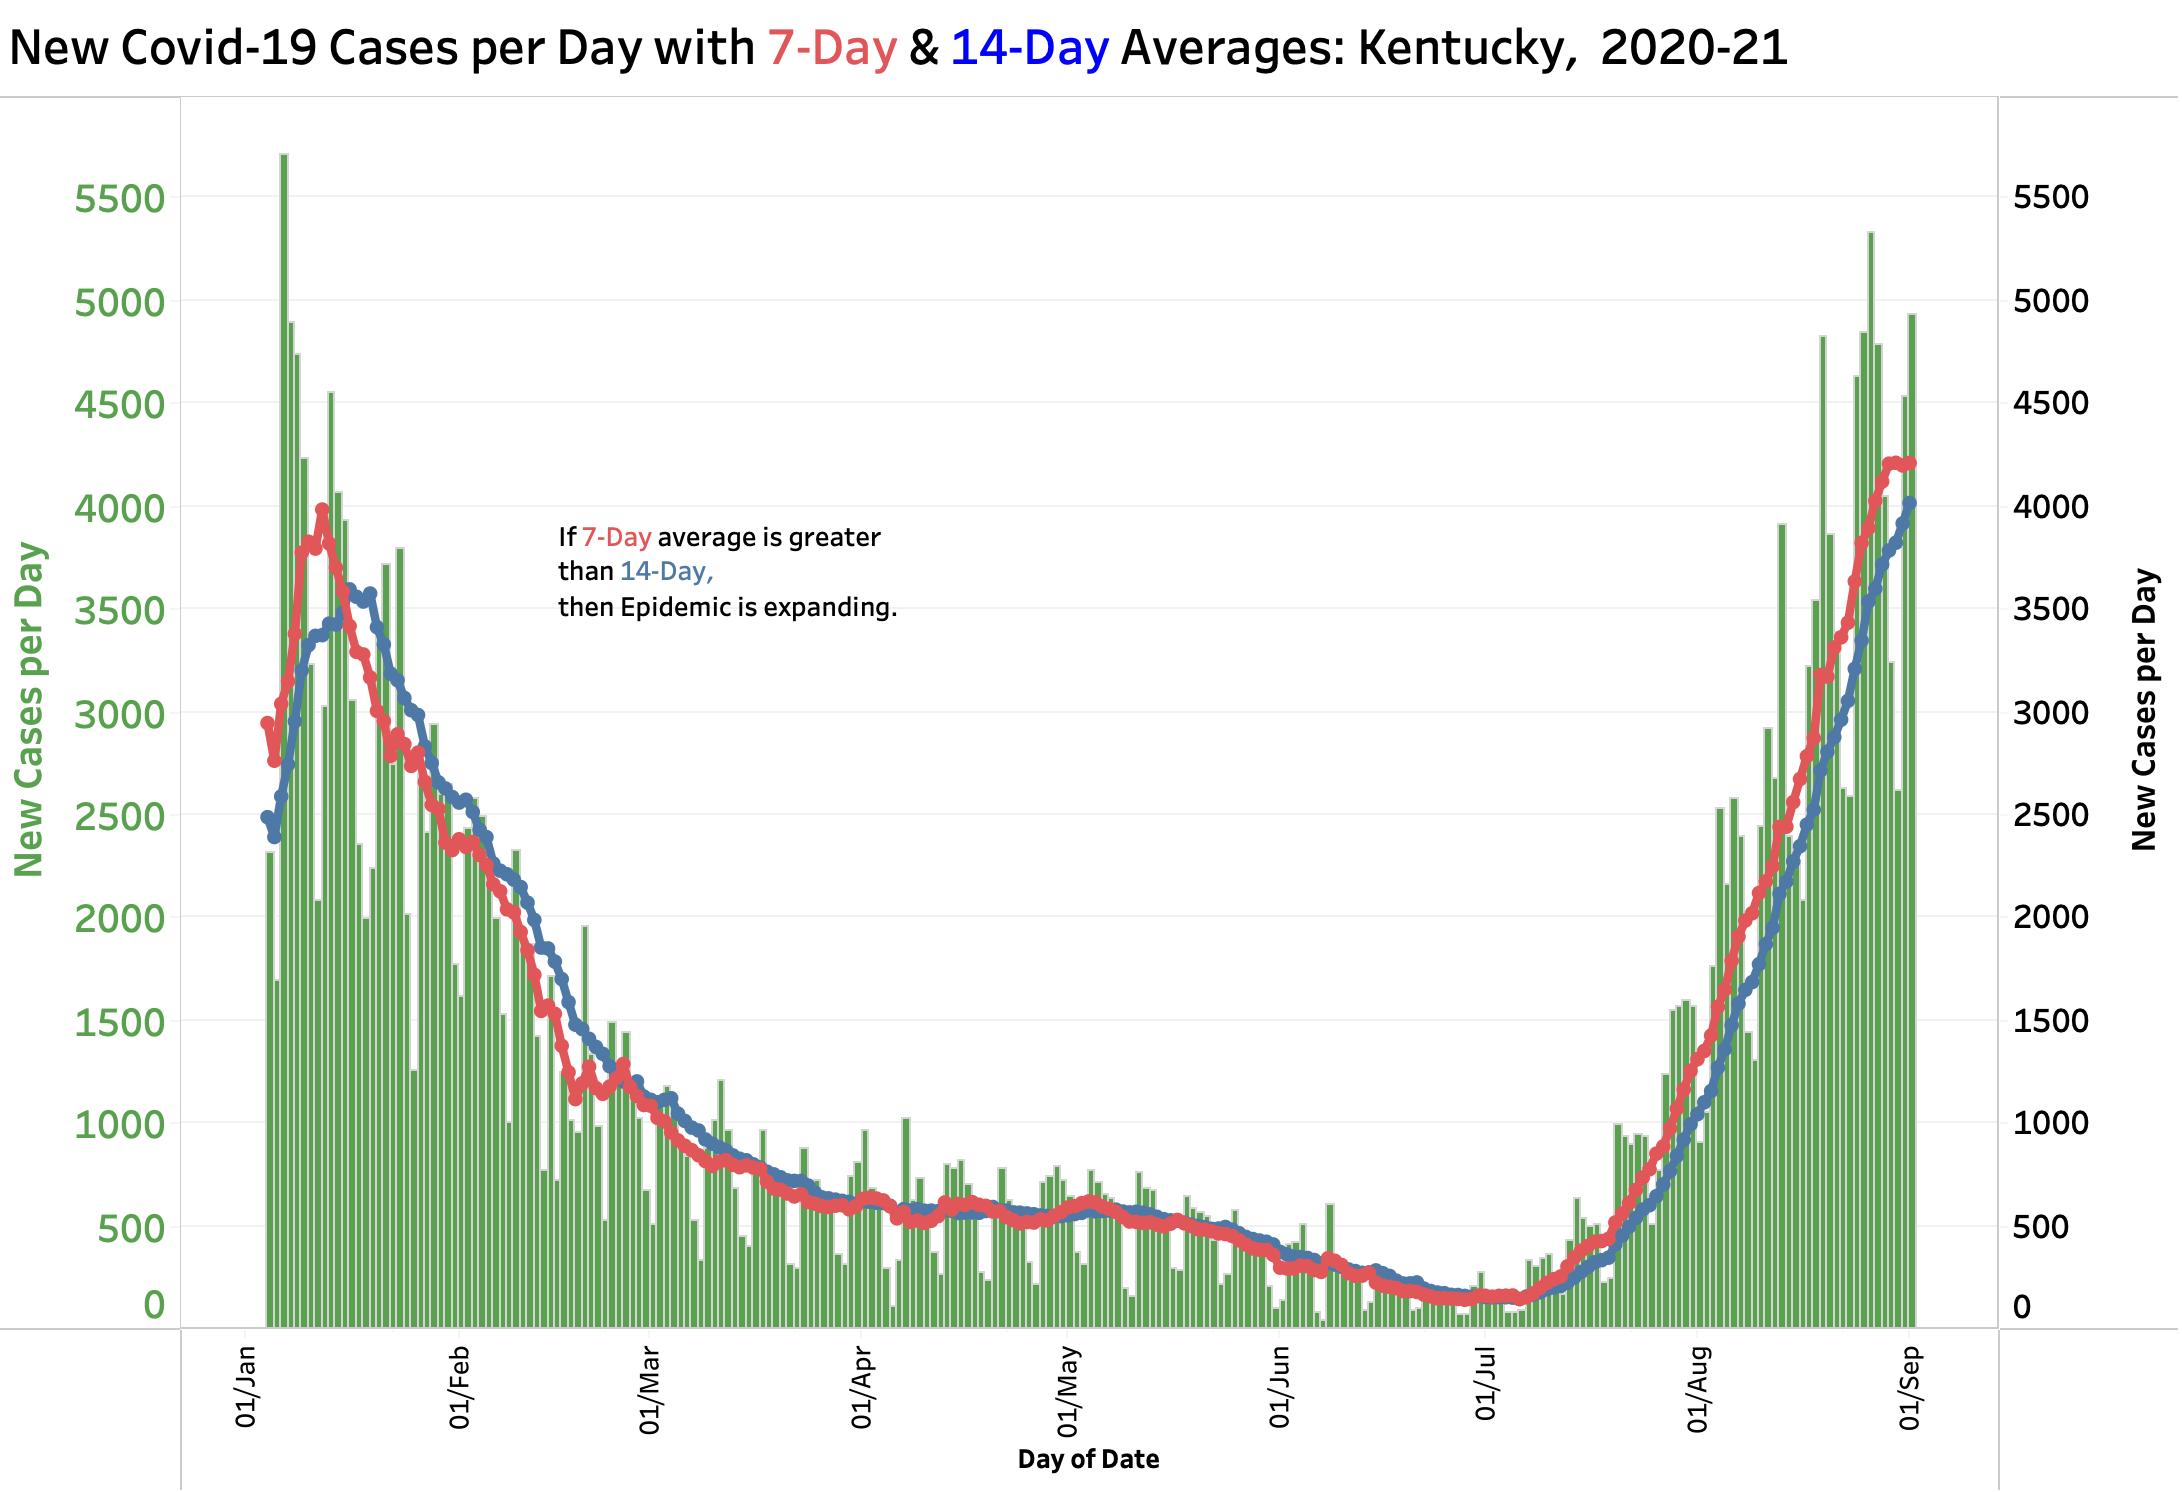
7-Day and 14-Day Averages of New Cases.
When the 7-Day average of new cases is higher than the 14-Day average, the epidemic is expanding. When the 14-Day average is higher, the reverse is true. The difference between the two averages gives a measure of the the rate of expansion or contracture of epidemic spread. While the 7-Day remains higher as of 9-1-2021, the difference between the two is as small as it has been since early July. Until the last day of June when our epidemic was still shrinking, the 14-Day average was higher.
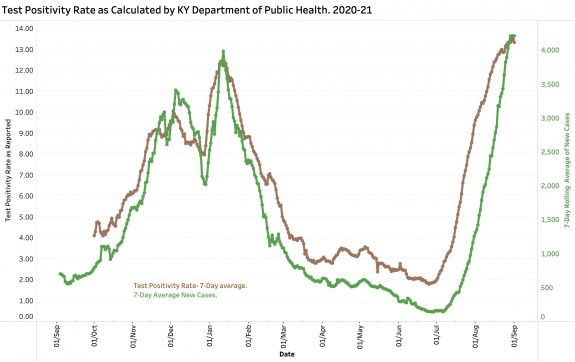
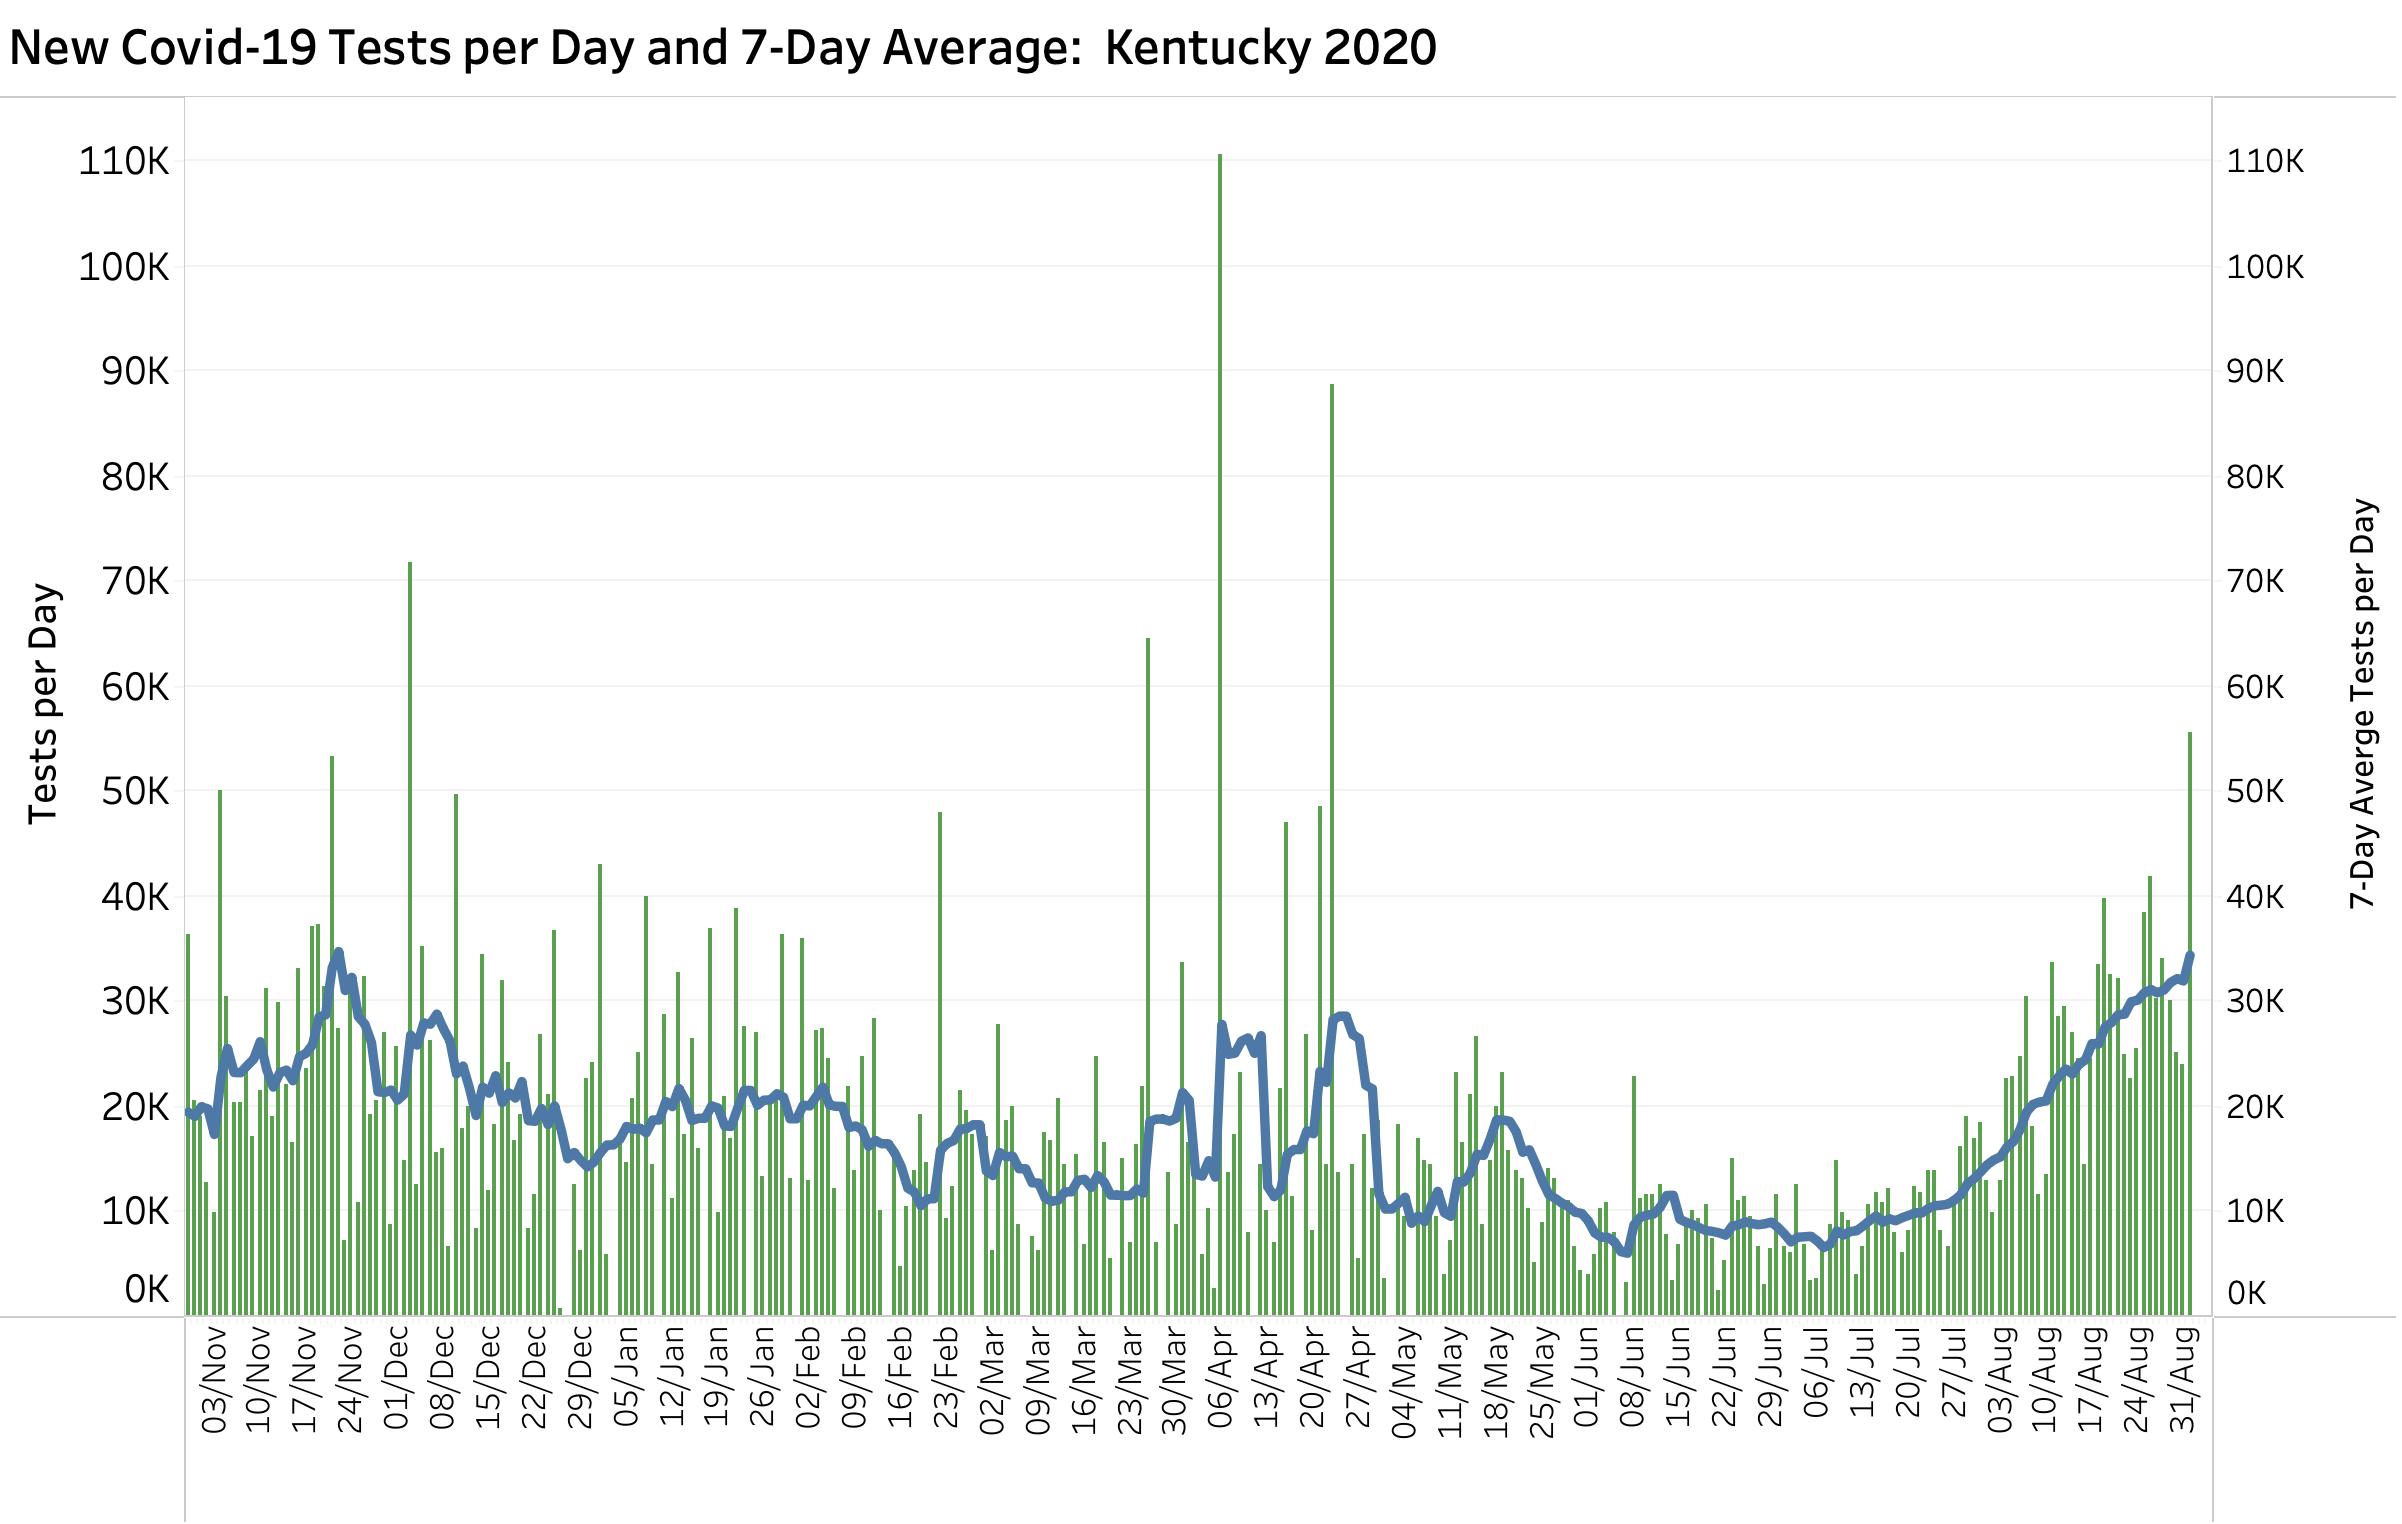
The Test Positivity Rate also has been rising rapidly to new highs, but recently appears to be rising more slowly. However, it remains at record high levels. The 7-Day average of New Tests per day is at its highest level since November 22 and still rising. More people are getting tested. Testing more asymptomatic individuals will cause the test positivity rate to decrease.
So why does this glass-half-empty analyst see a glimmer of a hope that things are slowing down? Since March of 2020 I have been slicing and dicing the daily basic reports of cases, deaths, testing, and hospital utilization data seeking a way to answer the question “are we winning yet?” This self-assigned task was made more difficult by the existing lack of an organized and uniform testing and data collection system in a Commonwealth underlain with multiple under-supported and semi-independent public health departments. Numbers varied dramatically depending on the day of the week or the presence of holidays. There were built delays in reporting to the state public health systems– sometimes dramatic ones! Large backlogs of tests, cases, and deaths were reported periodically. There were state and contractor computer system failures. No database of historical state epidemiologic data was made available to the public even when requested. I had to depend on outside organizations for things as basic as historic case and death tallies by Kentucky county. Against this background, let me outline why I think the hard-fought efforts of Kentucky’s Public Health Department and the individual citizens of Kentucky may finally be having a demonstrable effect despite well-organized political and ideological resistance.
Case counts vary rather predictably depending on the day of the week. For example, since March 1, 2021, daily counts have on average been lowest by half on Mondays, followed closely by Sundays, rising considerably on Tuesdays, reaching a weekly peak on Wednesdays, and then gradually decreasing through Saturdays. Beginning in early July, each day of the week had case counts markedly higher than the same day of the previous week. This changed beginning Monday, Tuesday and Wednesday of the current week when the weekday counts are similar to those of the preceding week. (You can click through the individual weekdays on KHPI’s Tableau Public data visualizations.)
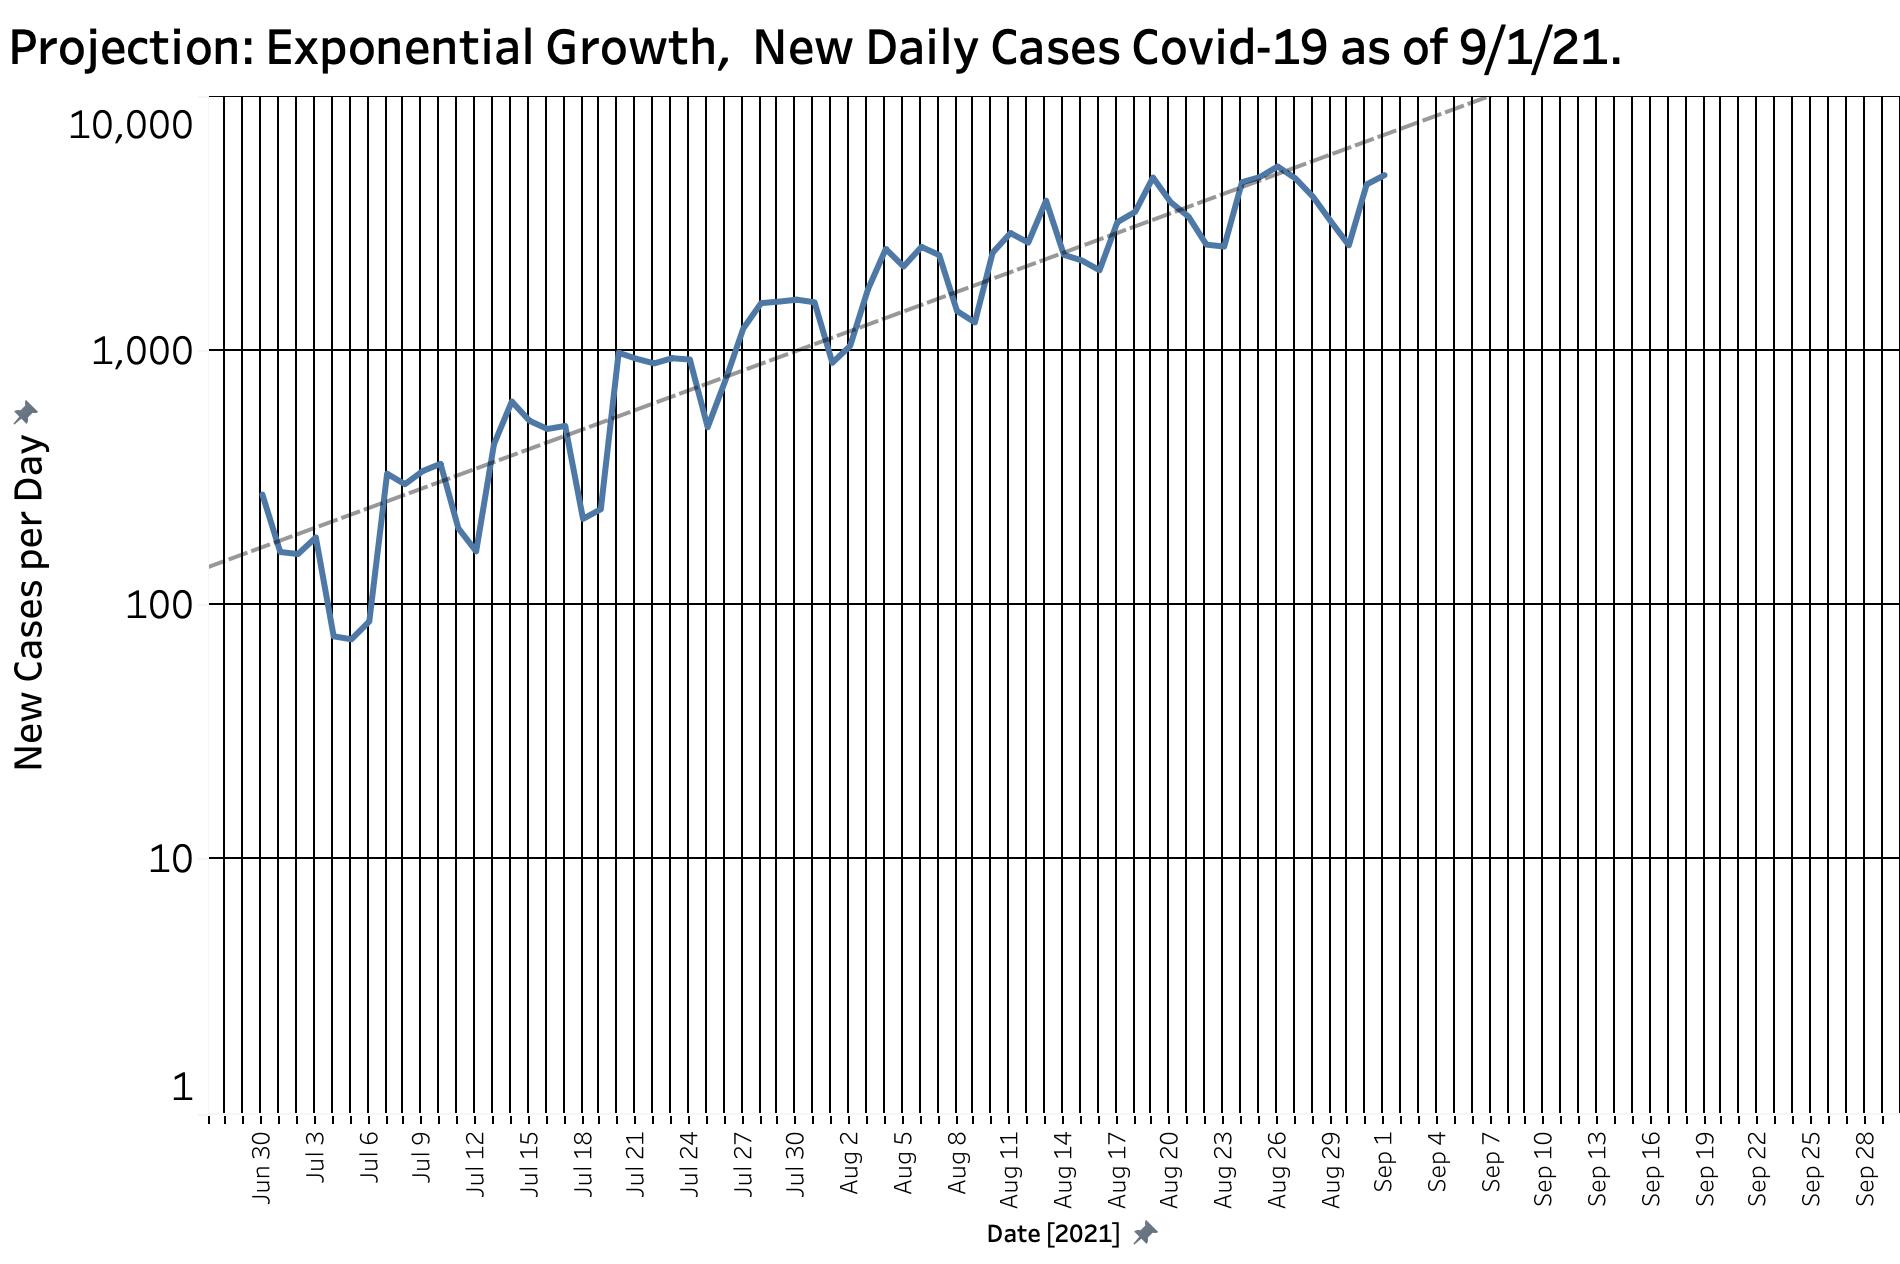
Semi-log plots.
Simply inspecting curves of aggregate case counts or even rolling averages on the usual rectangular/linear graph paper is not particularly helpful right now. The curves still ascend in a near-vertical manner. That is what exponential growth looks like. Plotting exponential or rapidly rising data in a different way can give useful insights. Graphing new cases as a function of time using a logarithmic scale for cases and a linear scale for days allows the same plot to include both small and large numbers. Furthermore, a simple linear regression on such a plot yields a straight line when the rate of exponential growth is not changing. This can allowing some degree of forecasting the future. For example, during last July, new daily cases were doubling about every 10 days! I predicted then we could hit 5000 cases per day by early August which was pretty much on target. During the weeks of August, semi-log plots of both daily cases or rolling averages have begun to fall noticeably below the predictive trend line. During August, the doubling time of daily cases lengthened to 17 days. Instead of reaching 10,000 cases per day by early September as July’s data would have allowed, and if nothing else changes, we could still reach that number by the end of September. A “plateau” or bending of the curve is simply not good enough! Hopefully Kentucky’s citizens will continue to make effective responses to our common predicament. Eventually, even if we do nothing as some would recommend, the epidemic wildfire will burn out– but as with the forest fires of our western states and elsewhere in the world, at what cost? We are asking people to do hard things. We have to support them.
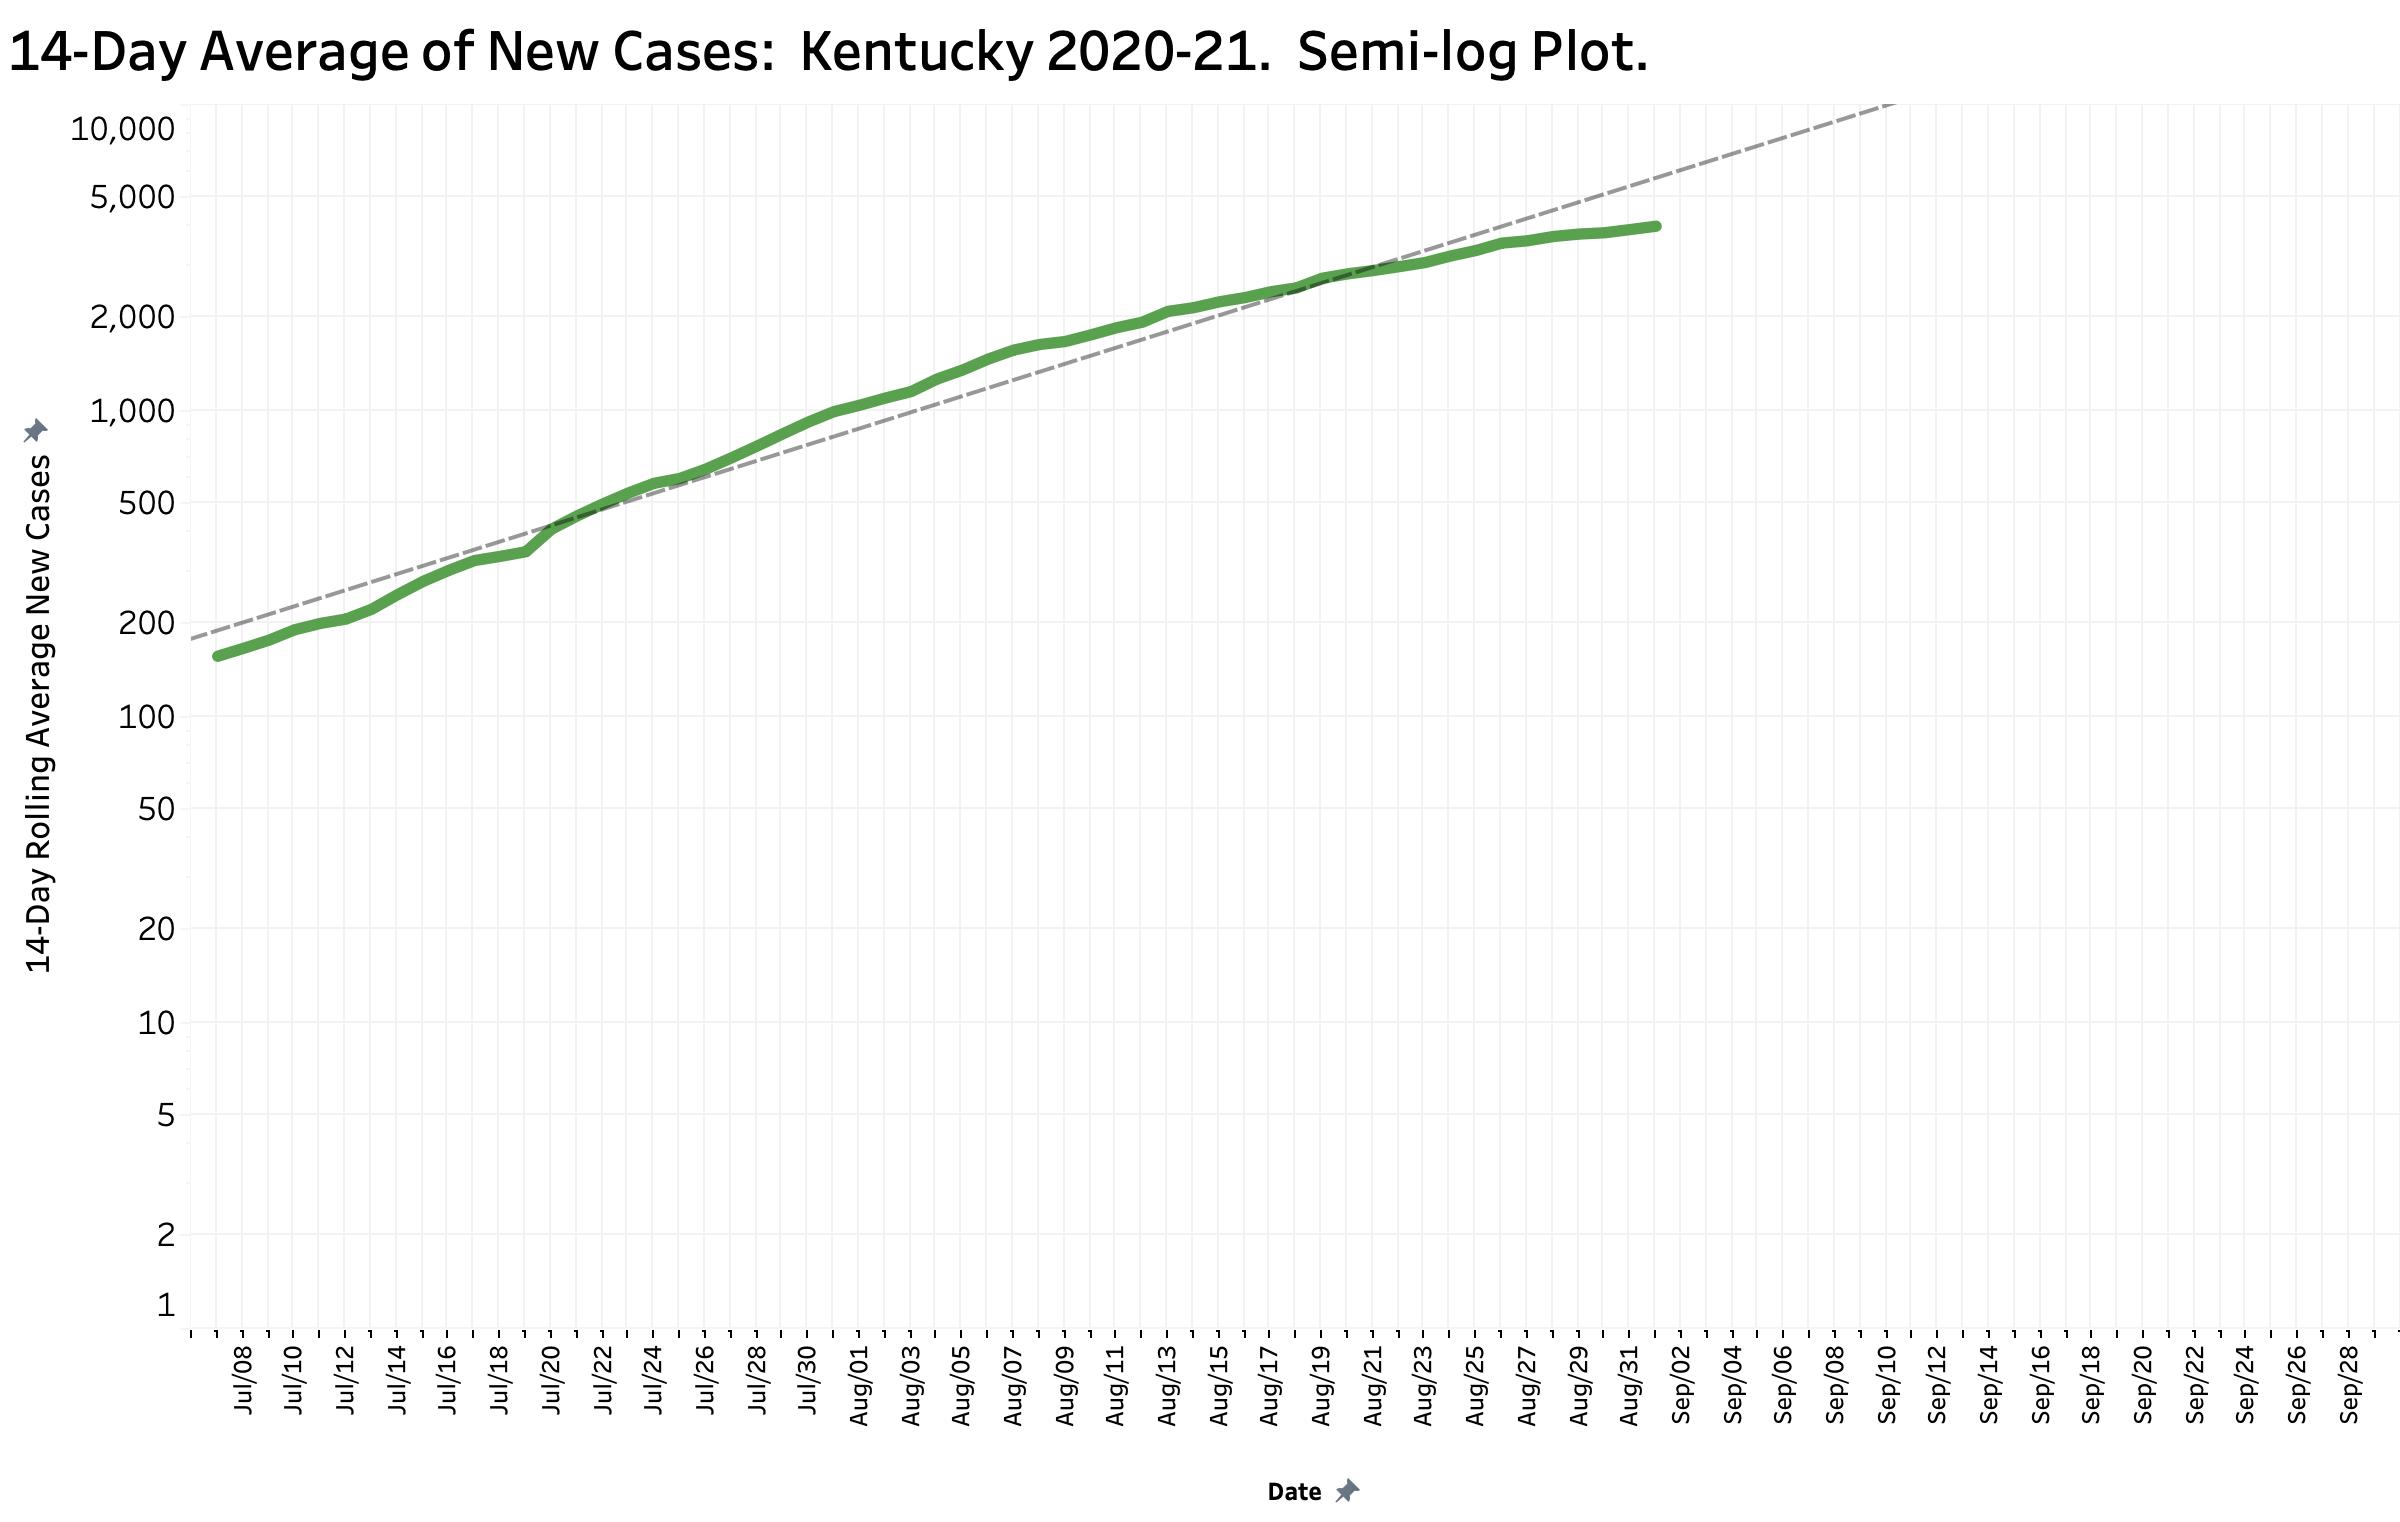
Below is another view plotting new cases in a semi-log manner but using the 14-Day average of new cases to smooth out the curve. Over this two month interval, the curve first rose and then fell below the trend line.
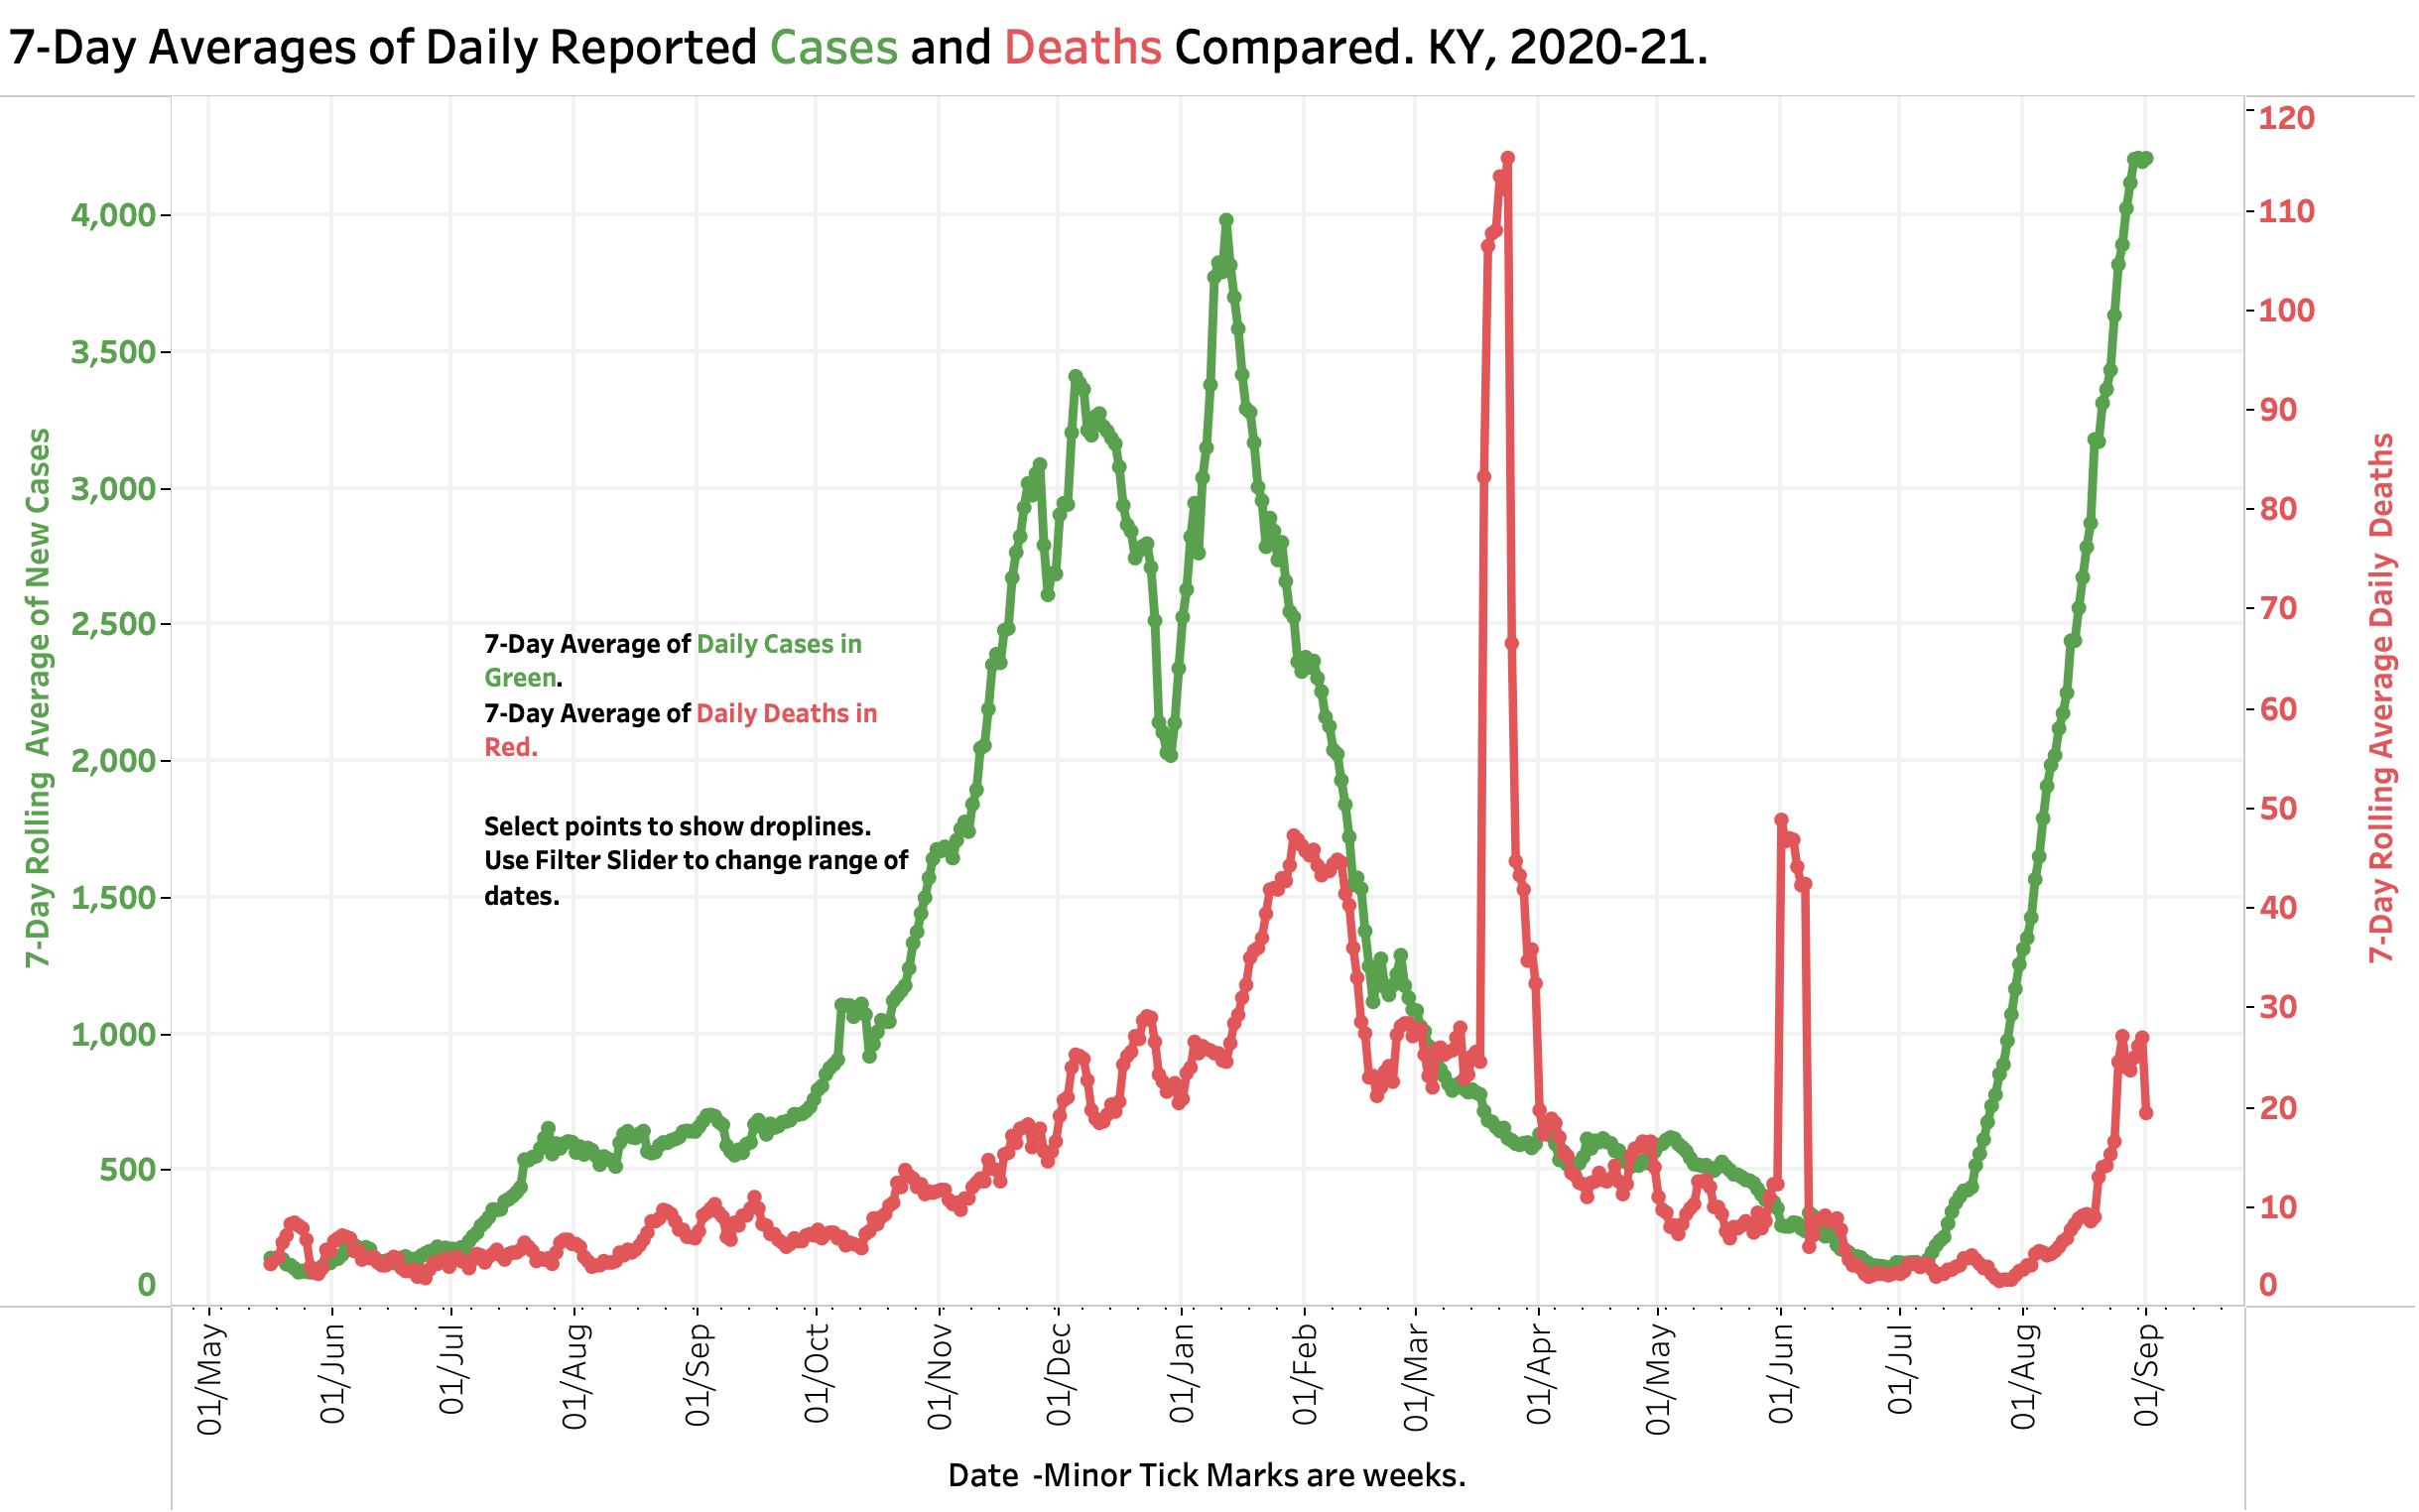
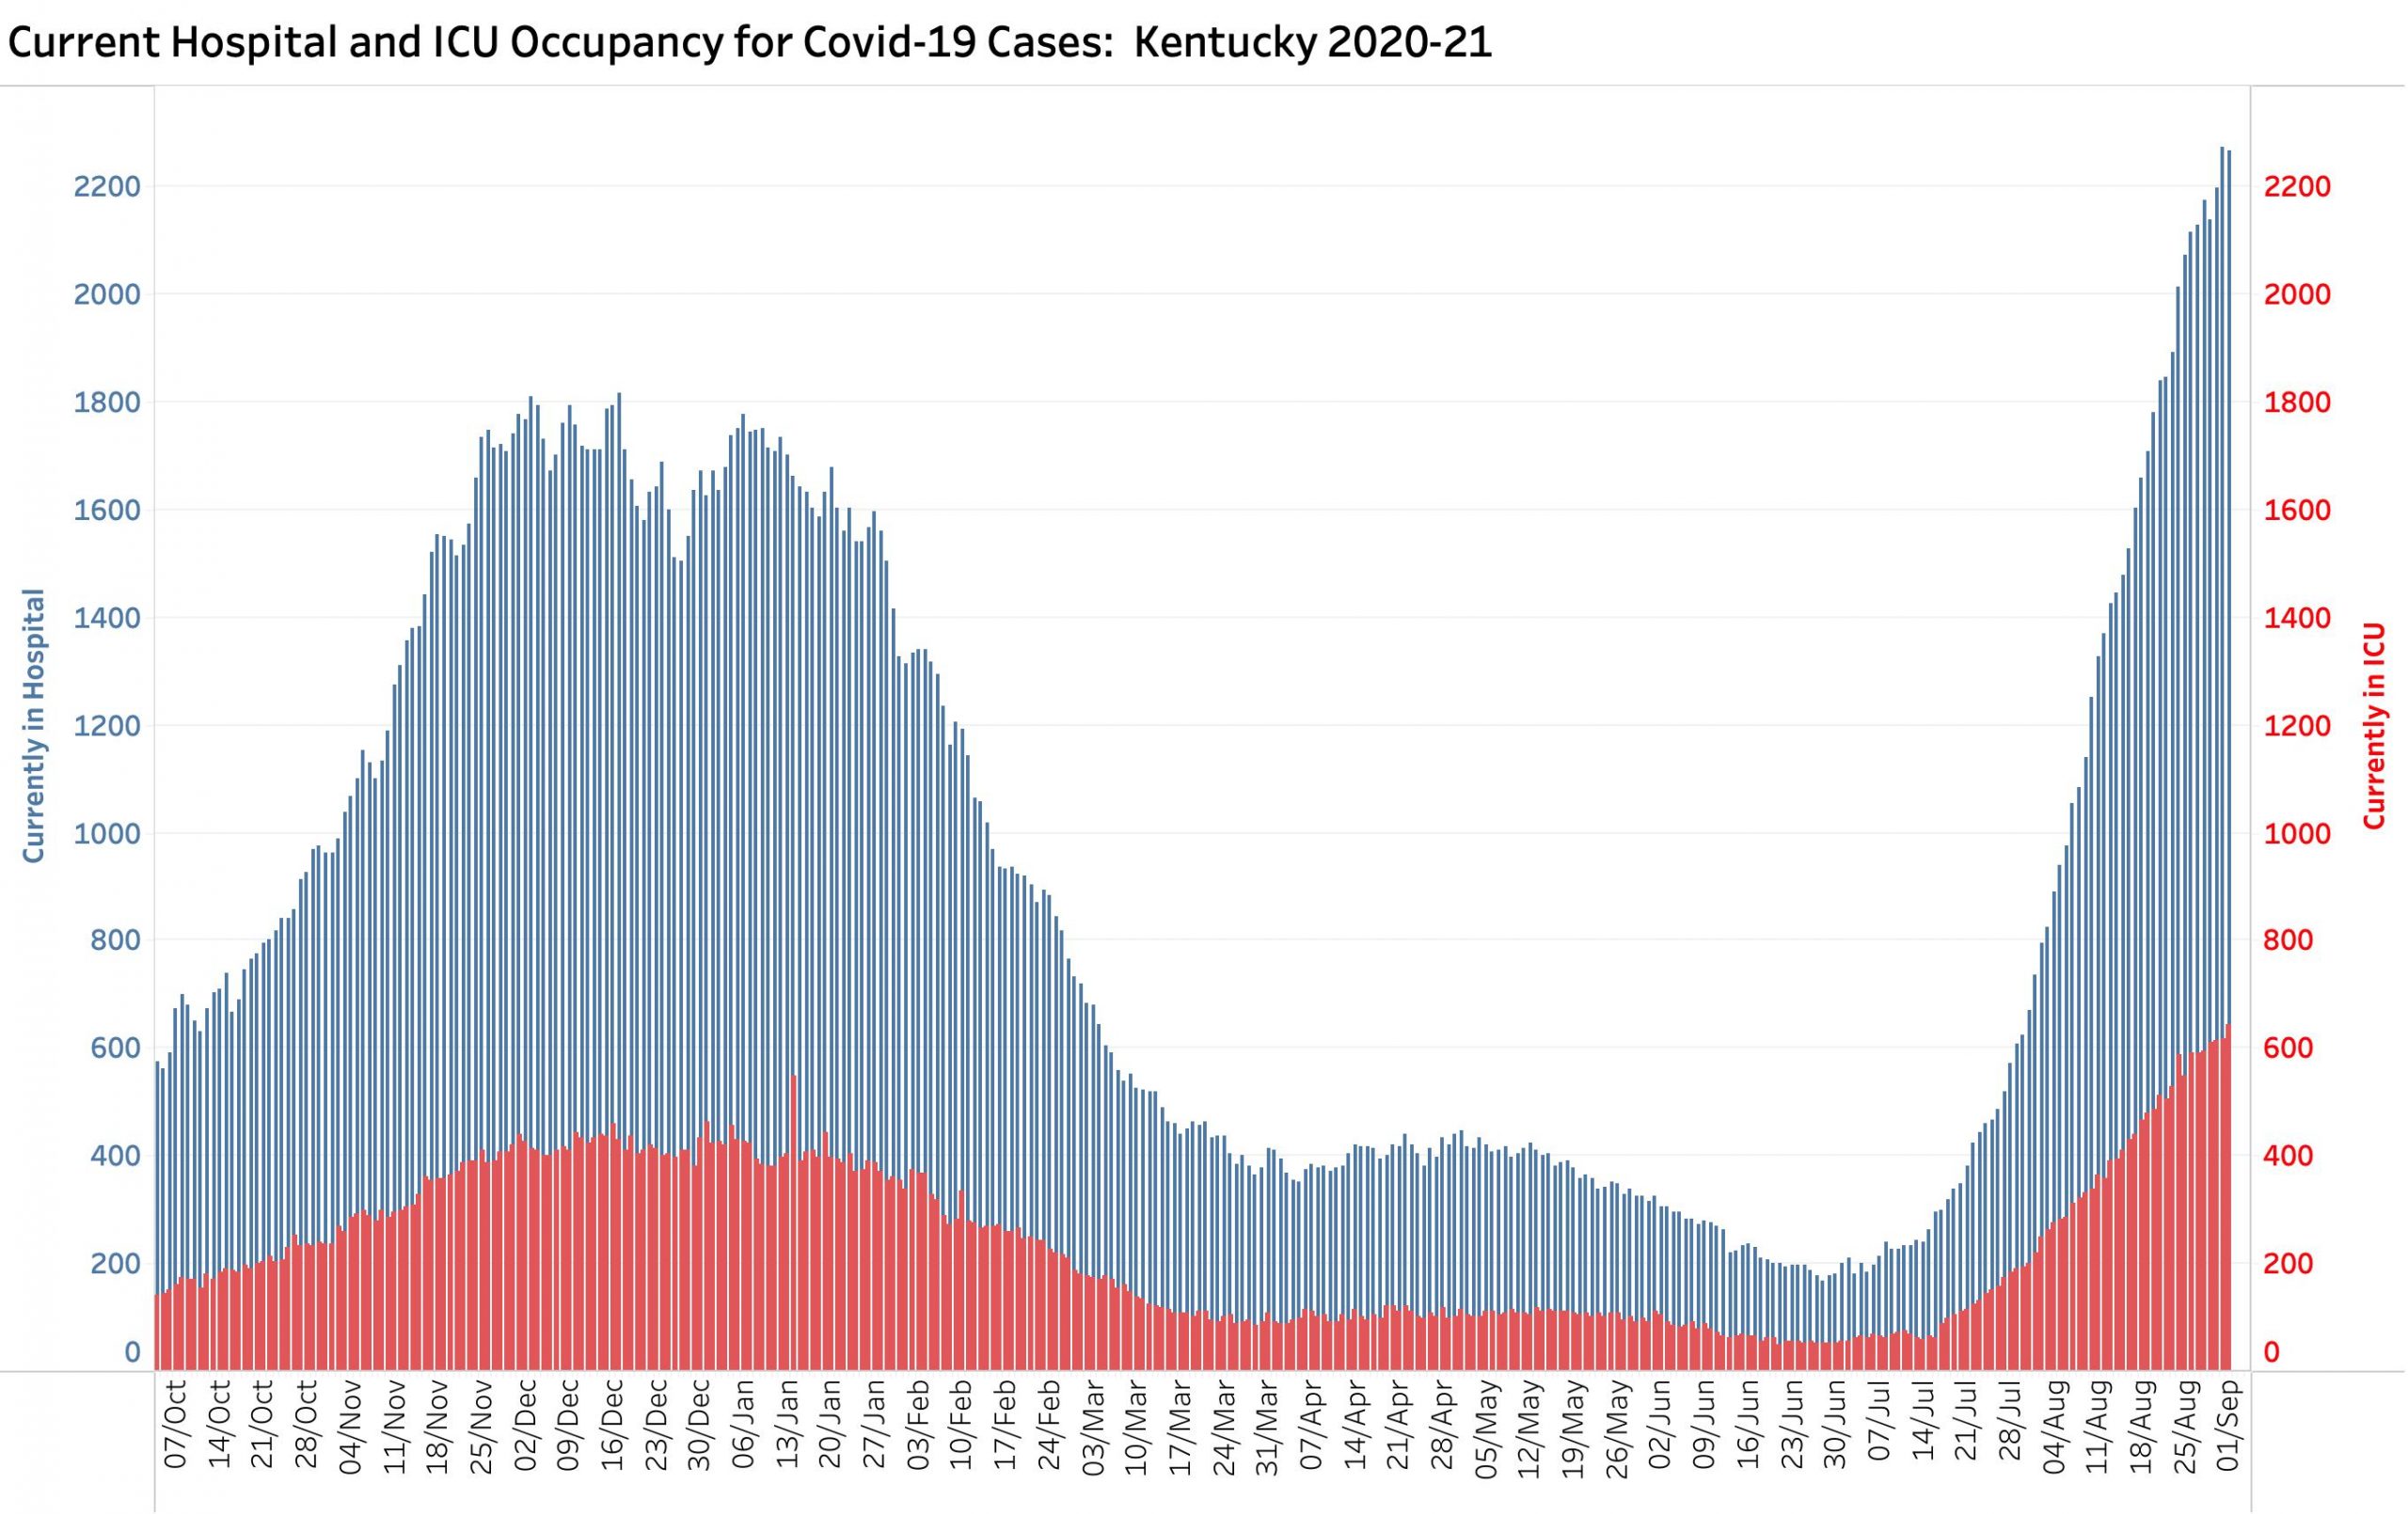
I have nothing reassuring about hospital, ICU, or ventilator utilization to write about at this time. All three of these markers of severe infection are worse than ever. Hospitals and their staffs are being crushed. Deaths are already clearly on the rise. Given the passage of time for individuals to move thorough the stages of infection, hospitalization, and ICU to death, we have not yet seen those numbers peak. It is the unvaccinated who are filling the hospitals and dying. A leveling off of the ICU or ventilator curves at high levels would be seen when there are no ICU beds or ventilators left to use!
While I am hoping that this apparent decrease in the rate of our epidemic explosion is real, I would like to see a few more days of data to be confident. Complicating matters is the upcoming Labor Day weekend with its celebratory events and holiday-related delays in public health reporting. The fall season will present us with predictable venues for the spread of infection including schools, colleges, concerts, and sporting events which bring the vaccinated and unvaccinated alike together for education and entertainment. It could be the Fourth of July all over again! These are wild cards that upend the usual making of odds. It would be nice to win a few hands for a change. It would also be nice to feel like someone or some entity was still looking out for our benefit! Kentucky’s legislature has taken charge of day-to-day public health management and that makes me feel very much unsafe.
Peter Hasselbacher, MD
Kentucky Health Policy Institute
Emeritus Professor of Medicine, UofL
1 September 2021
Today’s report (Thursday Sept. 2) had higher than hoped for new cases and deaths– 5457 and 45 respectively. Hospital numbers still rising. I updated the portfolio on Tableau Public. The conclusions in the above article remain in play. I hope I did not put a jinx on us with my partially unbridled optimism that we might be turning a corner! The numbers at the end of next week will help define where we are going.
Peter