
If nothing changes could hit 5000 new cases per day by the end of December based on trend since October 1.
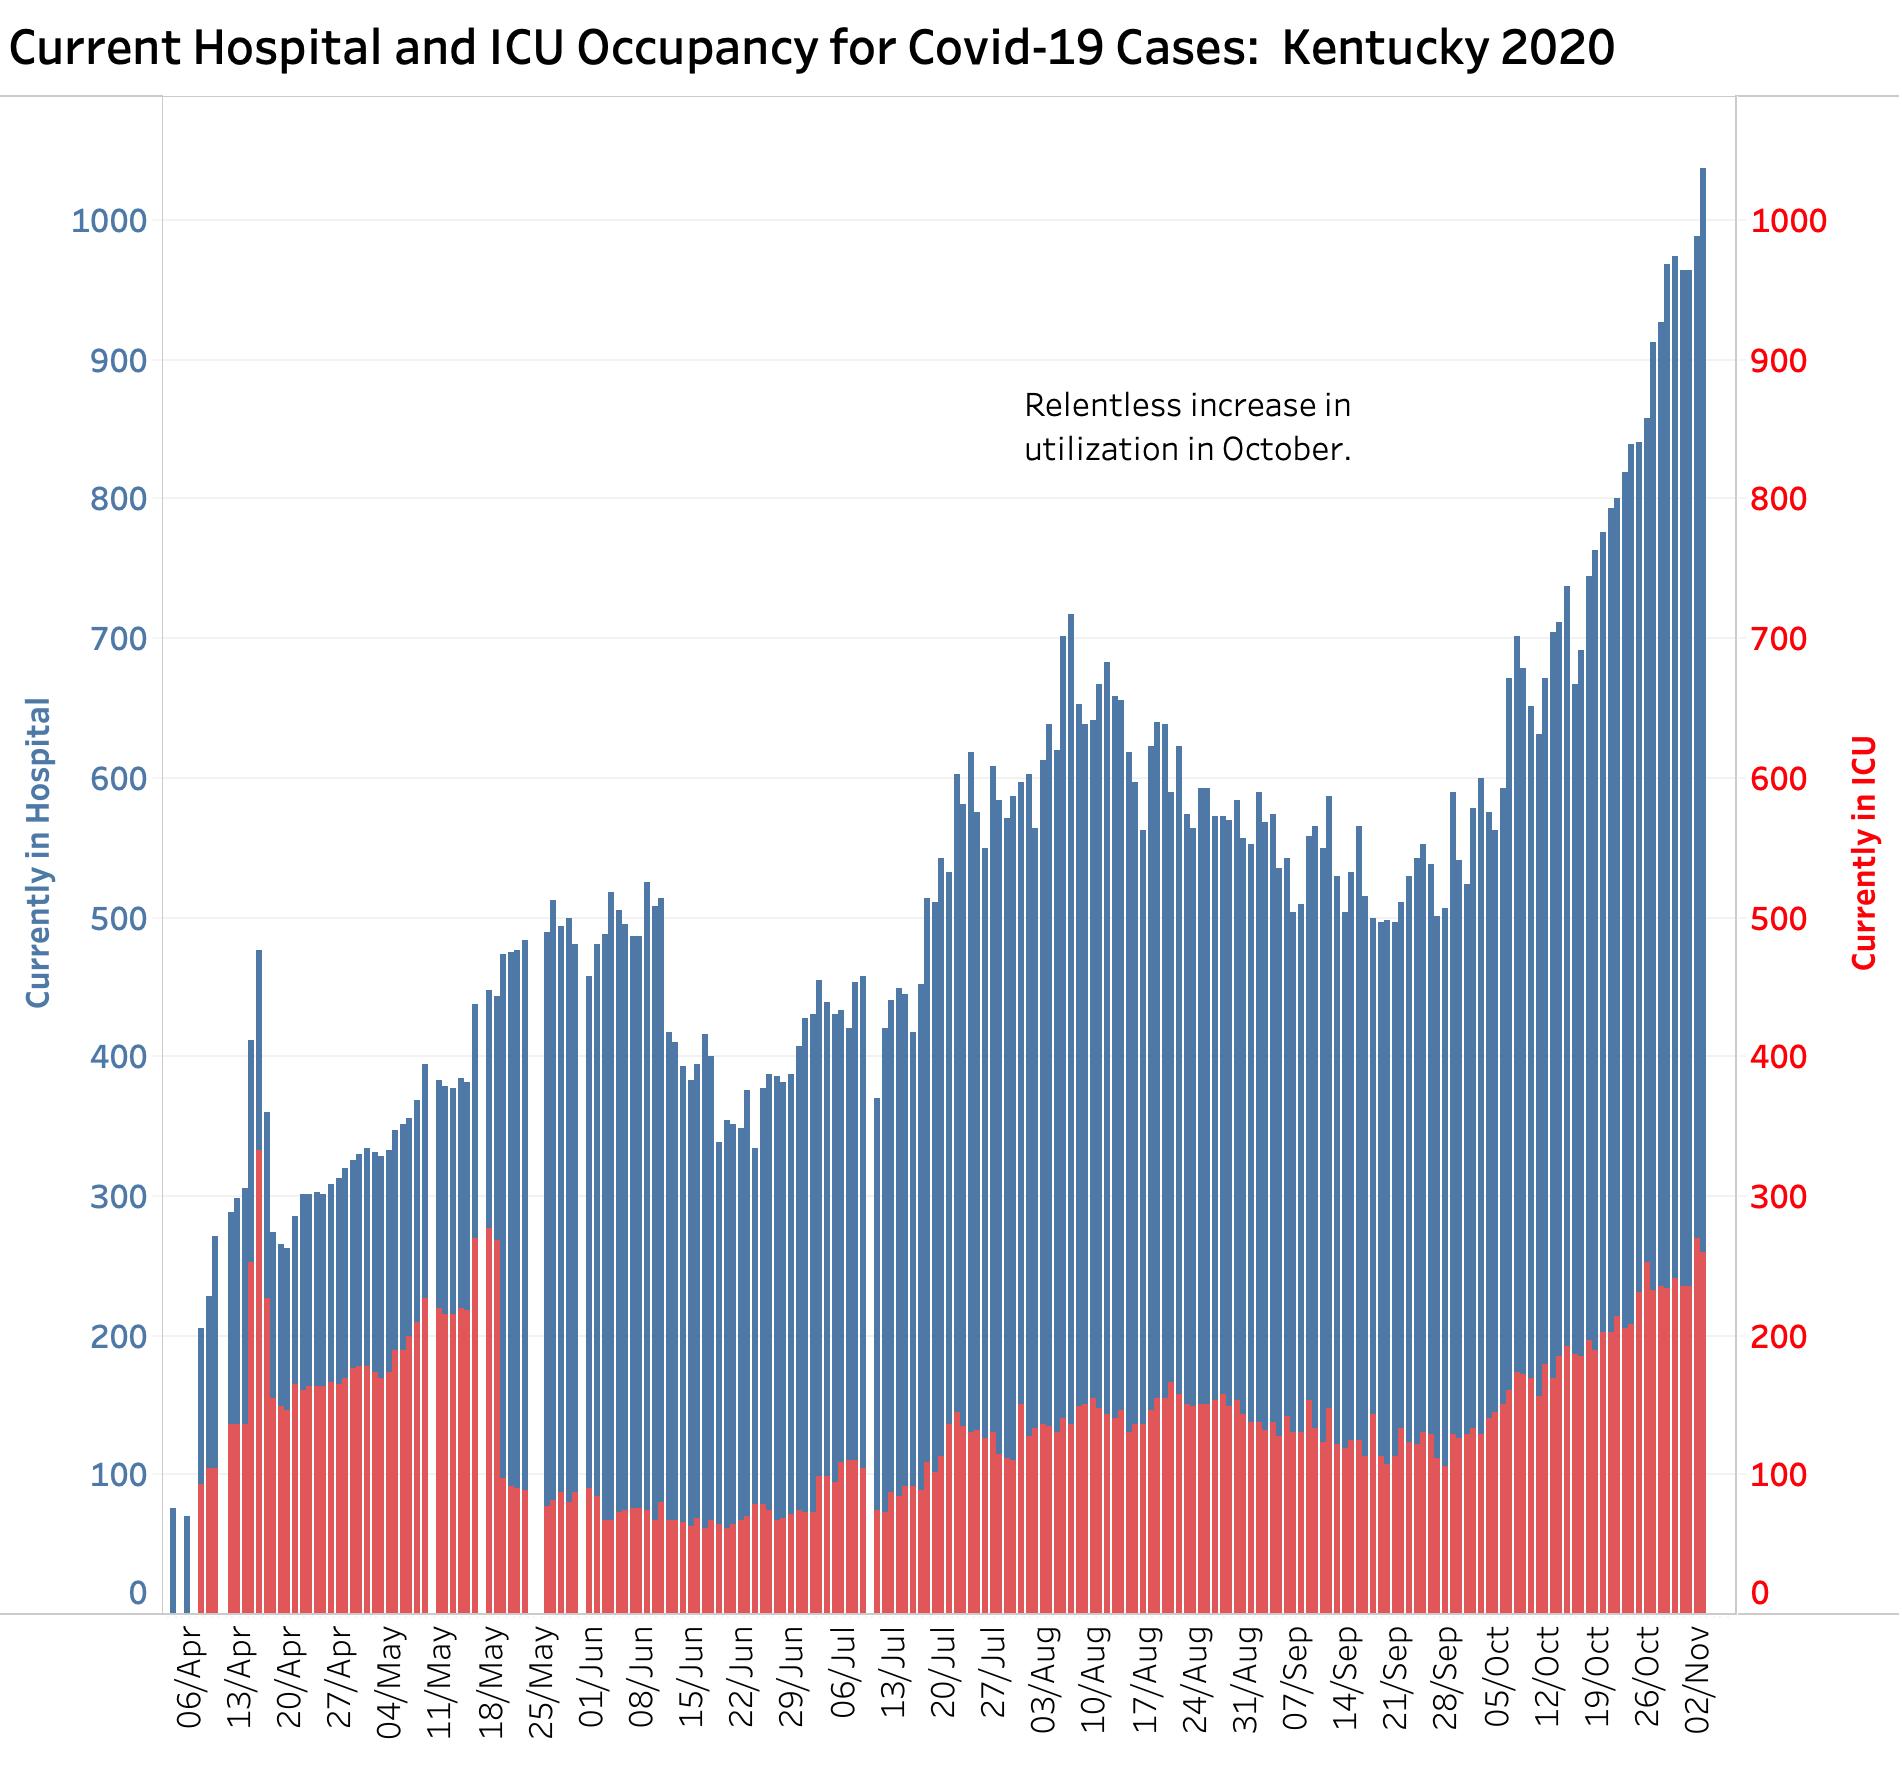
It may not make too much sense to update the Kentucky Covid-19 epidemic in midweek because it takes the remainder of the week for statewide reporting to catch up from the slow or absent reporting of Sundays and Mondays. I make an exception today even before Wednesday’s reporting because things have been so bad here, nationwide, and in most other countries that have the infrastructure necessary to count cases at all. I am also moved by considerations that our hospital and their preexisting ICU beds are now truly threatened by sequential record-breaking days since reliable accounting began in May.
Brief Review with Charts:
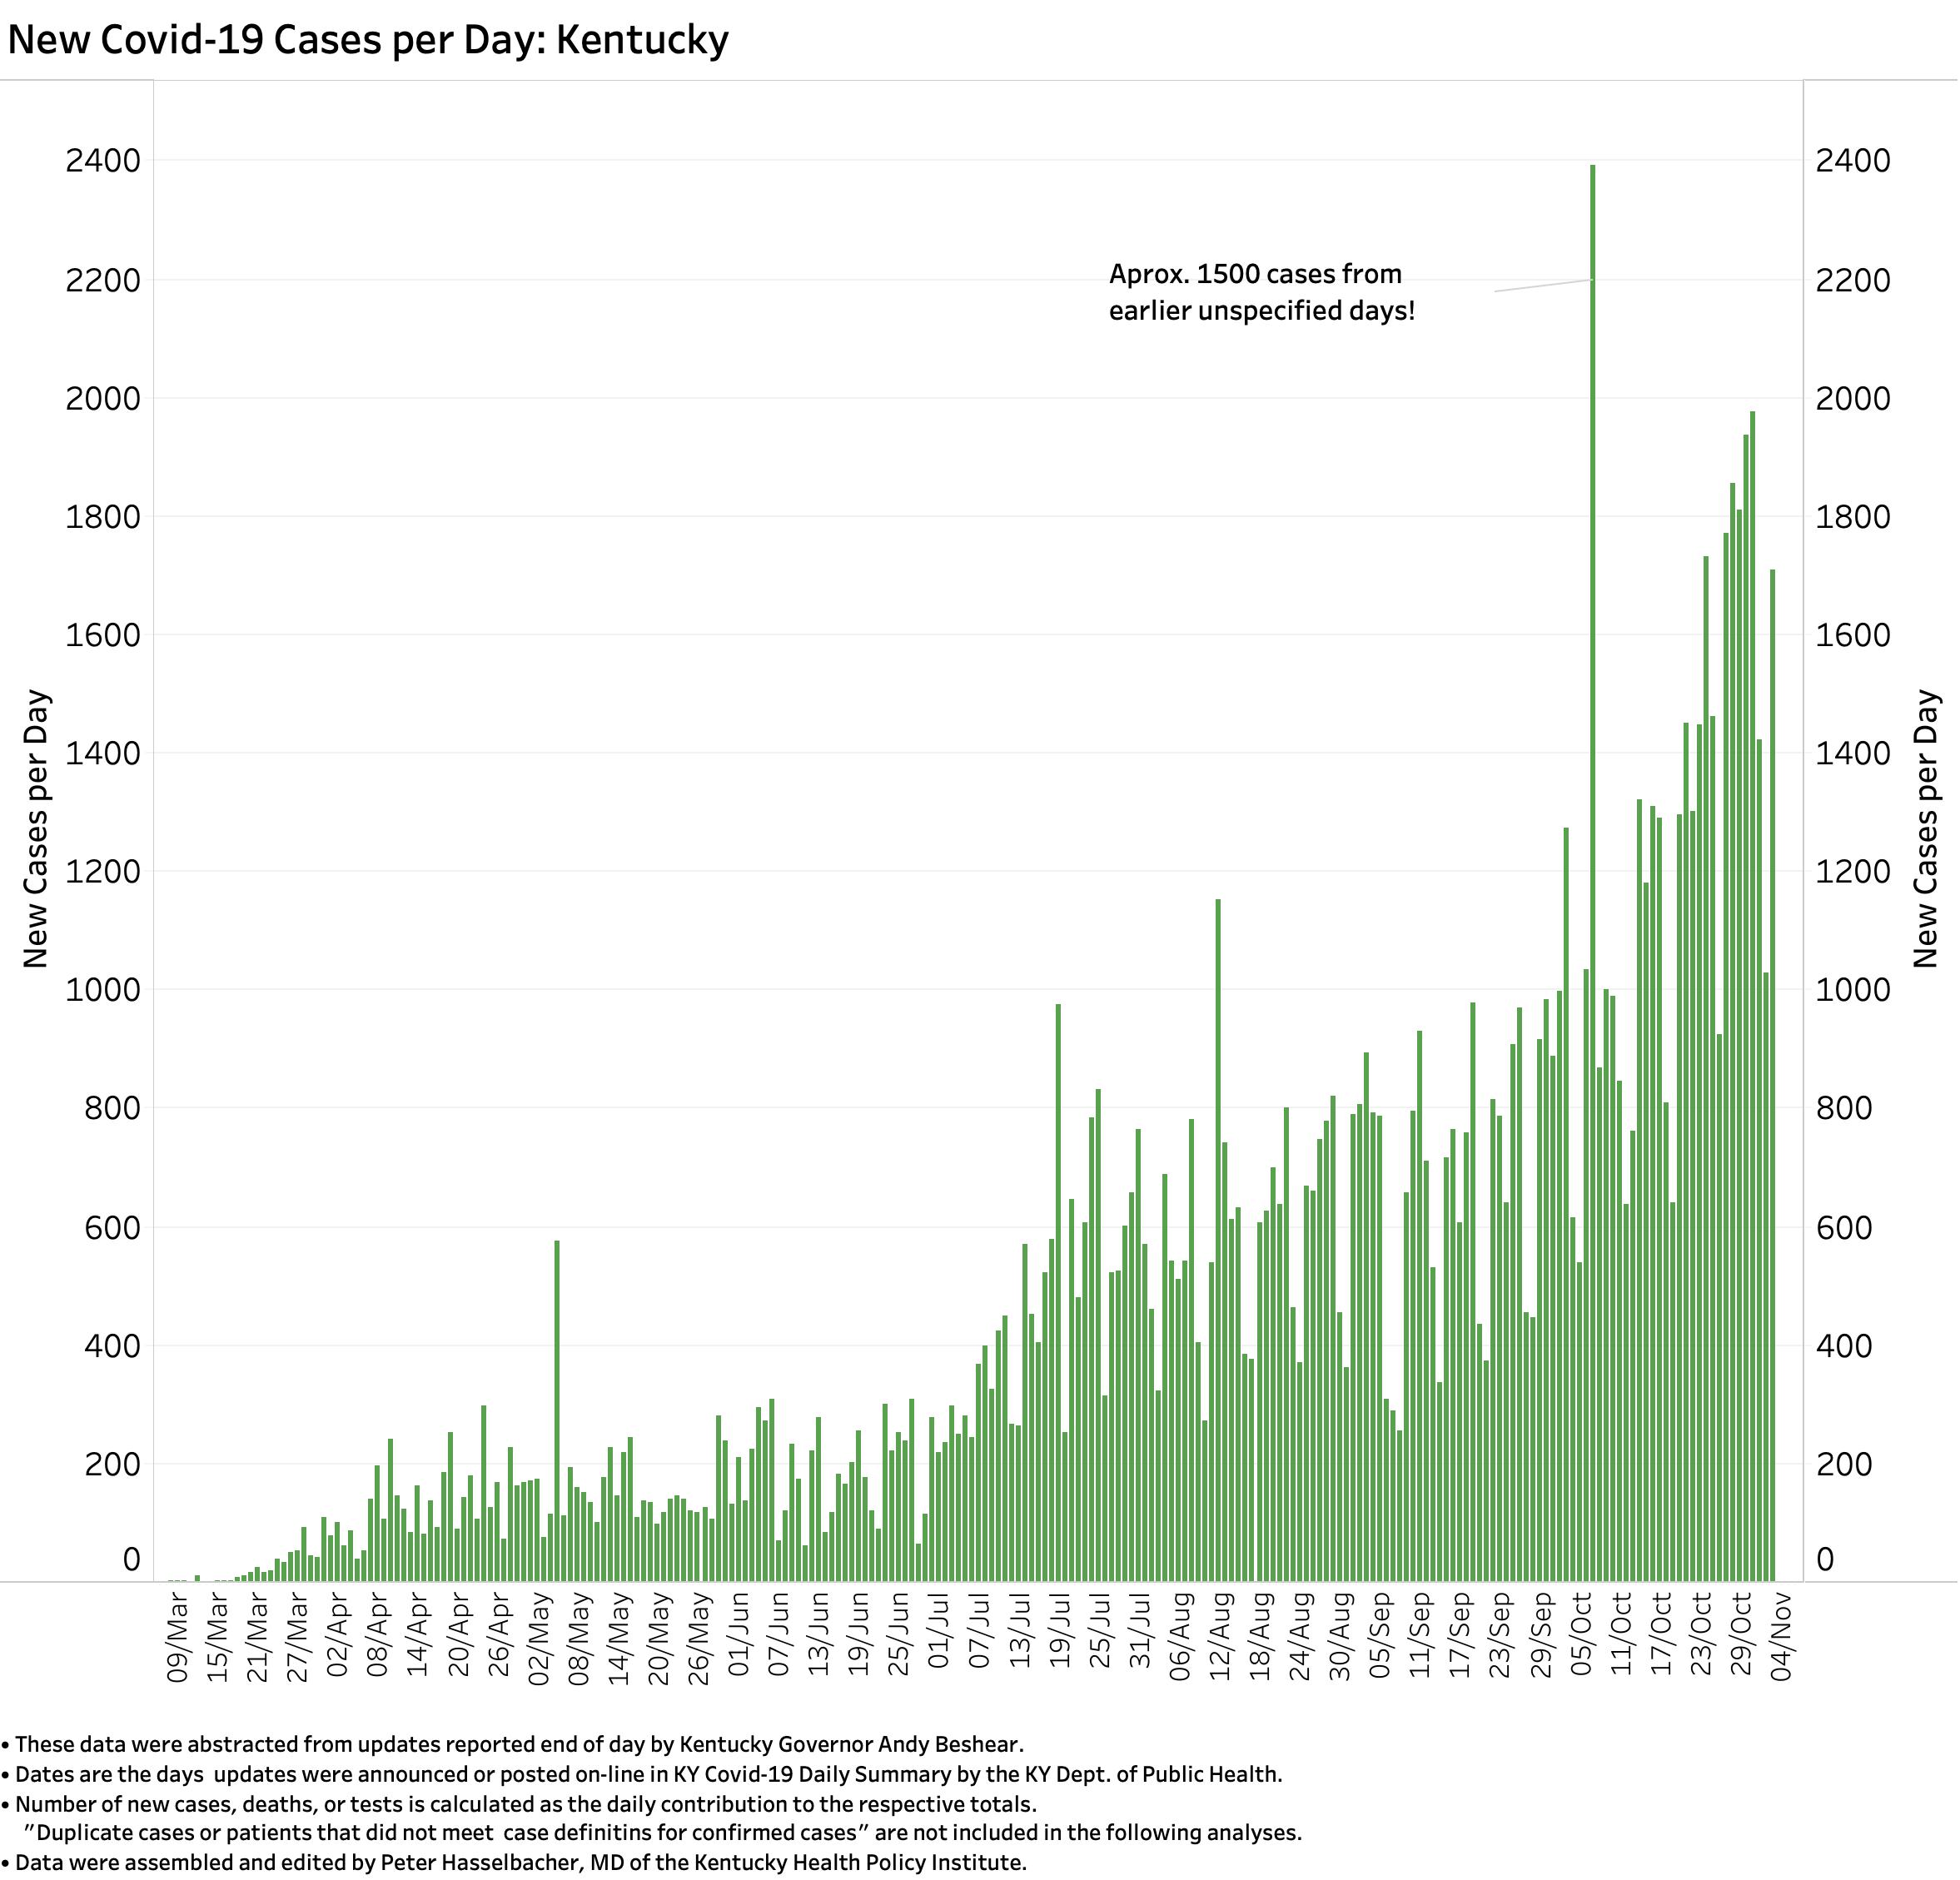
Below is my customary histogram of new cases showing the dramatic peaks and troughs of daily counts, with nadirs on Sundays that render anything other than 7- or 14-day rolling averages unsatisfactory to predict very far into the future.
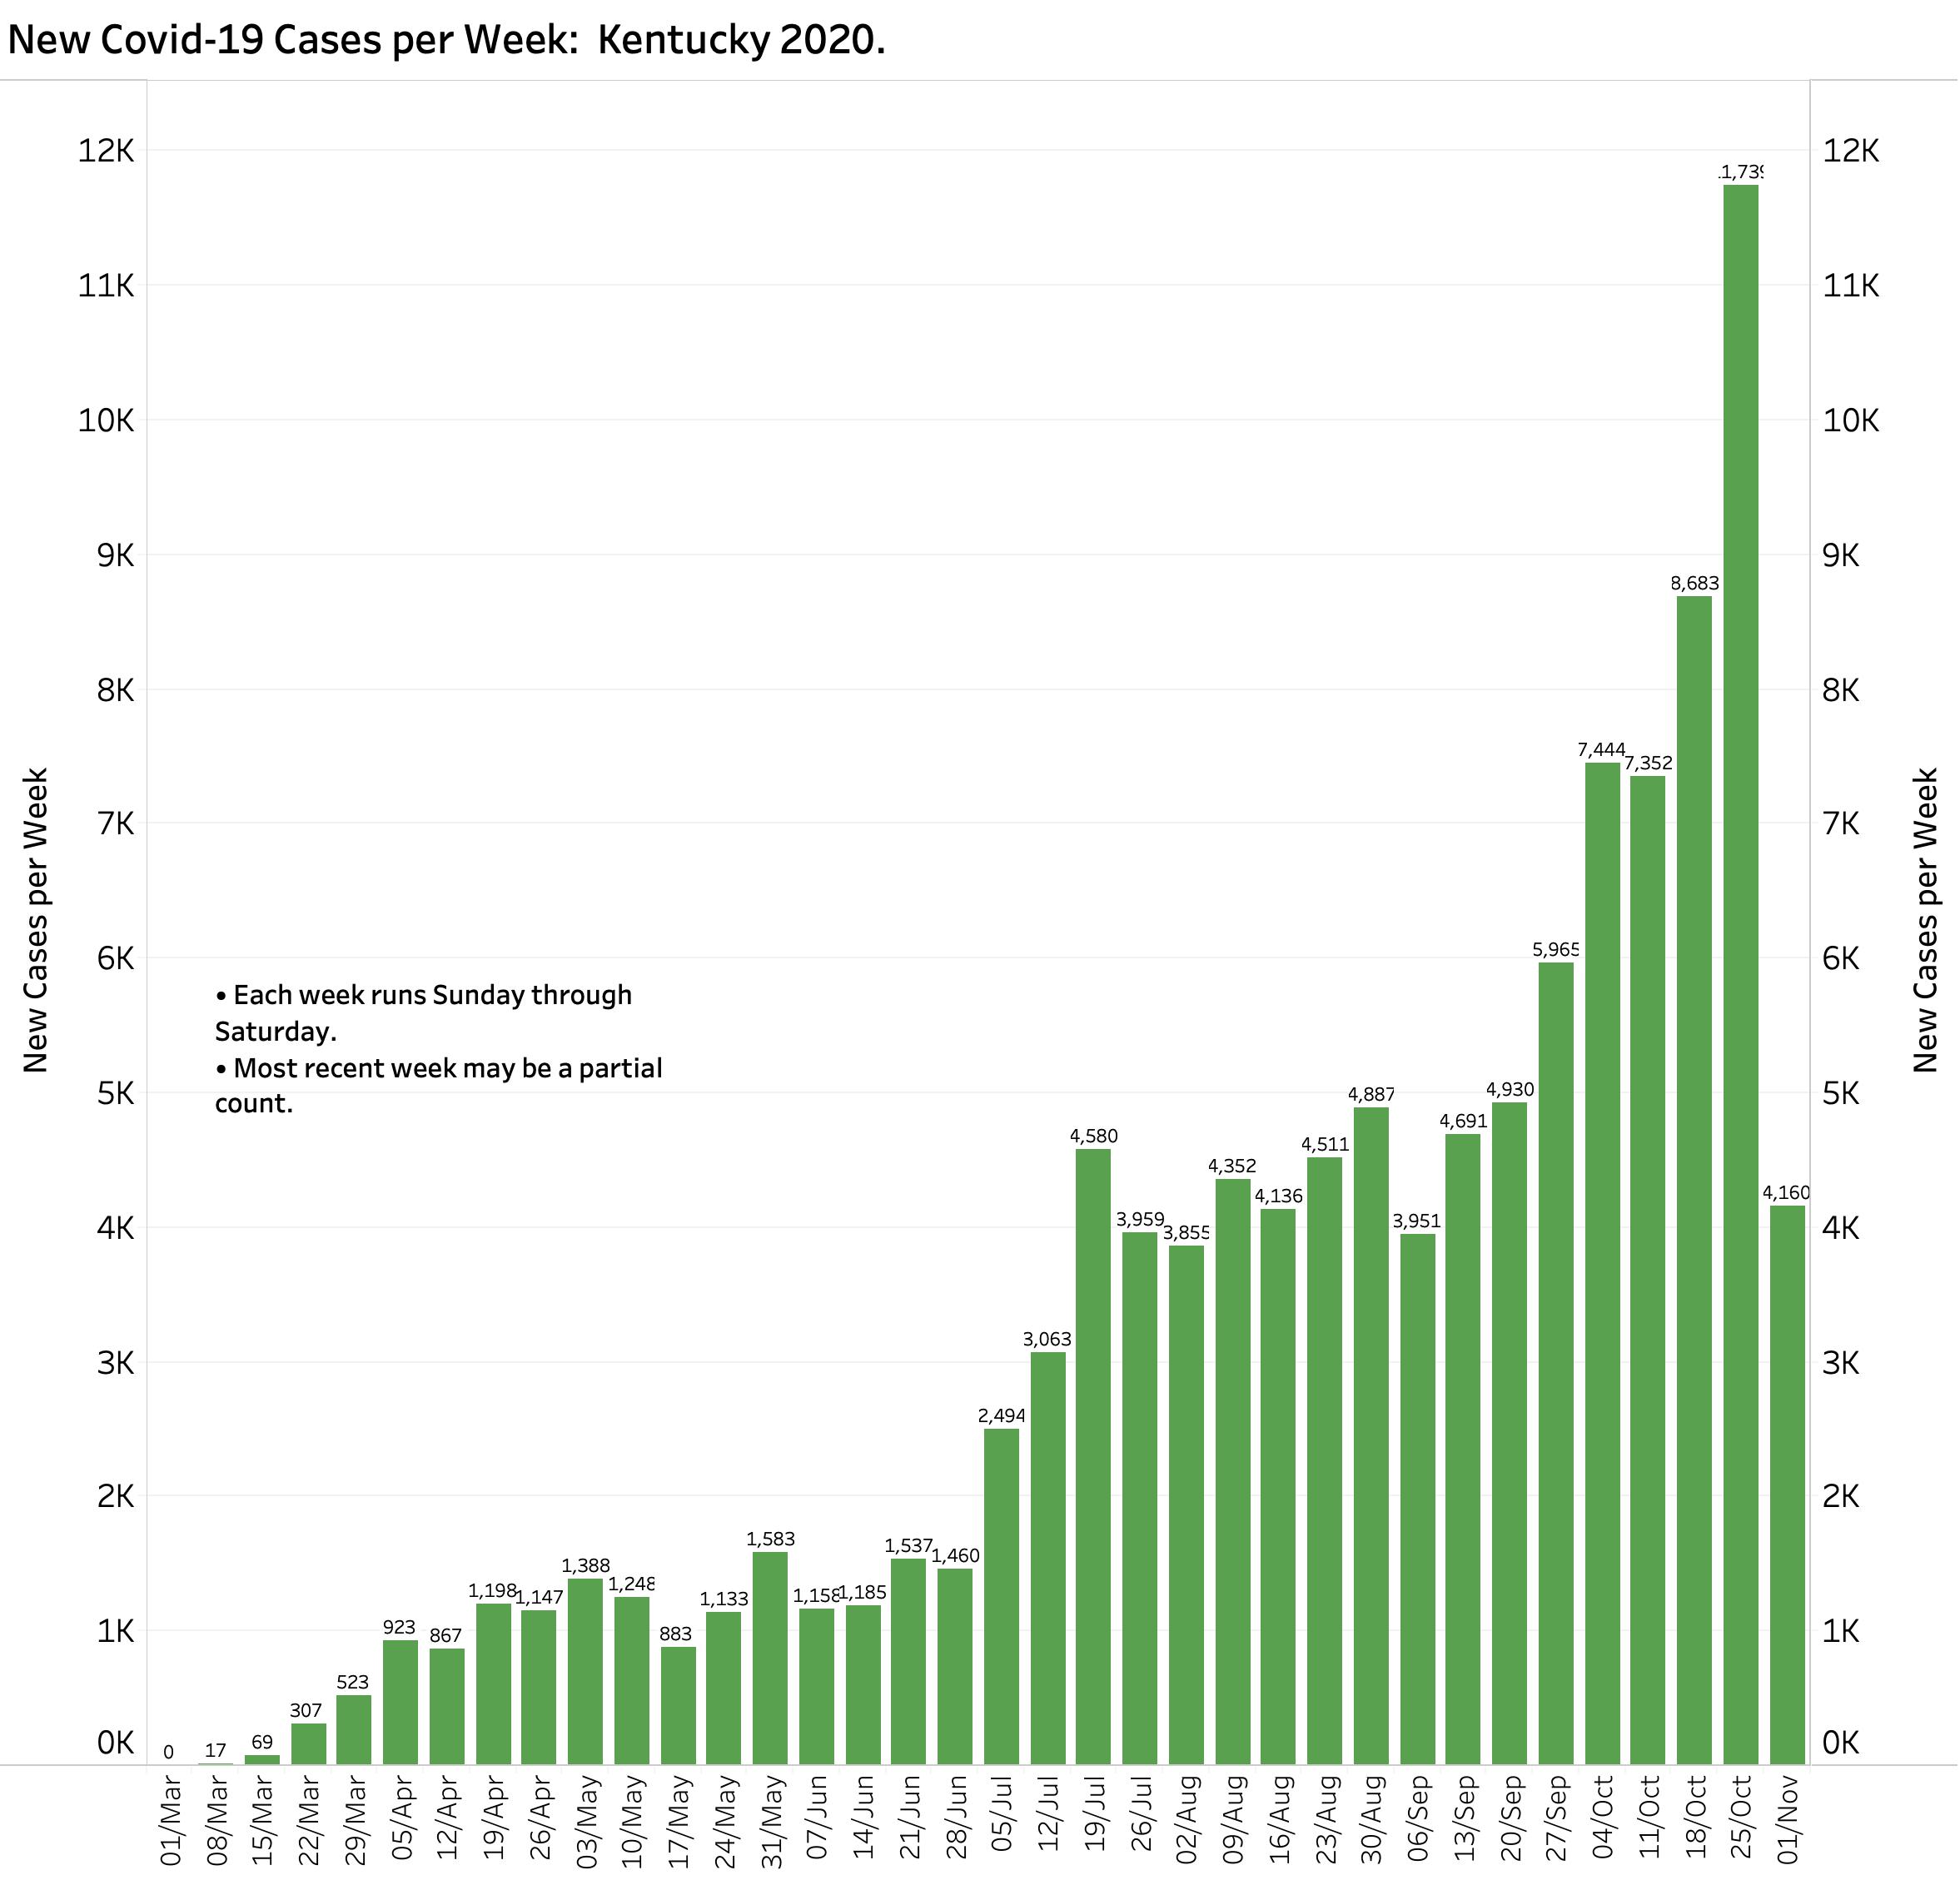
A weekly consolidation of cases proves the sharp and sustained explosion (dare I use that word?) of cases since the end of the summer. We have 4 days worth of counts left to add to the most recent week! (Tableau’s internal calendar starts every new week on a Sunday by default, and therefore so do I.)
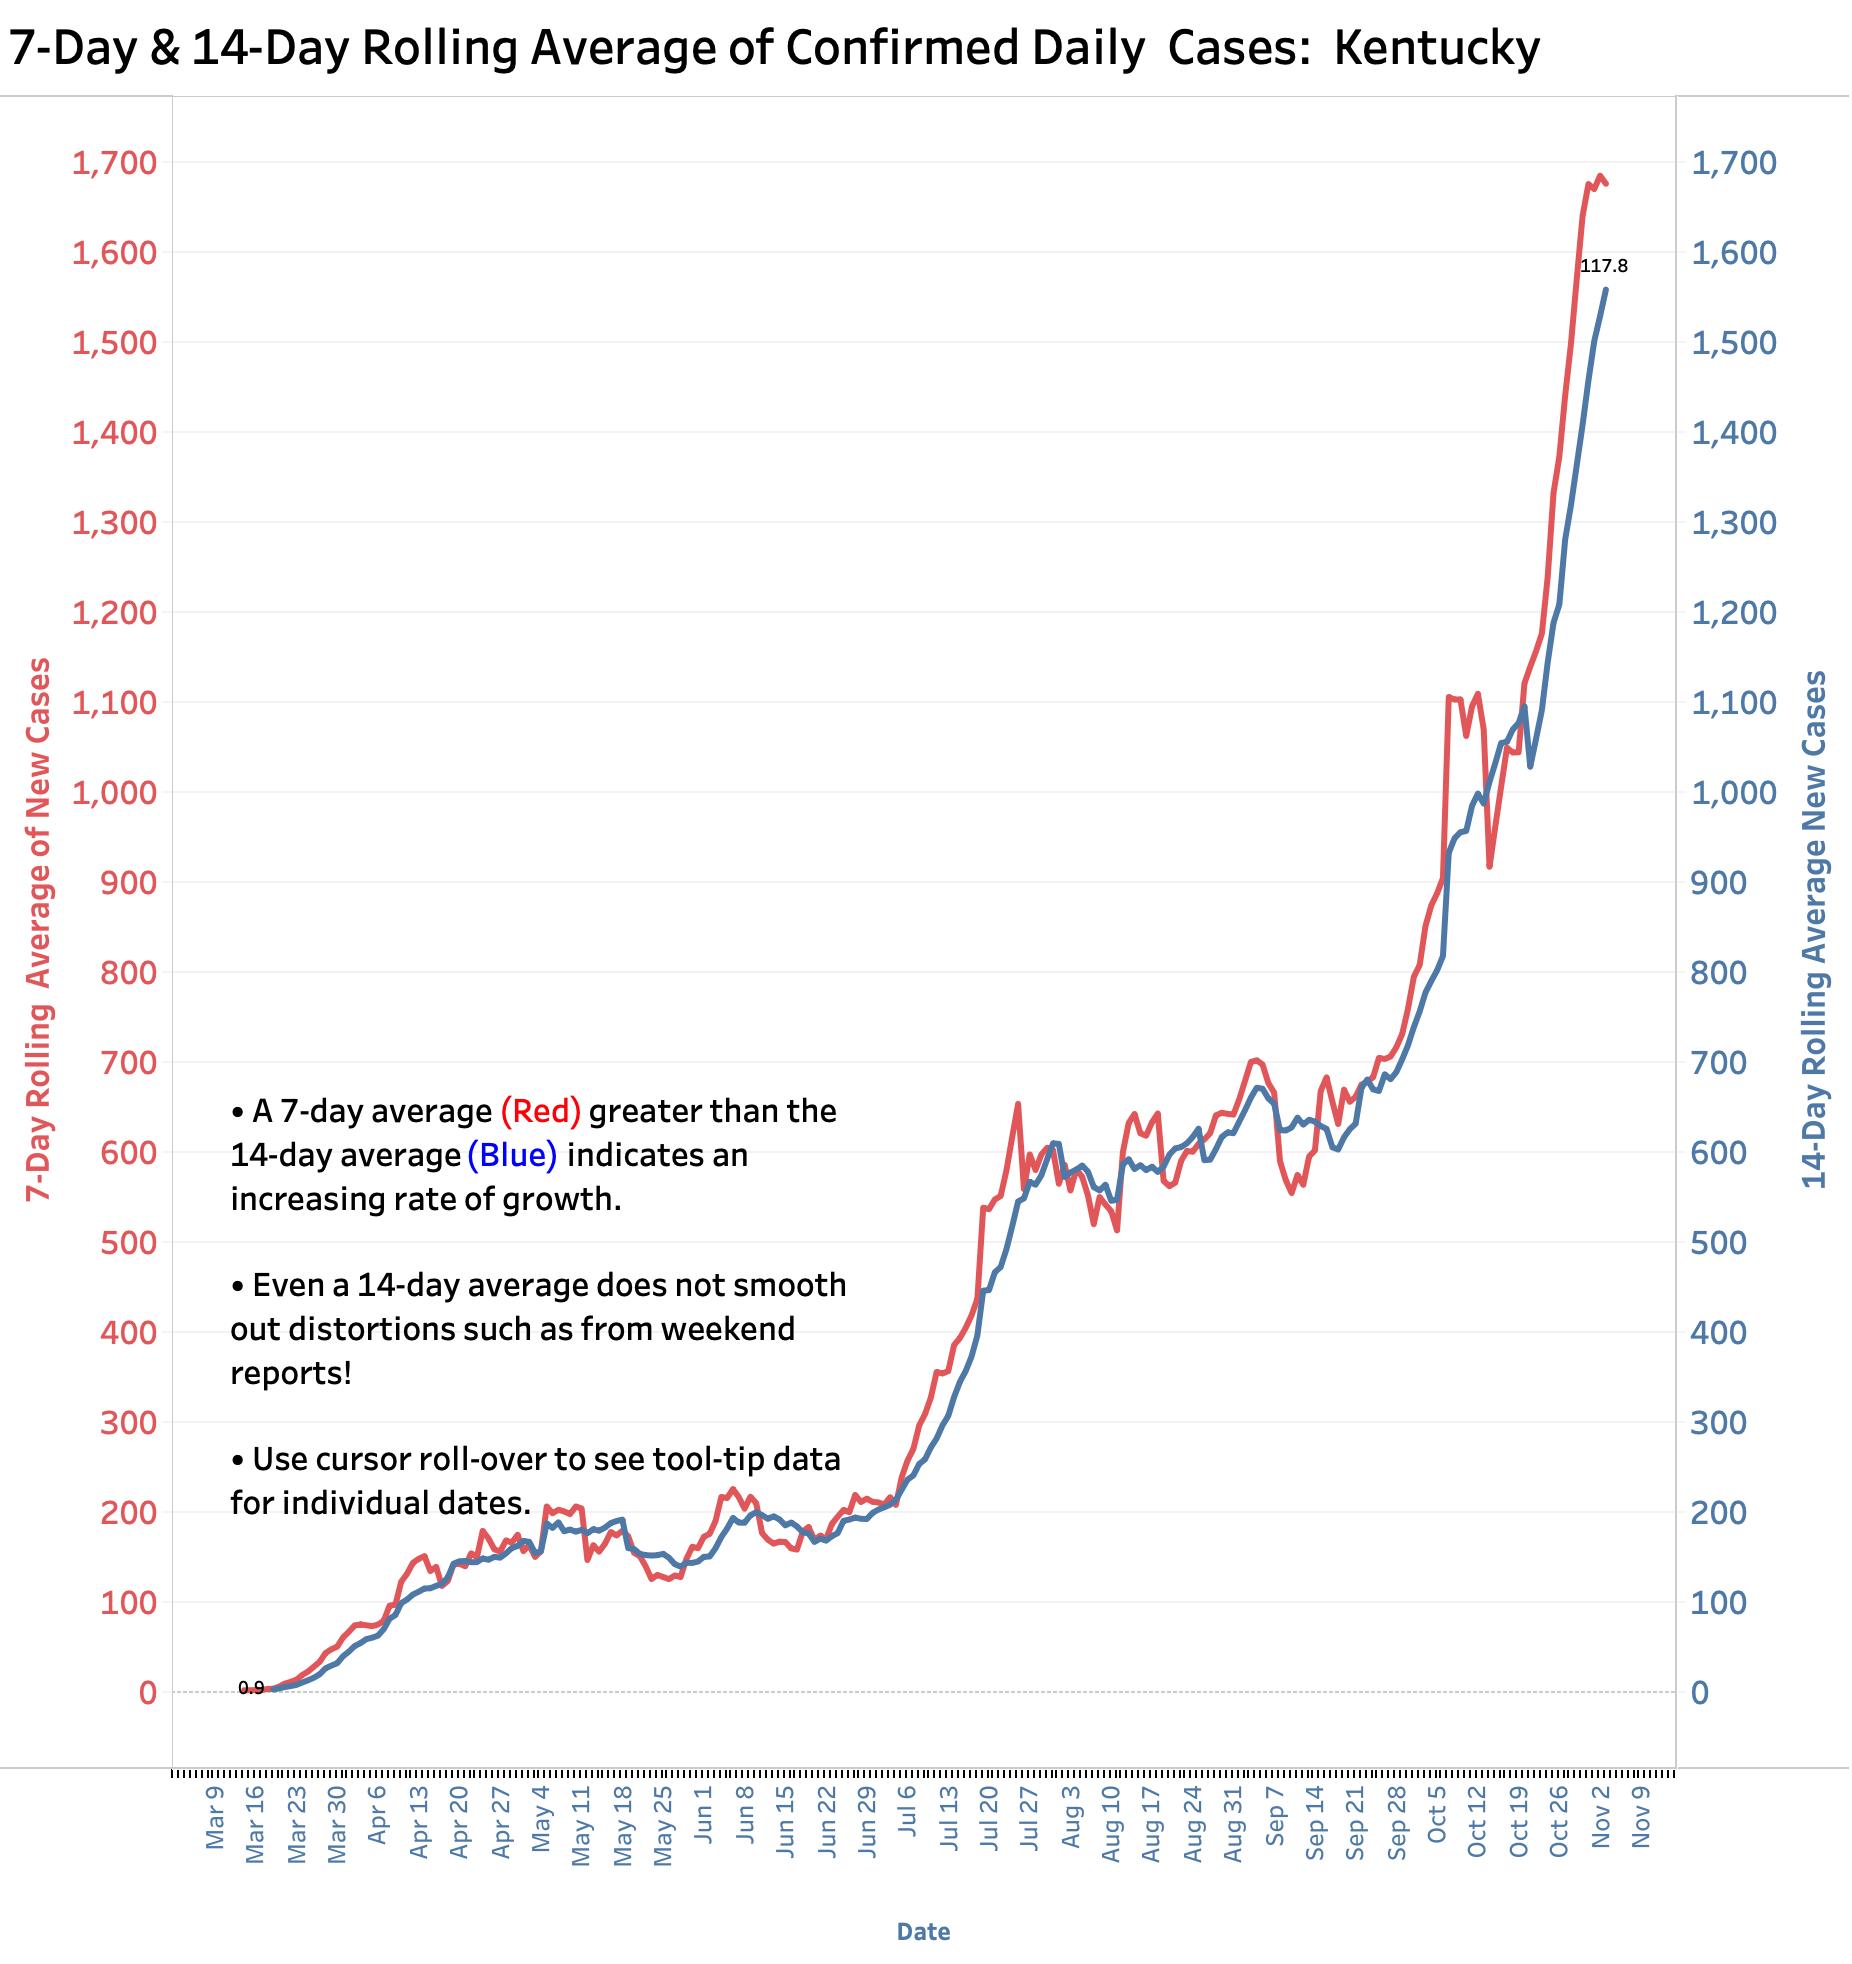
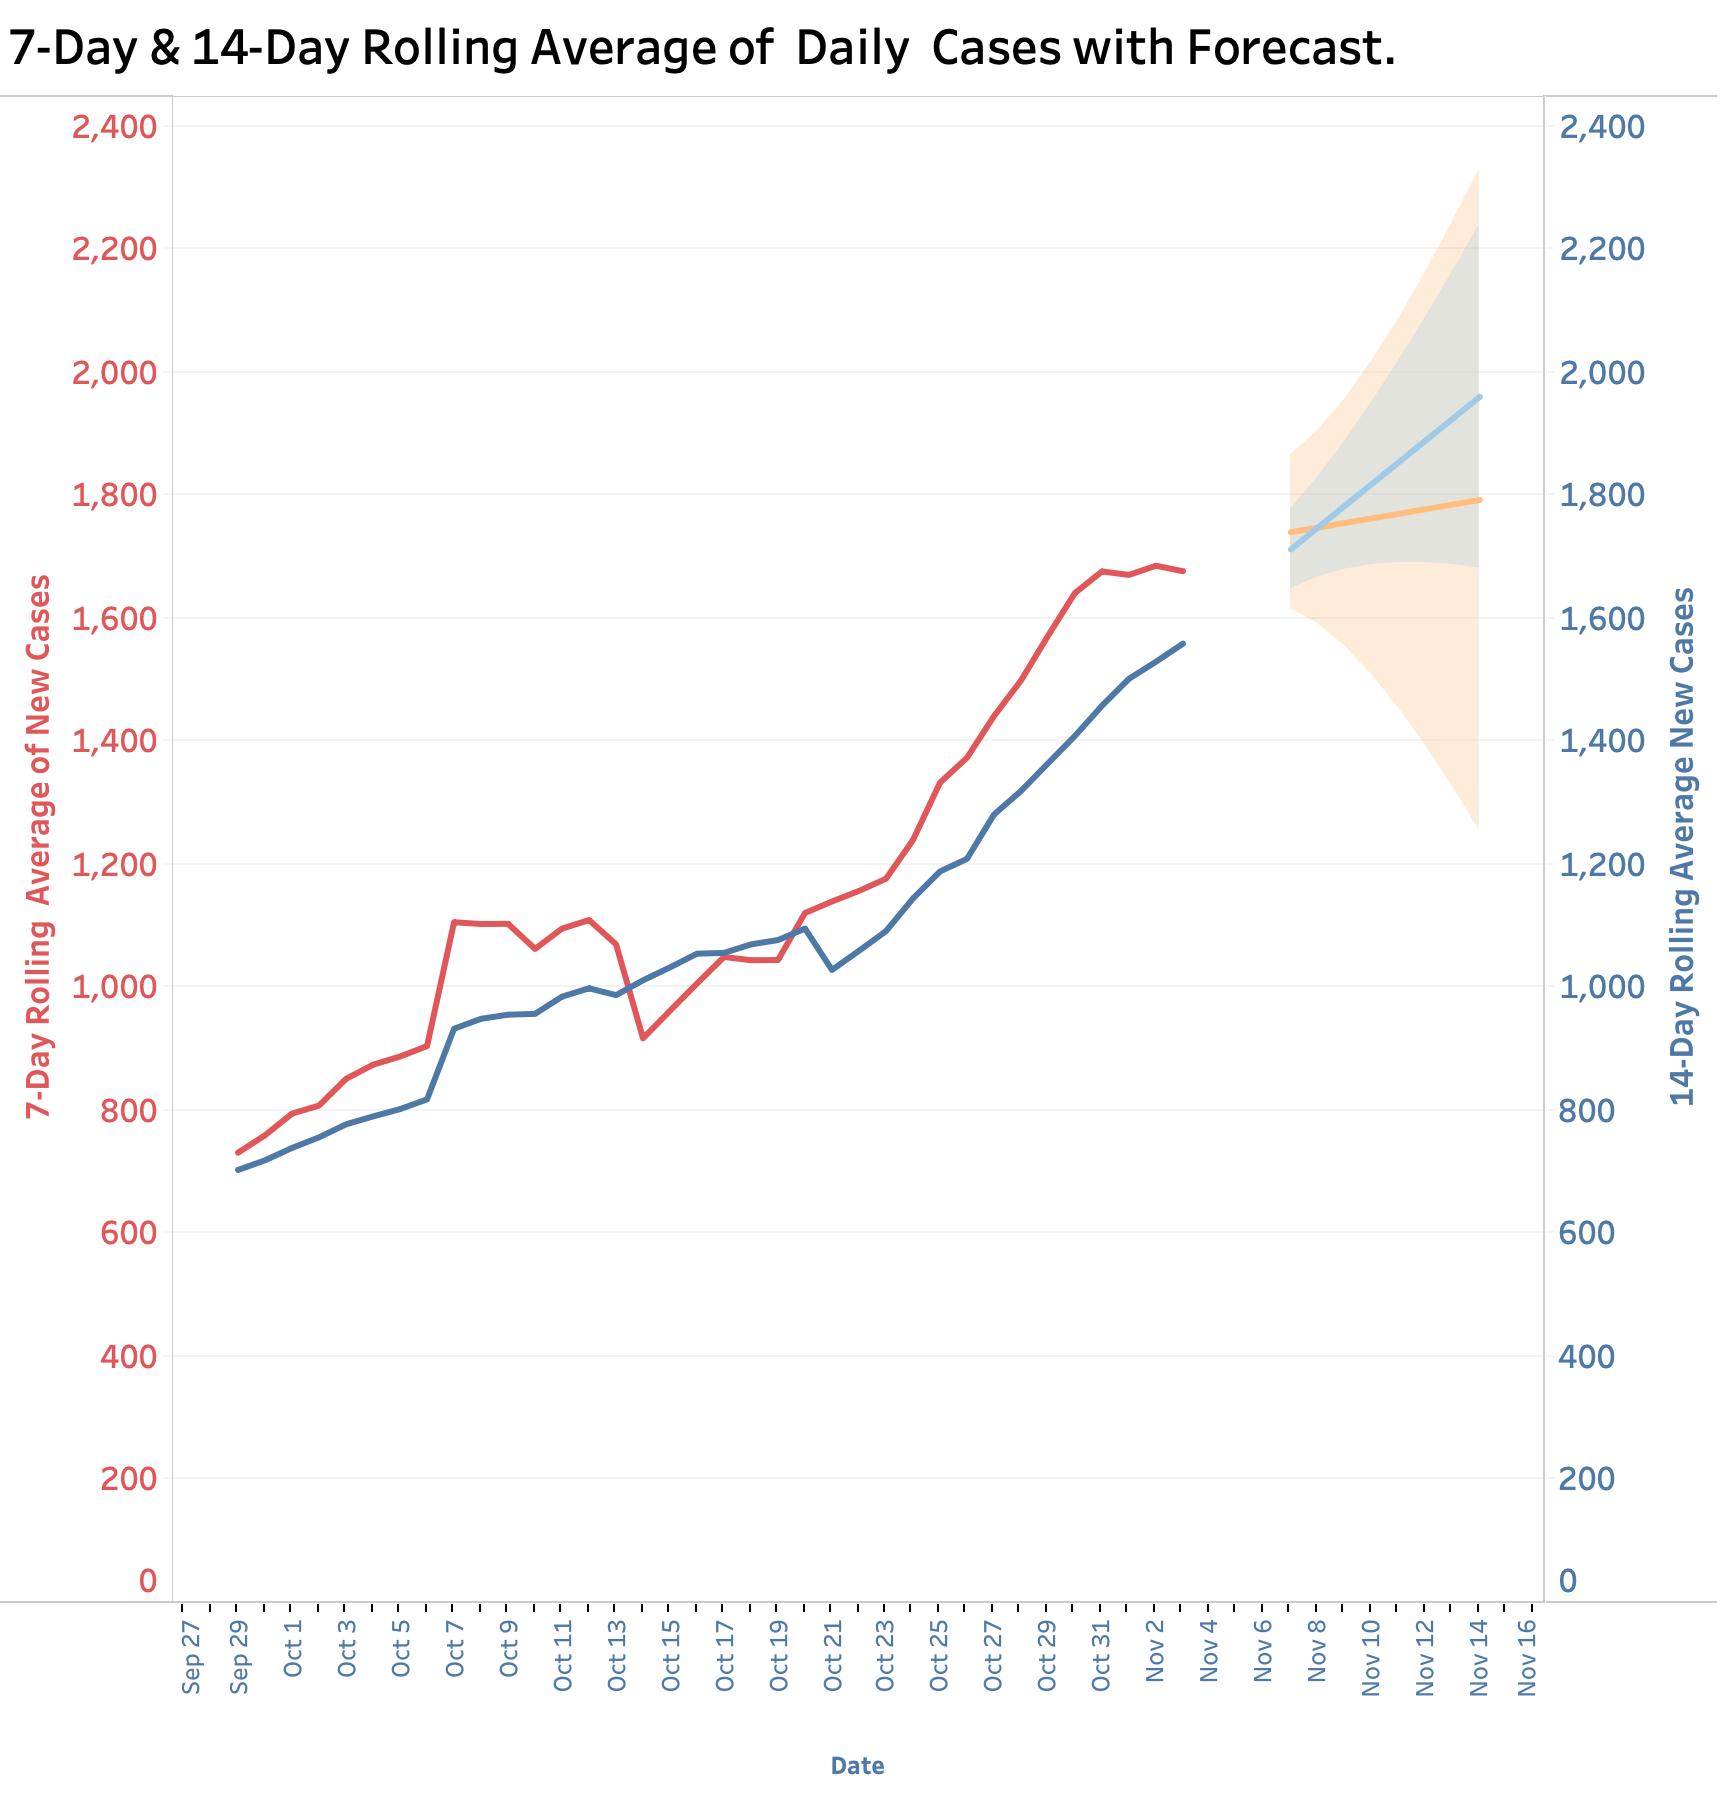
I asked my statistics package (Tableau) to plot a forecast on what will happen to new cases in the near future based on numbers since October 1. I do not know how the software calculates these forecasts or their confidence levels, but I want to emphasize the point that even a 7-Day rolling average has a much wider range of unconvincing predictability than the 14-Day one. Even at that, the 14-Day average puts us at an average of 2000 cases per day or higher by the end of the week.
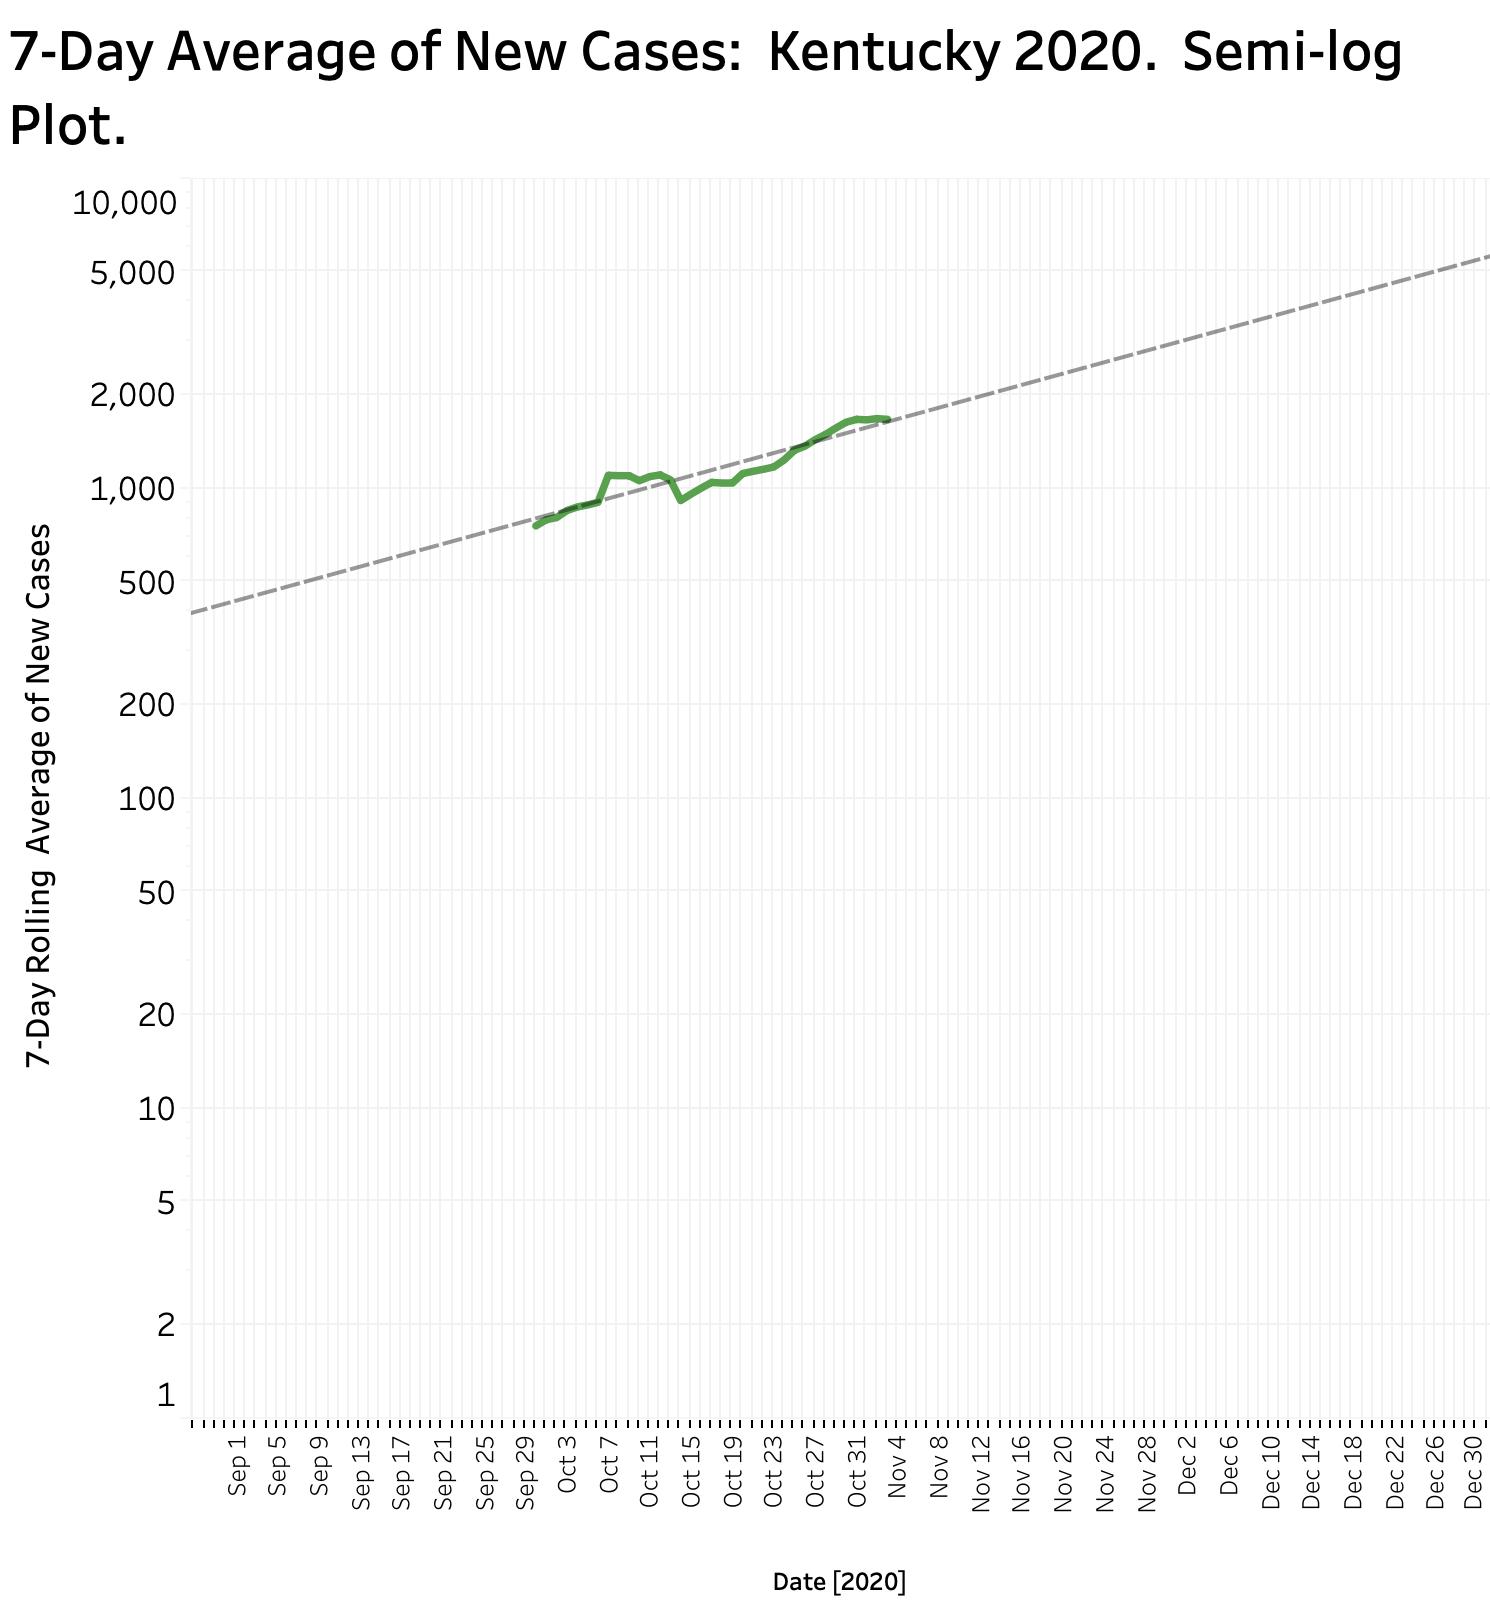
I have been using another way to estimate the rate of growth of Kentucky’s epidemic that I think I understand better. The following figure plots the 7-Day rolling average of new cases on a semi-logarithmic axis that allows both small and large numbers to be placed in the same view. An added feature is that an exponential trend line (as opposed to a linear one) is a straight line allowing a rate of exponential growth to be calculated or determined by inspection. In this case, if nothing else happens, and based changes on the daily numbers from October 1 to November 3, the average number of new cases can easily hit 2000 by the end of this week, and even reach 5000 per day by the end of December. Those numbers are based only on historical collected data but should make us sit up and take notice. I suggest that it is healthy to be somewhat apprehensive right now. (If I really wanted to scare my readers, I would illegitimately project the trend line further to suggest that at the present rate of growth, we would hit 500,000 new cases daily by the end of next July! Such is the power of compound interest. Of course, our hospitals would have been closing long before those dates and such an end-of the-world prediction would be irresponsible– right?)
I will close this article off shorter than usual. I will update the Tableau Public portfolio of on-line data visualizations after this evening’s report without further commentary. In the week ahead, I will trim down the number of individual visualizations in that file to focus on what I believe are the most useful. What should I keep, and what should I omit? For that matter, what new would you like to see?
Peter Hasselbacher, MD
Emeritus Professor of Medicine, UofL
3 November 2020
End-of-week Comment:
The KHPI week ending Saturday, November 7 continued to record a new weekly record of 12,442. Deaths are at the third highest for any week, fewer only than the previous two weeks. Hospital bed and ICU utilization at new high levels all week. Hospitals repurposing other rooms and beds into ICU ones. Projection to 5000 new cases per day by the end of December still in the potential cards.
The state made a reporting error of Aggregate Total Tests on Friday, Nov 6. A specific corrected number for that day is not available to me. Plotting the erroneous data point creates an artifactual spike and negative number for the number of new tests performed over a two-day period. To avoid this, I extrapolated the count for Nov. 6 halfway between the counts of Thursday and Saturday. Consider it a three-day average!
The updated panel of data visualizations is available on Tableau Public.
https://public.tableau.com/profile/peter.hasselbacher#!/vizhome/Covid-19TrackinginKY/Overview
Peter Hasselbacher, MD