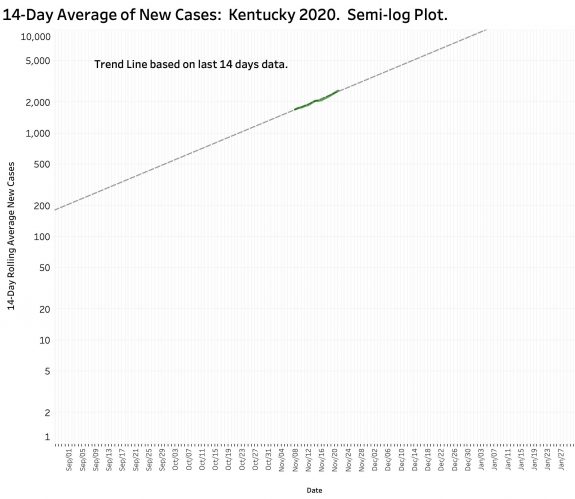
On track to 5000 new cases per day by December 13. It’s even worse across the nation!
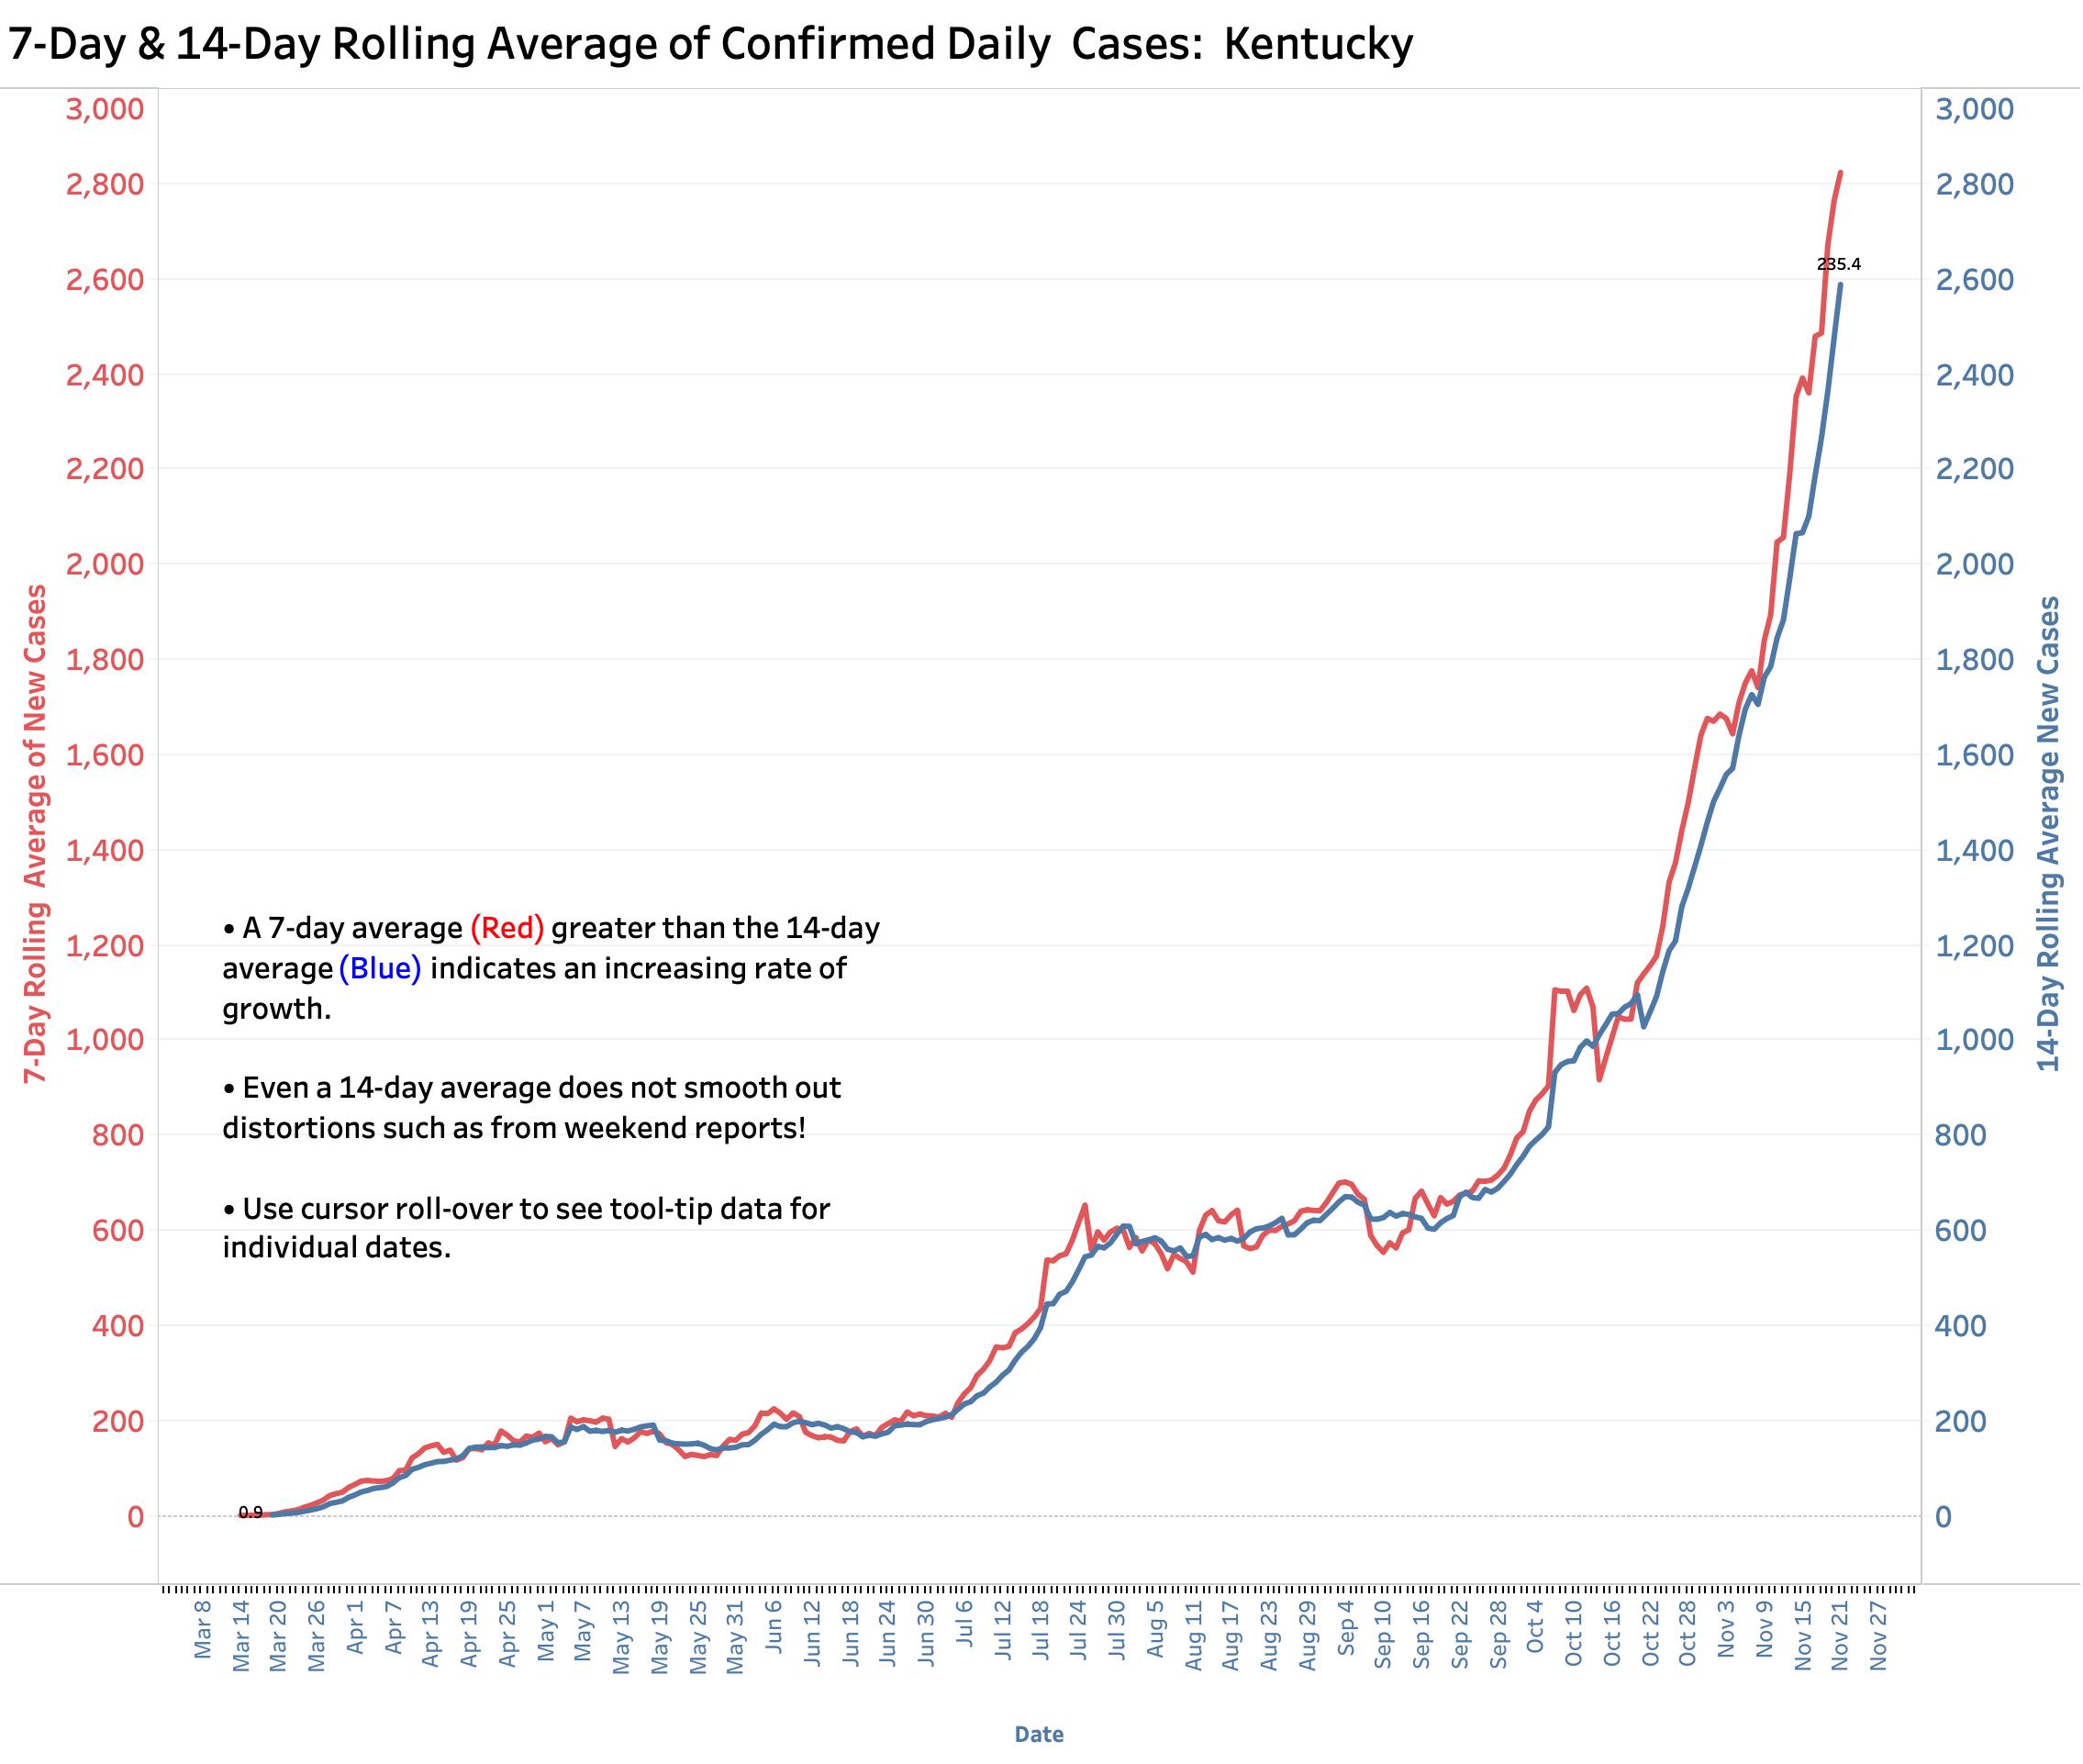
Kentucky is in the 260th day, 37th week, and 9th month of its Covid-19 plague. Hospitals here and nationally are getting slammed with more cases and fewer available clinical staff. With rates of new cases and deaths climbing more rapidly, Kentucky and many (but not all) states are instituting more stringent public health orders and recommendations. New vaccines with initially proven effectiveness but unknown long-term safety are coming before the FDA. These reveal some light at the end of the Covid tunnel. However, vaccines will not be widely available for much if not all of next year. Something had to be done to stall for more time. Kentucky’s new emergency orders and suggestions took effect last Friday evening, November 20. Enforcement is limited and the effect on cases will take some time to be seen. However, the number of new cases daily was accelerating too rapidly to ignore.
Summary Numbers:
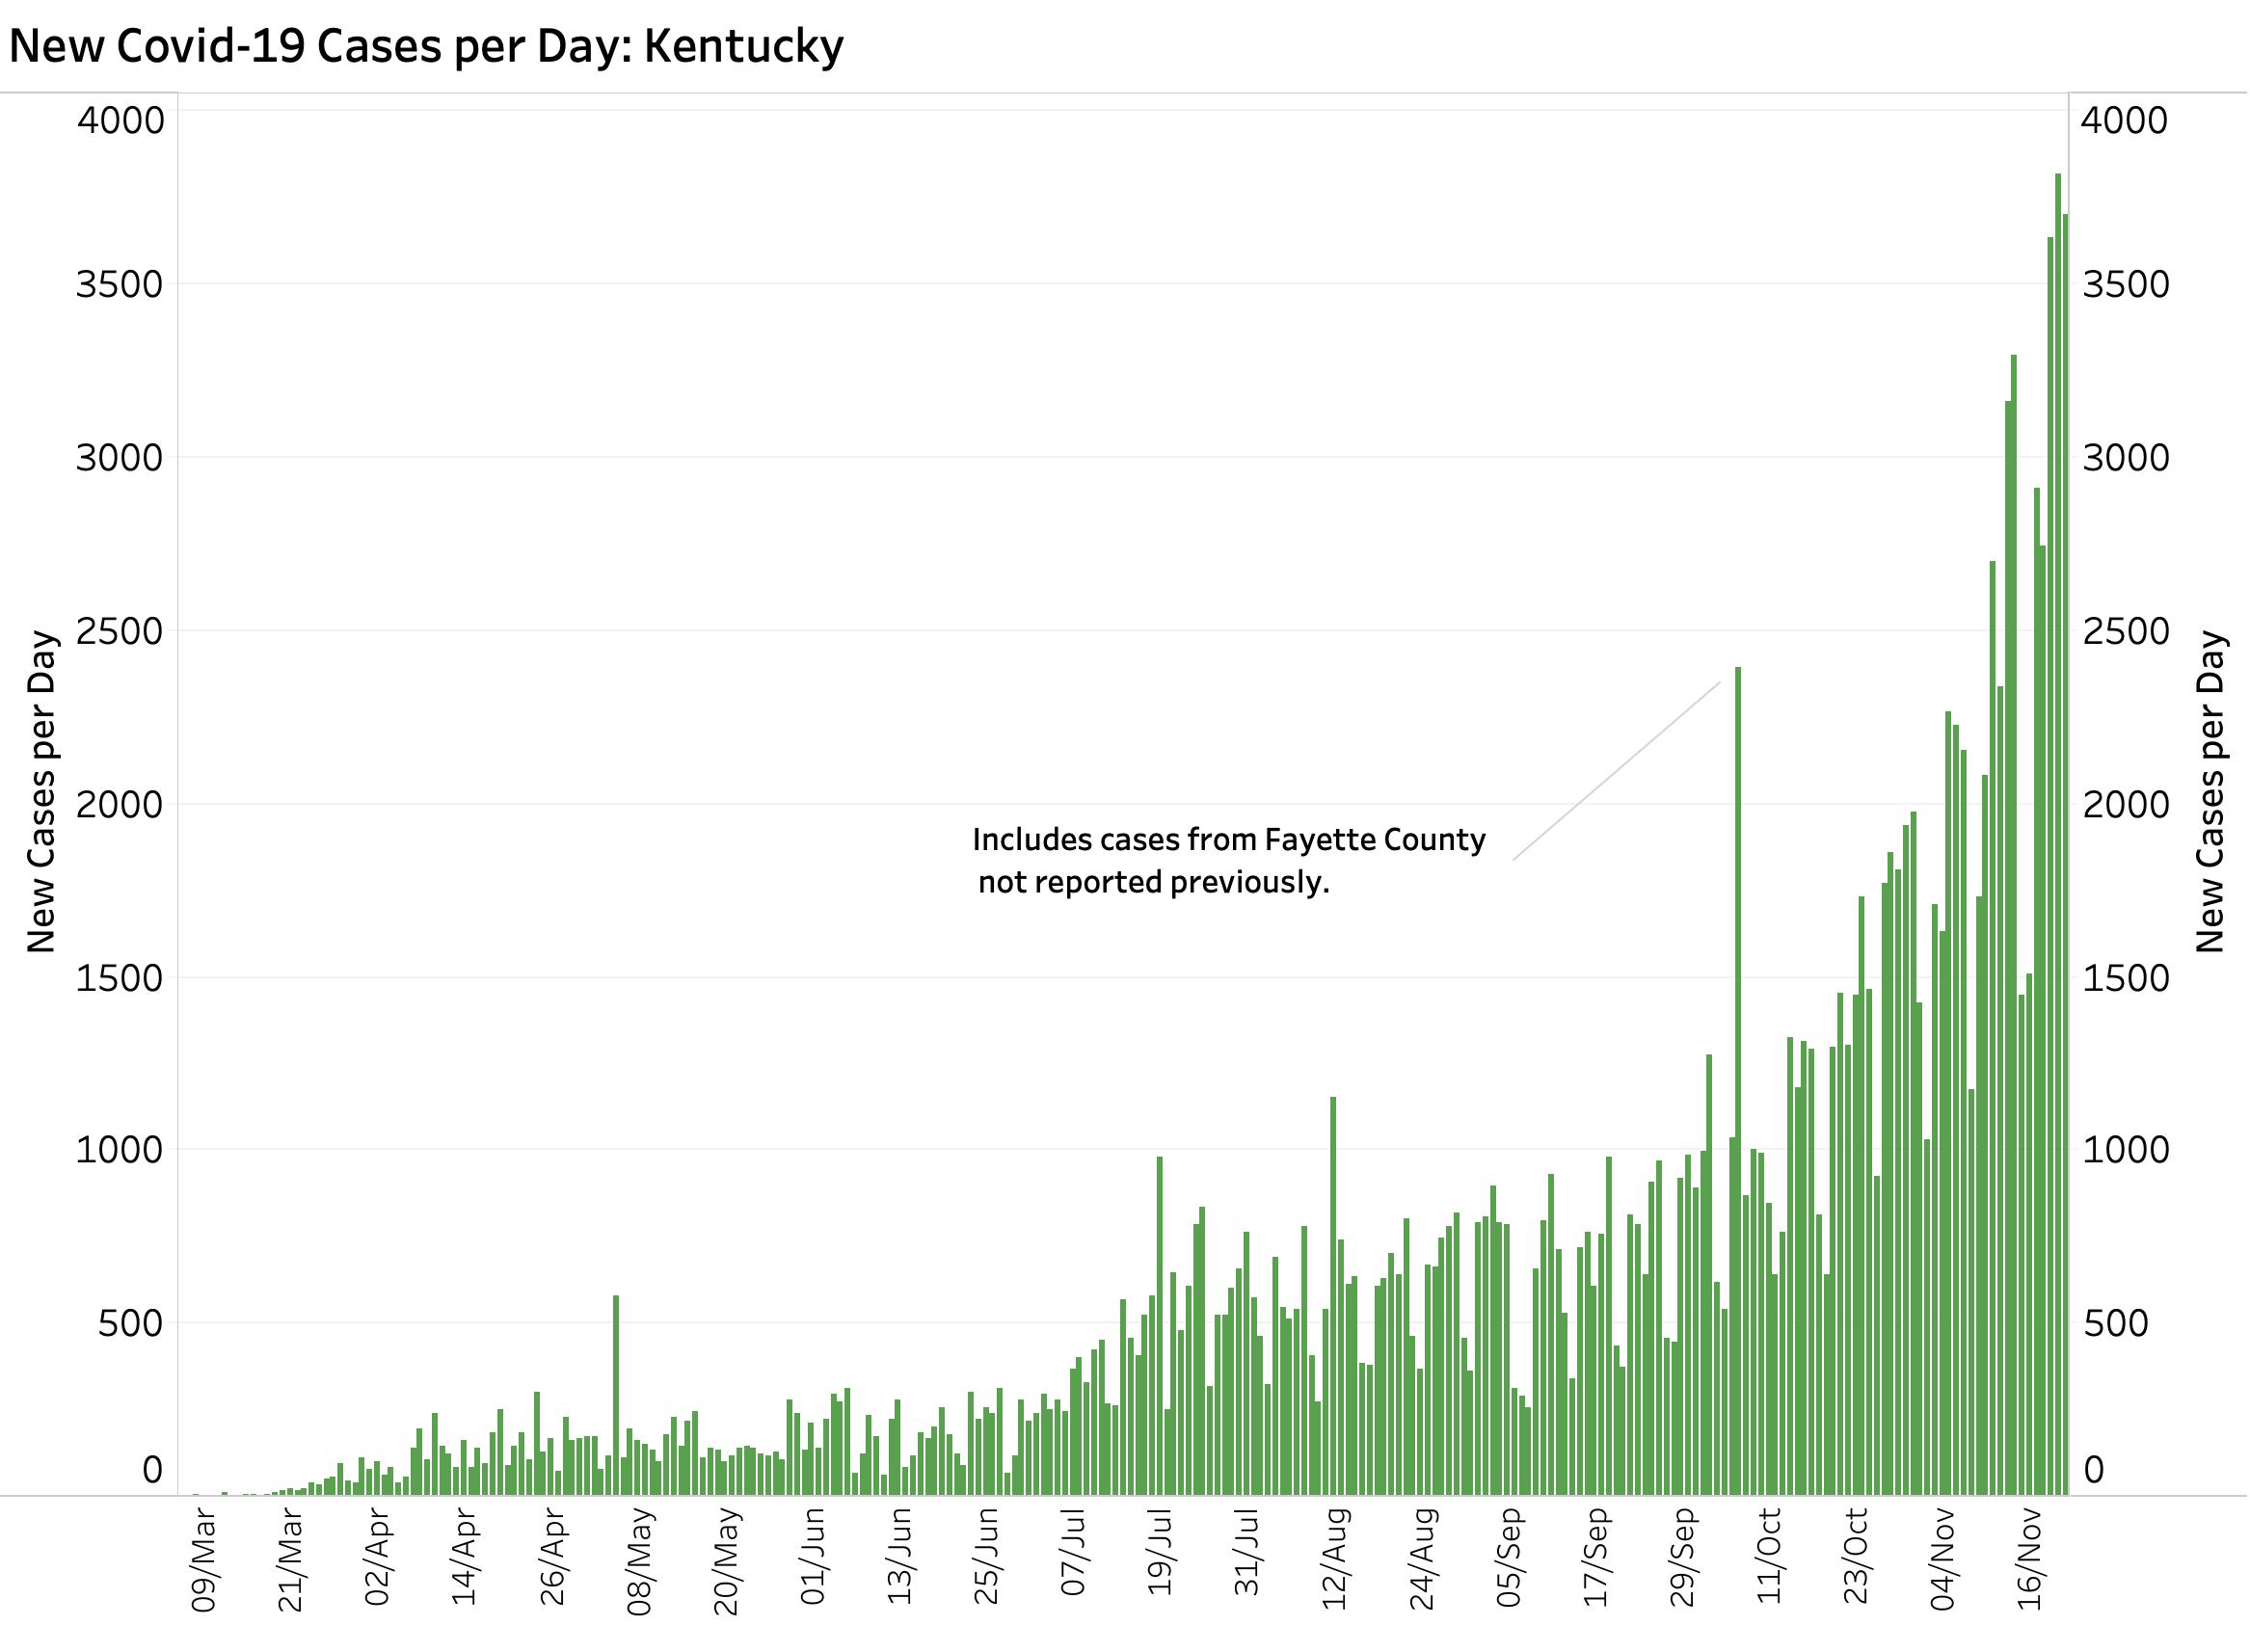
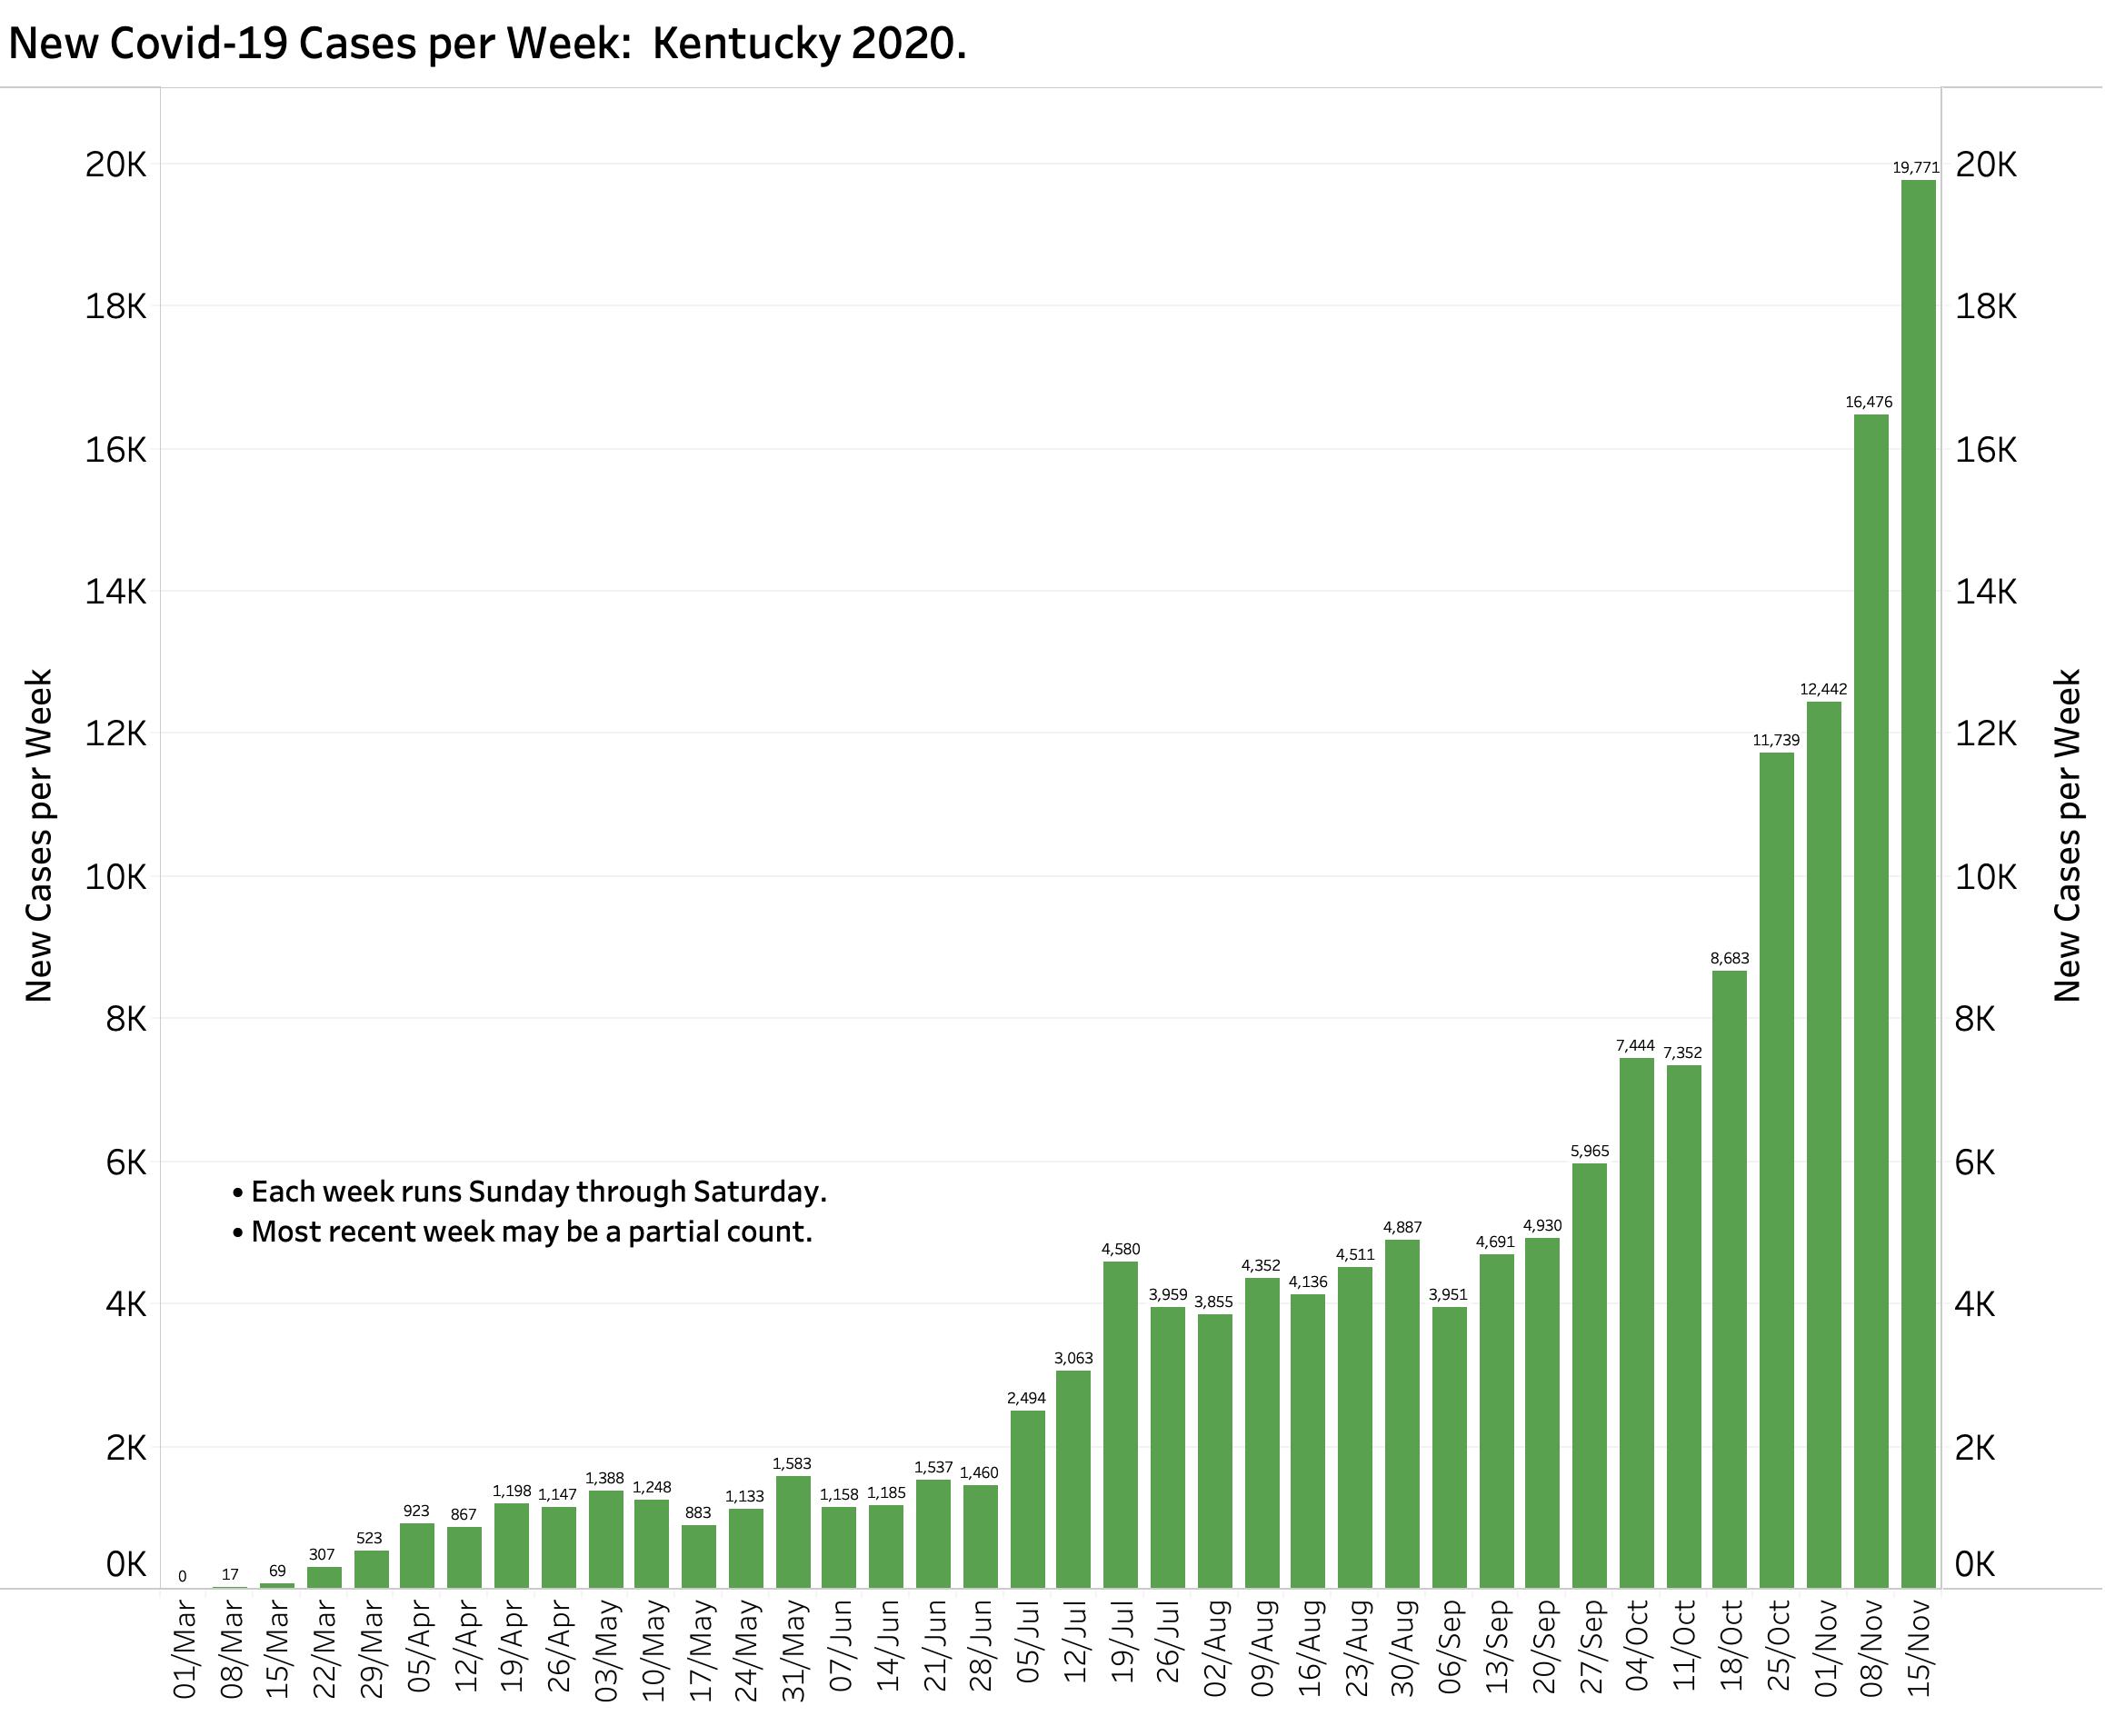
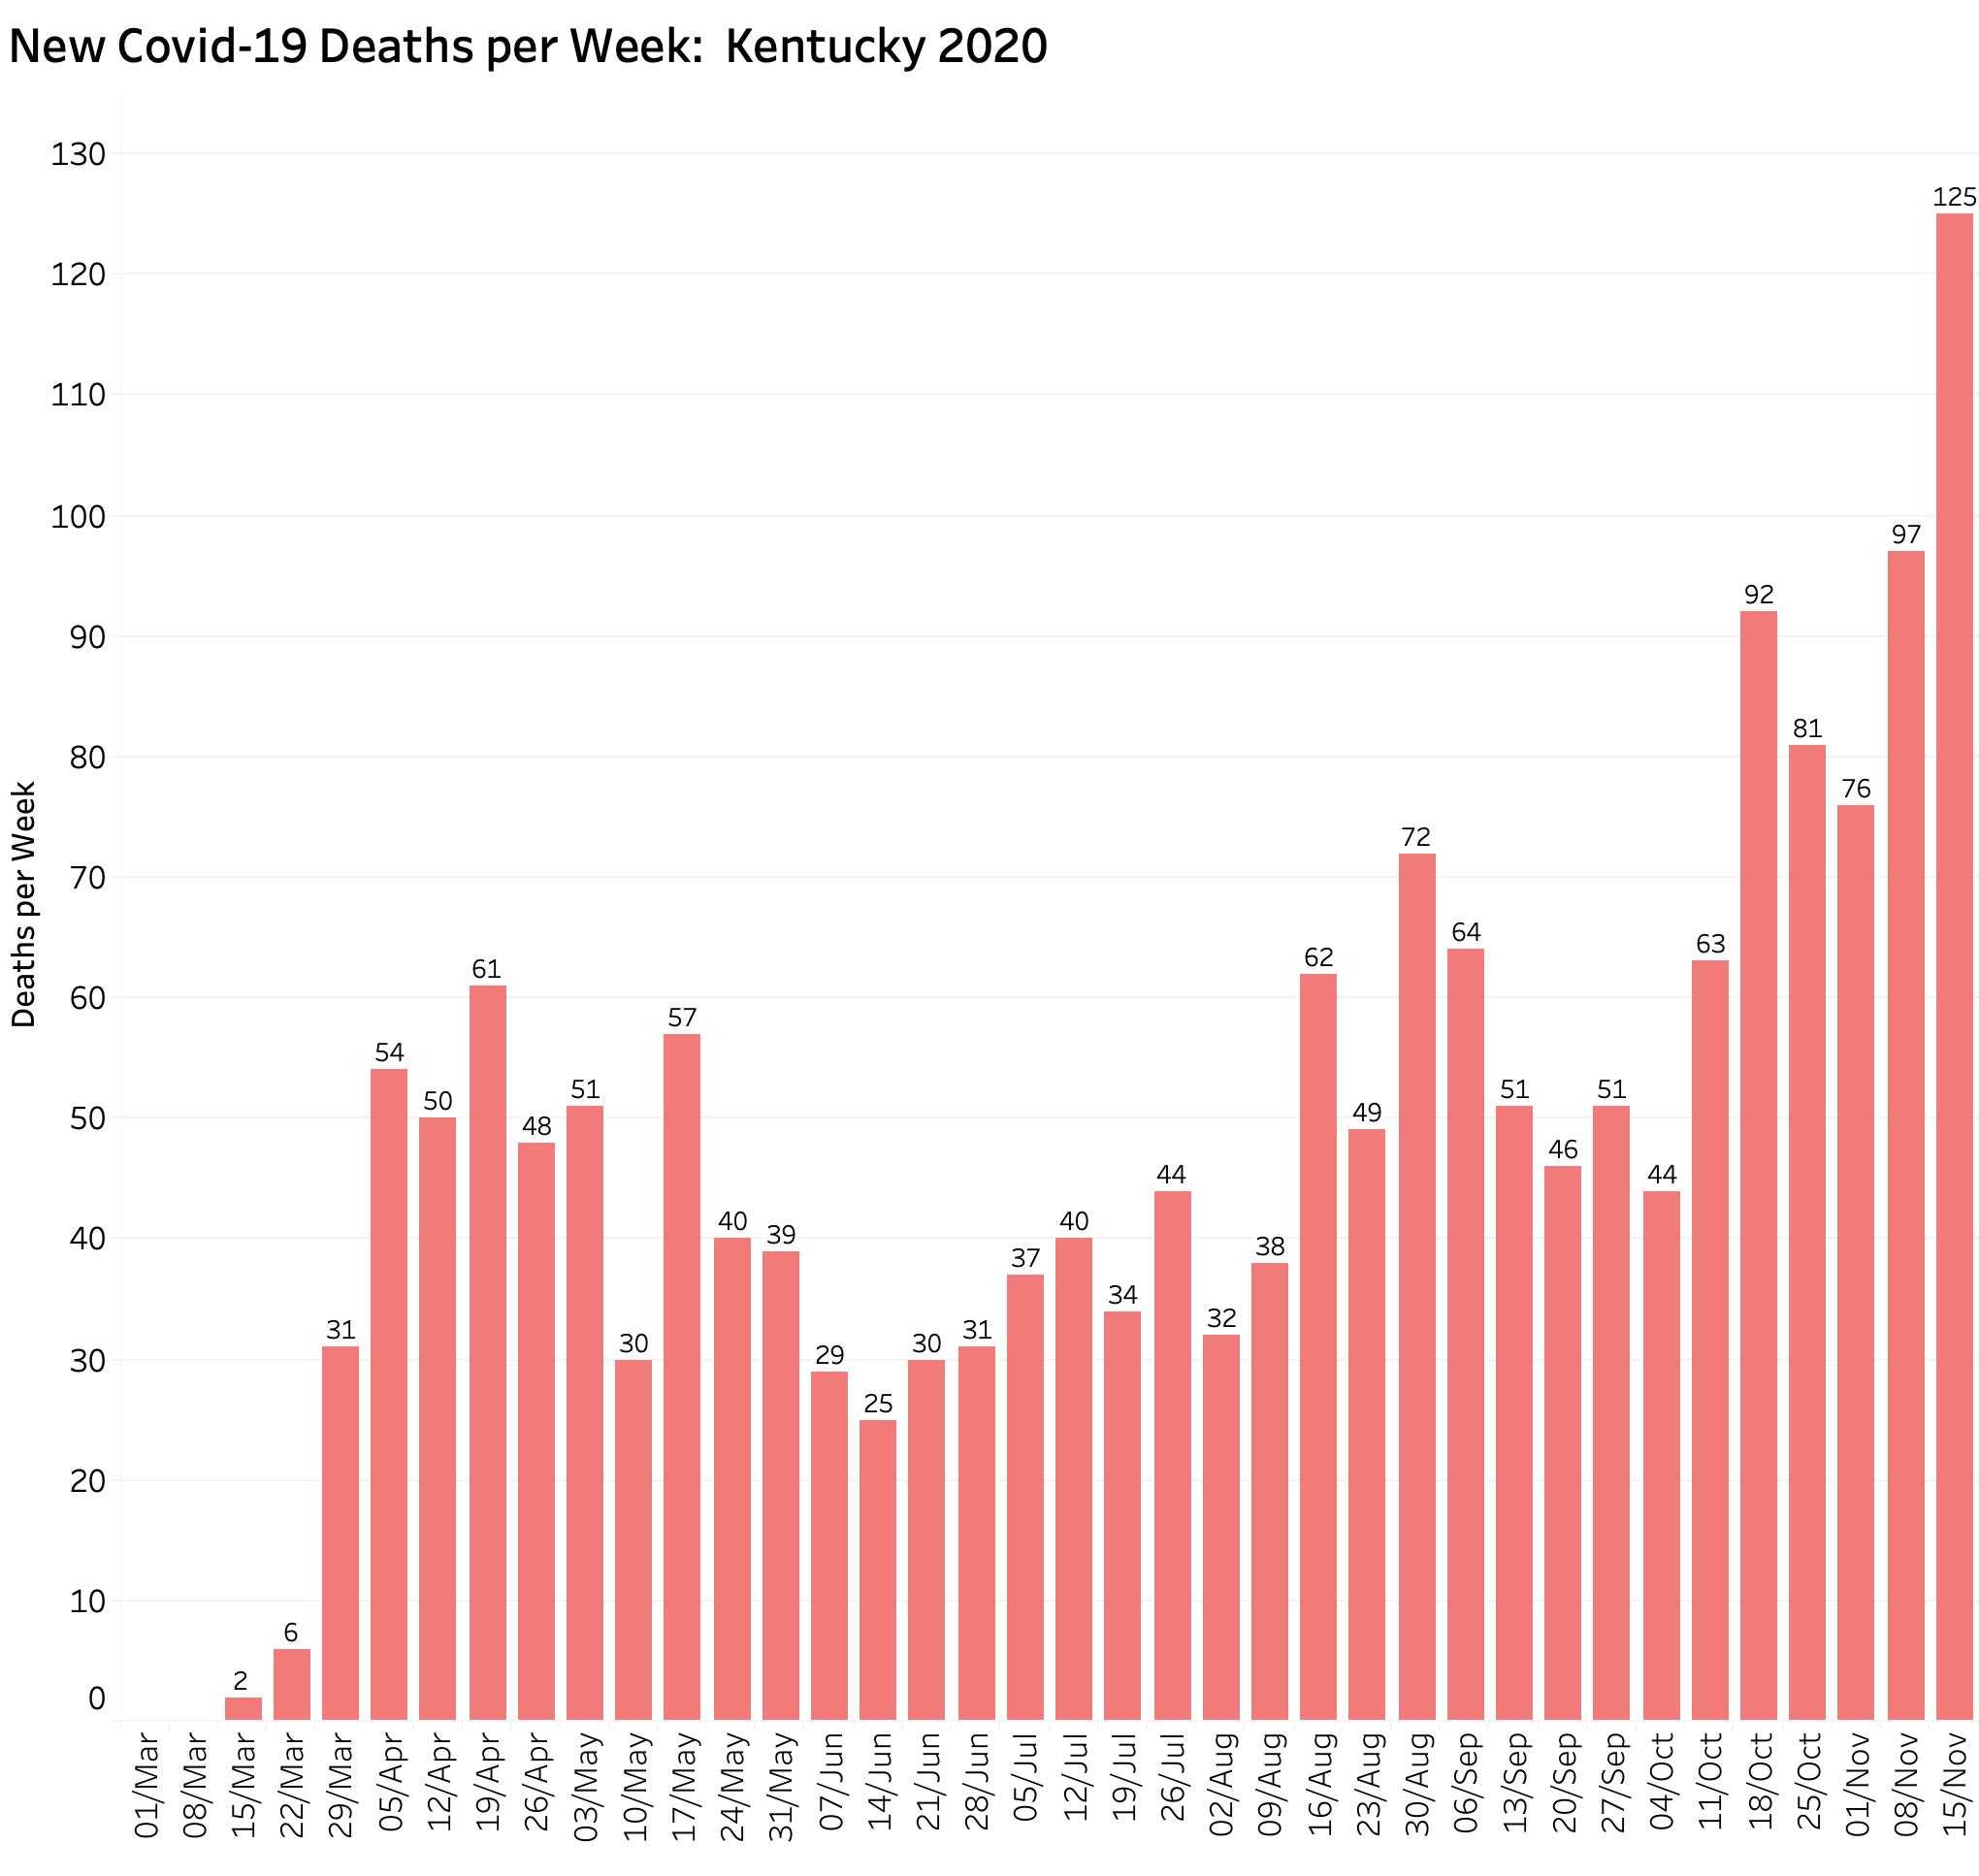
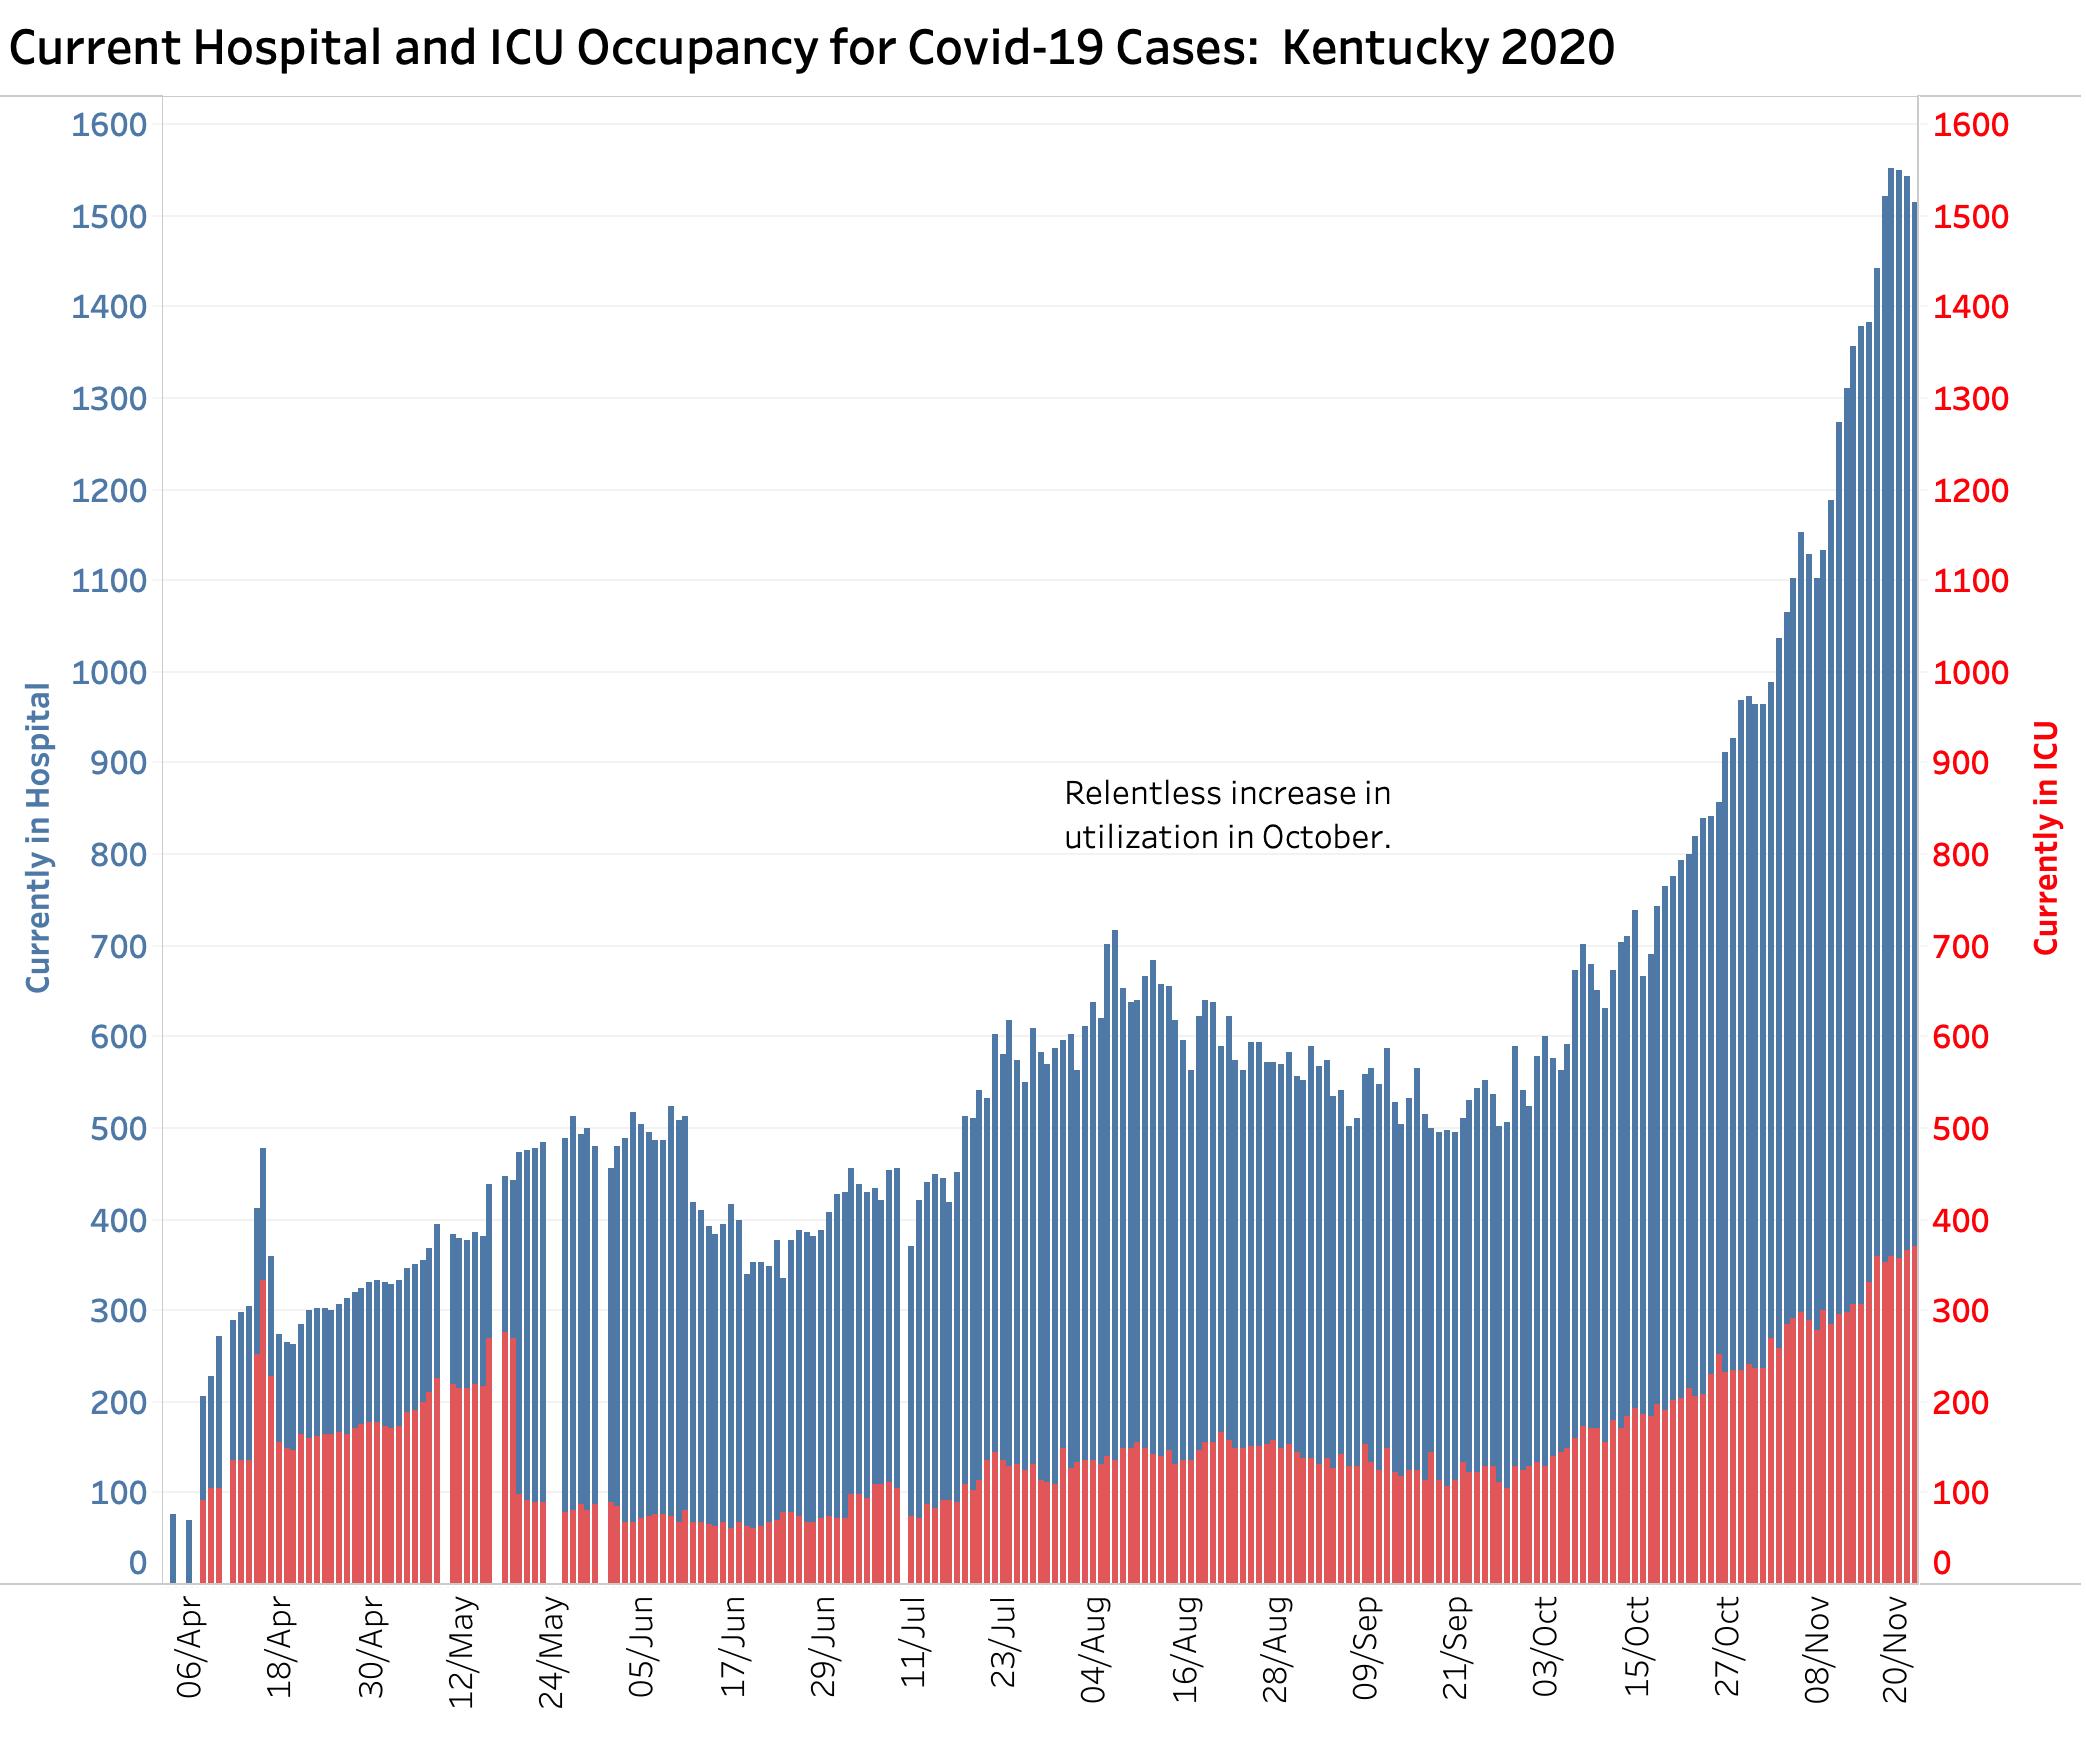
Kentucky has had 155,908 unique cases of Covid-19 since the first one on March 6th. In nine of the last 10 days through November 21, the number of new cases exceeded 3000. The time-to-double has fallen to 21 days, and at the current short-term rate, a trend line has Kentucky with a possible 5000 new daily cases by December 12. New cases per week jumped 20.0% from 16,476 to 19,771. With 8 days to go in November, we have already leapfrogged October’s record from 38,379 to 48,689 new cases. New cases are now emerging faster in rural and sparsely populated counties than in Jefferson, Fayette and more urban ones. Weekly deaths are following new cases having jumped 20% from 97 to a new record of 125 deaths. Deaths are certain to go much higher as the morbidity and mortality of current active cases reveals itself over the next weeks. Hospitals have never seen higher Covid-19 challenges.
At the end of this article is a selection of graphs that should be self-explanatory by now. The full portfolio of data visualizations can be viewed on KHPI’s Tableau Public website. The epidemic experiences of all 120 individual Kentucky Counties and be viewed here. Viewer-adjustable filters allow the epidemic experience of individual counties or ranges of dates to be explored. There are many interesting stories being told by the numbers. (Take a look at sparsely populated Lee County which has the highest aggregate number of cases per 1000 residents in the state!) On October 9th, I published an animated map of new cases as they appeared sequentially among the counties. The Governor’s office used such a similar display during one of last week’s presentations. A viewer can step through KHPIs visualization at their own pace. Free to explore some of the other Visualizations that address how and what Covid-19 data can show us. It has been an educational process for me.
I will dispense with additional editorial comment at this time. Suffice it to say that I fully support the justifiable efforts of Governor Beshear and his Public Health Department team. I correspondently condemn those who automatically for political purposes and without an offer of a rational alternative attempt to thwart at every step the application of standard public health measures. I blame them as well as the virus for the disastrous economic and medical places to which we have come and will enter further.
Peter Hasselbacher, MD
Emeritus Professor Medicine, UofL
22 November 2020
Read More for Figures: