
In one of the news-feeds I receive from various medical organizations was the notice that the parents of a young women in Middletown, Ohio added as the cause of death in their young daughter’s obituary that she died of a heroin overdose. This heartbreaking disclosure is newsworthy because is is part of a growing movement to bring the curse of opioid addiction further out of the shadows, specifically to emphasize that all communities and all families are vulnerable to this societal and medical problem. One can only imagine the grief of this family and be grateful for their courageous and generous act. They hope to help prevent other deaths in this way. As an aside, I am reminded that the Journal of the American Medical Association used to list the cause of death of all physicians who had died. As a boy I used to read these notices every week. Frequent causes were suicide, medical complications of alcoholism– and if my memory serves me– drug overdose. These problems have not gone away and remain as occupational hazards for physicians. We should be so open today as these parents were as we physicians attempt to heal our brothers and sisters.
The notice stimulated me to look at the pattern of opioid drug prescription to Medicare patients in Ohio to test the hypothesis that prescription drug abuse is the forerunner if not the fellow traveler of heroin and other illegal drug use. Using the same protocols I describe for Kentucky and Indiana, I extracted from the Medicare Part-D database all Ohio providers who prescribed every listed individual opioid drug to more than 10 patients in the year 2013. The totals for this subset were 2,362,795 opioid prescriptions costing $66.3 million. That information is further summarized and discussed below. In summary, based on the size of its population, Middletown was not an obvious hot-spot for opioid prescription but it was the business home to a family practitioner who was the 10th highest prescriber in the state. Other apparent problem areas did emerge from the data including southern Ohio where the epidemic of prescription drug abuse was recognized early.
Middletown was not the worst.
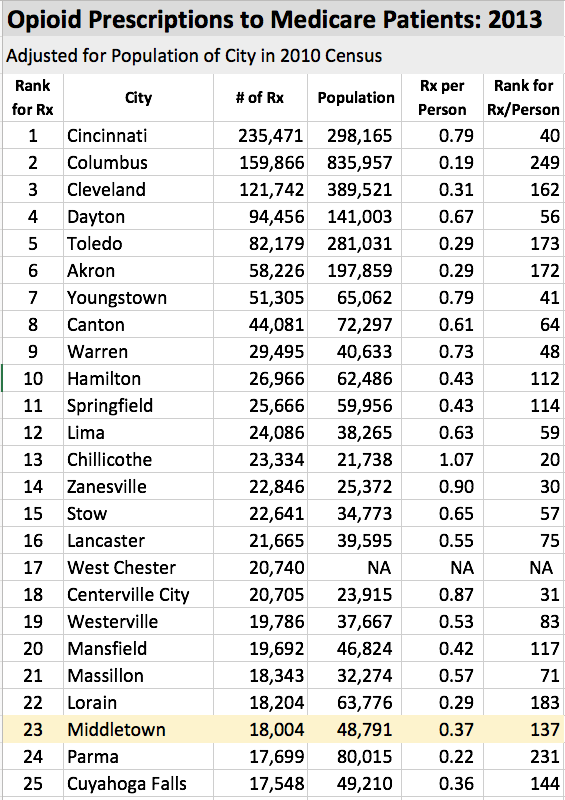
With some 48,791 inhabitants, Middletown is the 17th largest city in Ohio. In terms of the number of opioid prescriptions written (18,004) it ranks as the 23d highest city. In terms of the number of prescriptions written per person (0.37), it ranks as 137th out of 557 cities identified by Medicare as having opioid prescriptions written. The average for all Ohio cities is 0.36 per person with a median of 0.26 [for cities with data that could be corrected for population].
Thus it cannot be said from this data alone that Middletown is a hotbed of opioid prescribing, but one family physician in that town ranks 10th in the state for number of opioid prescriptions with 3,776. That may be all it takes to fuel the beast. If Middletown is not jumping out of the numbers as hotspots of opioid prescription to Medicare patients (and by presumption to other patient groups), other Ohio cities are. Further details in the following tables.
Prescribing of opioids by city: Volume vs. Rate.
Just below is a table of the top-25 Ohio cities ranked by total number of opioid prescriptions. It is not surprising that the cities with the largest number of people also have the largest overall volume of prescriptions. The correlation of population and prescription rate breaks down rapidly. When adjusted for the number of people, it can be seen that some cities have higher or lower prescription rates than would be expected by their population size. For example, Chillicothe ranks highest in prescriptions per person in this top 25 list of cities ranked by volume and Columbus ranks surprisingly low! This discrepancy is most apparent when cities are ranked by opioid prescription rate.
Cities with high opioid prescribing rates.
Following is a table of the number of prescriptions to this group of Medicare patients corrected for the total number of people in that city. While this is not a perfect way to correct for the size of the city, [See the technical note at the bottom of this article.] the results are coherent and of interest. On top of the list is the very small town of Proctorville where the number of prescriptions normalized by overall population was 6.4 prescriptions per person. To put this in perspective, the second highest such rate was a big step down at 3.4. Only 23 cities and towns had a rate of 1.0 or higher prescriptions per person. Of note is the fact that a single physician in Proctorville prescribed two thirds of all the opioids.
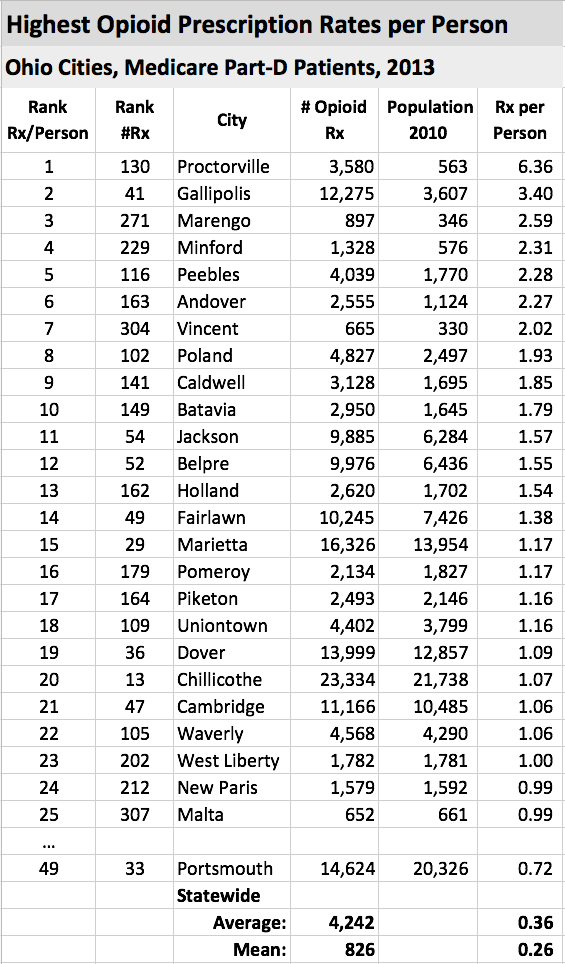
Note that it is small towns that dominate the top end of the list. Cincinnati and Columbus are well down the list at 0.79 and 0.19 Rx/person respectively despite their overall high volume of total prescriptions. Only 23 cities had a rate of greater than 1.0 and the average was 0.36. The city of Portsmouth is added to the list for contrast and interest. I am not familiar enough with Ohio geography or its prescription drug or heroin problems to be able to recognize which if any of these top 25 cities has been identified as current drug-abuse “hot-spots.” Perhaps some or our readers will contribute to this discussion.
Readers may recall that it was in Proctorville at the top of this list that the concept of the industrial-strength Pill-Mill was conceived. For those not familiar the background of the contemporary explosion of prescription drug and heroin abuse and how it was fueled by the nominally legitimate pharmaceutical companies, I refer you to the book, “Dreamland: The True Tale of America’s Opiate Epidemic,” by Sam Quinones. You won’t think the same way about this problem ever again. At the center of the book’s narrative is the town of Portsmouth, sitting on the Ohio River 32 miles downstream from Ashland, KY. It was once ground zero of prescription drug abuse in the Oho River valley if not the nation. Surely it cannot be a coincidence that of the 25 Ohio cities with the highest rate of opioid prescriptions, 8 are within 50 miles of Portsmouth and 10 are within 100 miles. Just across the river are some of Kentucky’s own drug-problem areas. Surely based these data, the drug problems of Portsmouth, Proctorville and southern Ohio had not gone away by 2013.
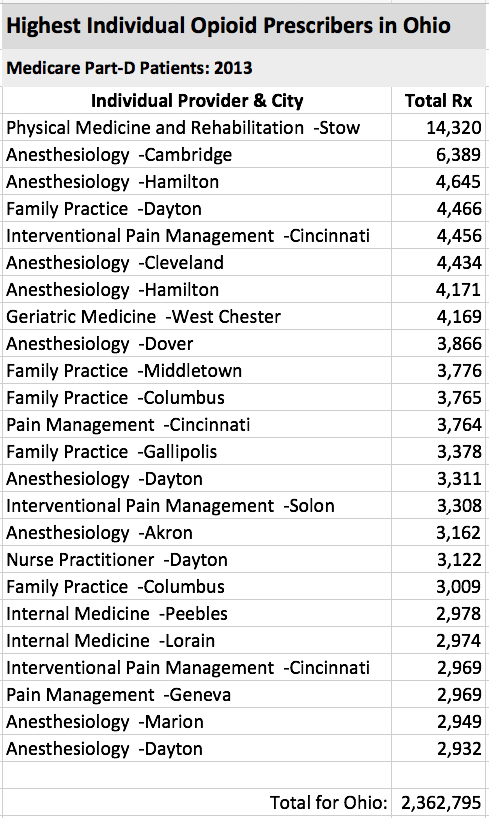
“Super-prescribers” skew the statistics.
As we have seen in Kentucky and Indiana, an individual or a handful of providers skew the averages up dramatically. Some of these almost certainly fuel the drug-abuse epidemic inadvertently or not. Below is a table of the 25 top individual prescribers of opioids to Medicare patients in Ohio identified by specialty and city. To put things in perspective, the average number of prescriptions for all 15,399 providers in Ohio prescribing any opioid to more than 10 patients in 2013 was 153 with a median of 53 prescriptions. Let me be clear, that there is no way to determine on the face of the Medicare data that any of these providers are prescribing illegally or inappropriately and I do not do so. It is my opinion that when far-outliers are identified in any such research analysis that a closer look is appropriate if only to make sure that the underlying data is accurate and relevant. Not to validate or seek to understand the results serves no one’s legitimate interests. Help me do so.
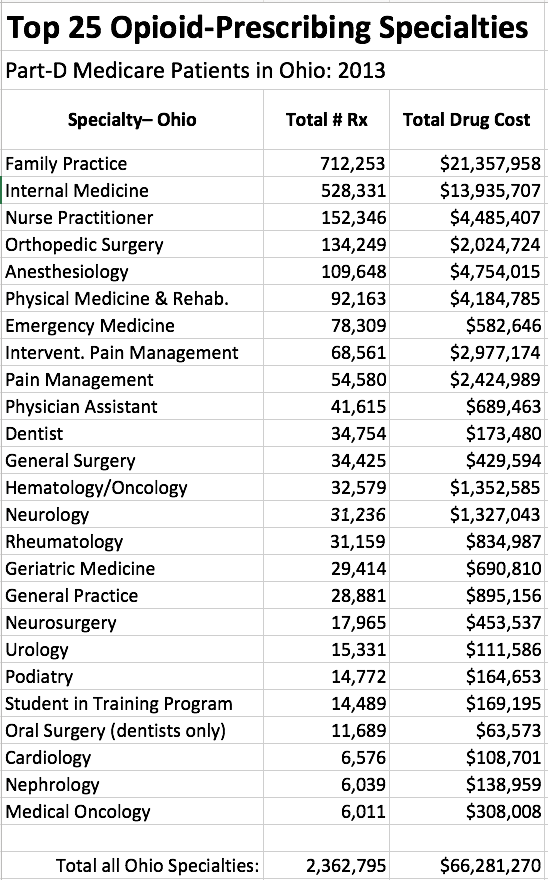
Prescribing by specialty.
It should longer be a surprise that of the top 25 individual opioid prescribers, 16 are in the business of pain-management. On the other hand, the remaining 9 are in general medical specialties including one in Geriatric Medicine. This observation reinforces the conclusion that coming to grips with opioid abuse implies more than just focusing on pain-clinics and pain-management. Below is a list of opioid prescription by specialty.
 Concluding comments.
I have not had much feedback on this series of articles exploring the Medicare Part-D Prescription database. Nonetheless I have found the enterprise both technically and intellectually challenging. I believe that the best public policy development is based on actual data– to both identify issues and to monitor attempts to improve things. Surely this principle can be applied to how we use prescription drugs. Beyond their role in underwriting the continuing societal catastrophe of drug addiction, the cost alone of all prescription drugs is torpedoing the affordability of health care for anyone. It is no longer a question of asking if it it possible to control the utilization and cost of prescription drugs– we must. If we fail in this responsibility, our healthcare non-system will crater and any remaining semblance of its social equity or justice will evaporate.
No doubt readers of these articles will have ideas and special insights of their own about drug utilization and prescription. What other areas of prescribing should be bright-lighted that can be looked at in the Medicare or similar databases? Every person should have some unique insight into how we can prescribe more efficiently, more safely, with as good or better outcomes, and at lesser cost. Surely some of these ideas can become incorporated into public health policy.
There are tools in the public’s hand to do additional exploratory analysis. Just last week, Medicare made available a “Part-D Prescriber Look-up Tool” that allows anyone to do searches of the Prescription Database without a high-powered computer or software. Take a look at my comment to my own recent article for suggestions on how you can become involved. Feel free to comment below or to contact me by email to share, or arrange further conversation by phone.
Peter Hasselbacher, MD
President, KHPI.
Emeritus Professor of Medicine.
September 13, 2015
Technical Note on Adjustment of Prescribing Rates:
I needed some way to normalize the number of opioid prescriptions for the size of a city. A city with a large population would be expected to have a higher volume of prescriptions even if the overall rate of prescribing is not excessive. The best, or at least the easiest I could come up with was to calculate a prescription rate per person. I cross-referenced a table of the 2010 population of cities in Ohio. This is clearly an imperfect method. The census areas used in organizing lists of city populations do not correlate perfectly with the business addresses of Medicare providers, especially in the smaller tracts. Recognize too that these are prescriptions to Medicare beneficiaries, and that the elderly and disabled are not evenly distributed across all cities. In rural areas, Medicare providers may service a broader area, or the presence of a unique facility or service may skew the correction. Nonetheless, the results seem coherent, are of interest, and lend a different and more objective perspective to the analysis. I posit a working assumption that patterns of opioid prescription to Medicare patients in a given community are at least in part representative for all inhabitants, and that drugs prescribed to Medicare beneficiaries trickle down into the larger user marketplace.
As always, if I have made an error of fact or interpretation. please help me to correct it.
Easy-to-read article in Washington Post profiling Dayton, OH as a major hub of heroin and prescription drug abuse. This is not a surprise given the prescription numbers, rates, and presence of highest-providers in Dayton and surrounding areas. It is no surprise either that Ohio, along with West Virginia and Missouri lead the nation in the rate of heroin deaths.
The article tells the same story as the book, “DREAMLAND: The True Tale of America’s Opiate Epidemic” by Sam Quinones.