
Into this world we’re thrown, like a dog without a bone.
The Doors, 1971
I never appreciated nor fully understood the lyrics of this iconic rock anthem. In today’s world, a different context made the words jump unbidden into my head. There is no need for me to launch into a lengthly end-of-week-review today. Everyone should already know that what is happening in Kentucky and in the nation broadly is nothing short of the disaster that defines pandemics plagues. Here and nationally new records are being set daily. I invite the reader to visit KHPI’s Public Tableau website to interactively explore an updated portfolio of data visualizations of Kentucky’s numbers.
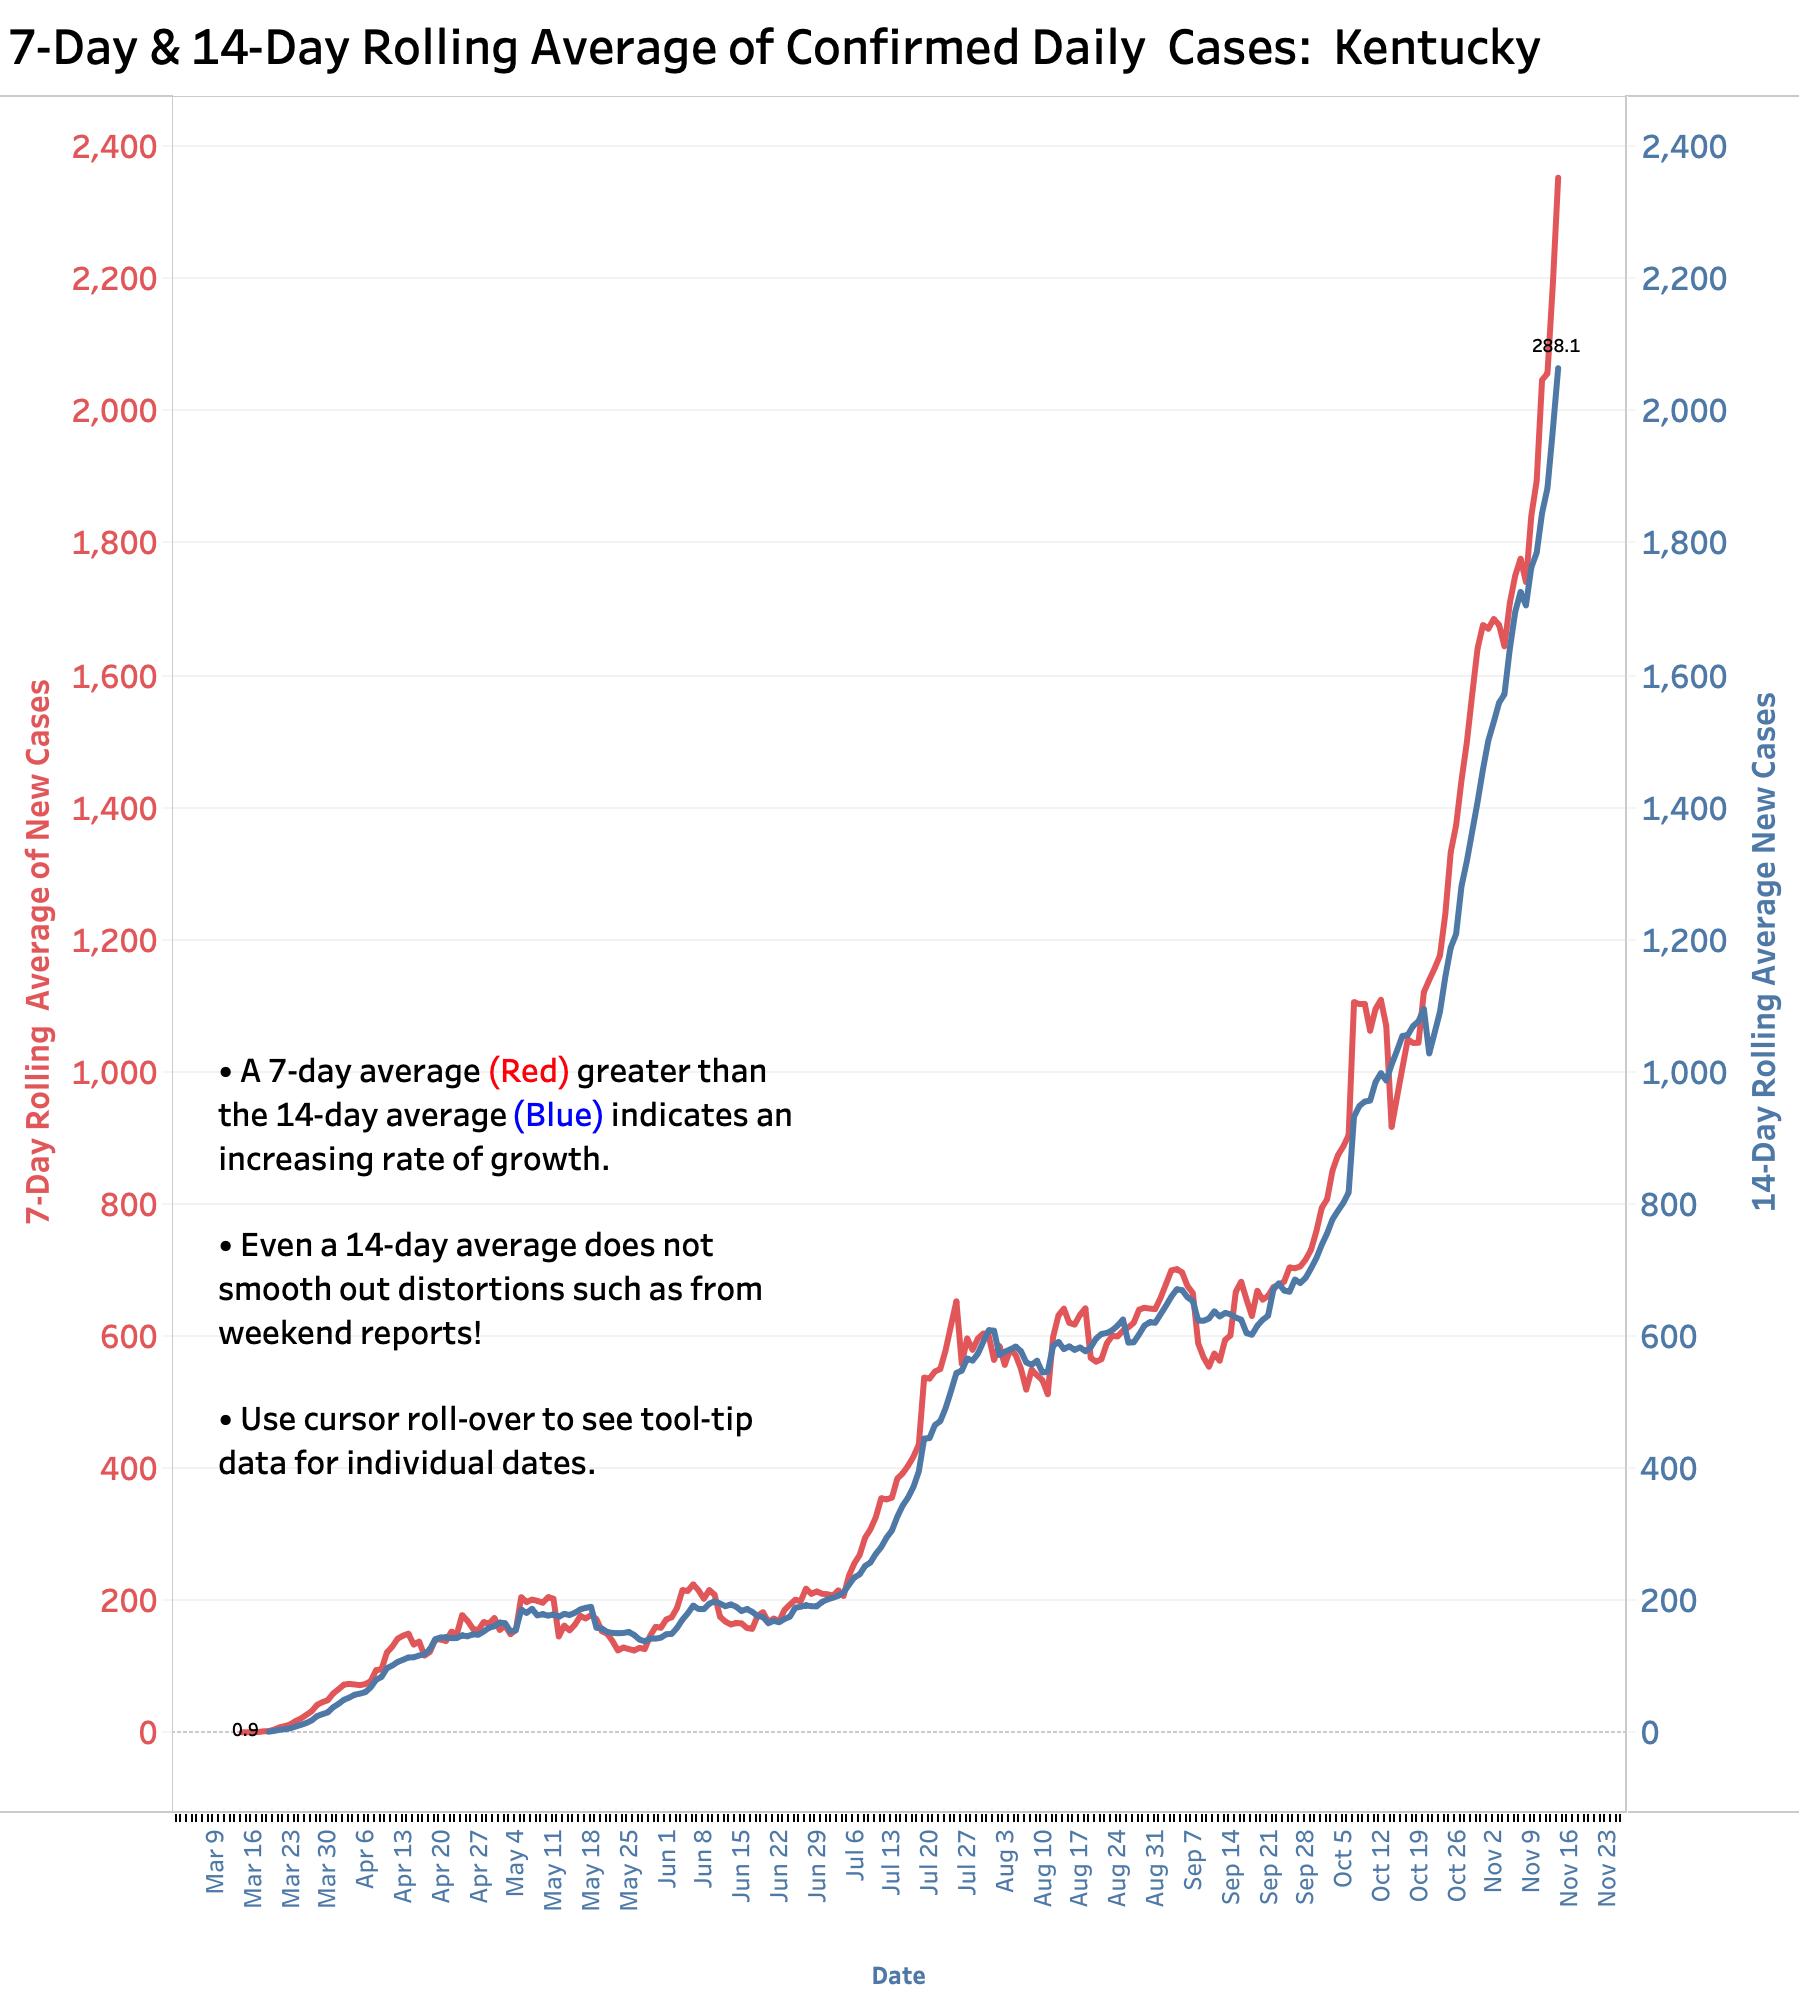
In brief, virtually every Covid metric that KHPI has been following set a new record last week. Daily new cases now number greater than 3000. Weekly new cases jumped 32% from 12,442 to 16,476 for the week ending Saturday, Nov 14. The 7-Day rolling average of new cases is surging towards a straight-up direction faster than the 14-Day average indicating a rapidly expanding epidemic. Hospital and ICU utilization by Covid-19 patients is also setting new records records daily with hospitals making no attempt to hide their concerns about limited resources of space, inventory, or staff. The number of weekly Covid-19 deaths set a new record at 97, increasing from an average in the 80s for the preceding three weeks. It is inevitable, that despite better understanding of the disease and its treatment, the number of Covid-19 deaths will also accelerate. The number of total tests reported [not including many tests performed but not reported] remains more or less constant since early September at around 150,000 per day.
Below is a single graphic that encapsulates the dire situation we are facing. The people of Kentucky and their leaders, regardless of their political or social persuasions, are going to have to take responsibility for and to respond to this darkening storm.
How bad can it possibly get? What tea leaves should be reading? Looking at what has or is happening in other states and countries informs us that it can get a lot worse than it correctly is in Kentucky. Kentuckians have been pushing back on the viral monster, but some of us feel like an actor out alone. We do not have data that is sufficiently current or standardized to take full advantage of what is happening in other states, or indeed even within our own counties. Left by Washington largely to our own resources for so long, we and others are left to look at what has already happened to us in the past, and on that basis attempt to predict what is to come– if nothing else changes. Of course, that latter clause is the unpredictable kicker.
There’s a killer on the road.
When a sharply increasing epidemic curve such as those in the 7-Day and 14-Day average curves above seem to be going straight up, it is difficult to predict where they are headed. We intuitively recognize that when numbers are increasing at a faster and faster rate, that things can go from bad to worse in an correspondingly shorter time. To offer a mathematically rational way to tame exponential increases (think compound interest), KHPI has offered semi-log plots as a basis for calculating understandable trendlines. Of course, based on previous history alone there is a limit on how far into the future one can reasonably predict. However, the better the fit of data to a trendline or forecast, the more confident one can be that predictions are at least rational. In fact, earlier KHPI projections using this approach have turned out to be pretty good!
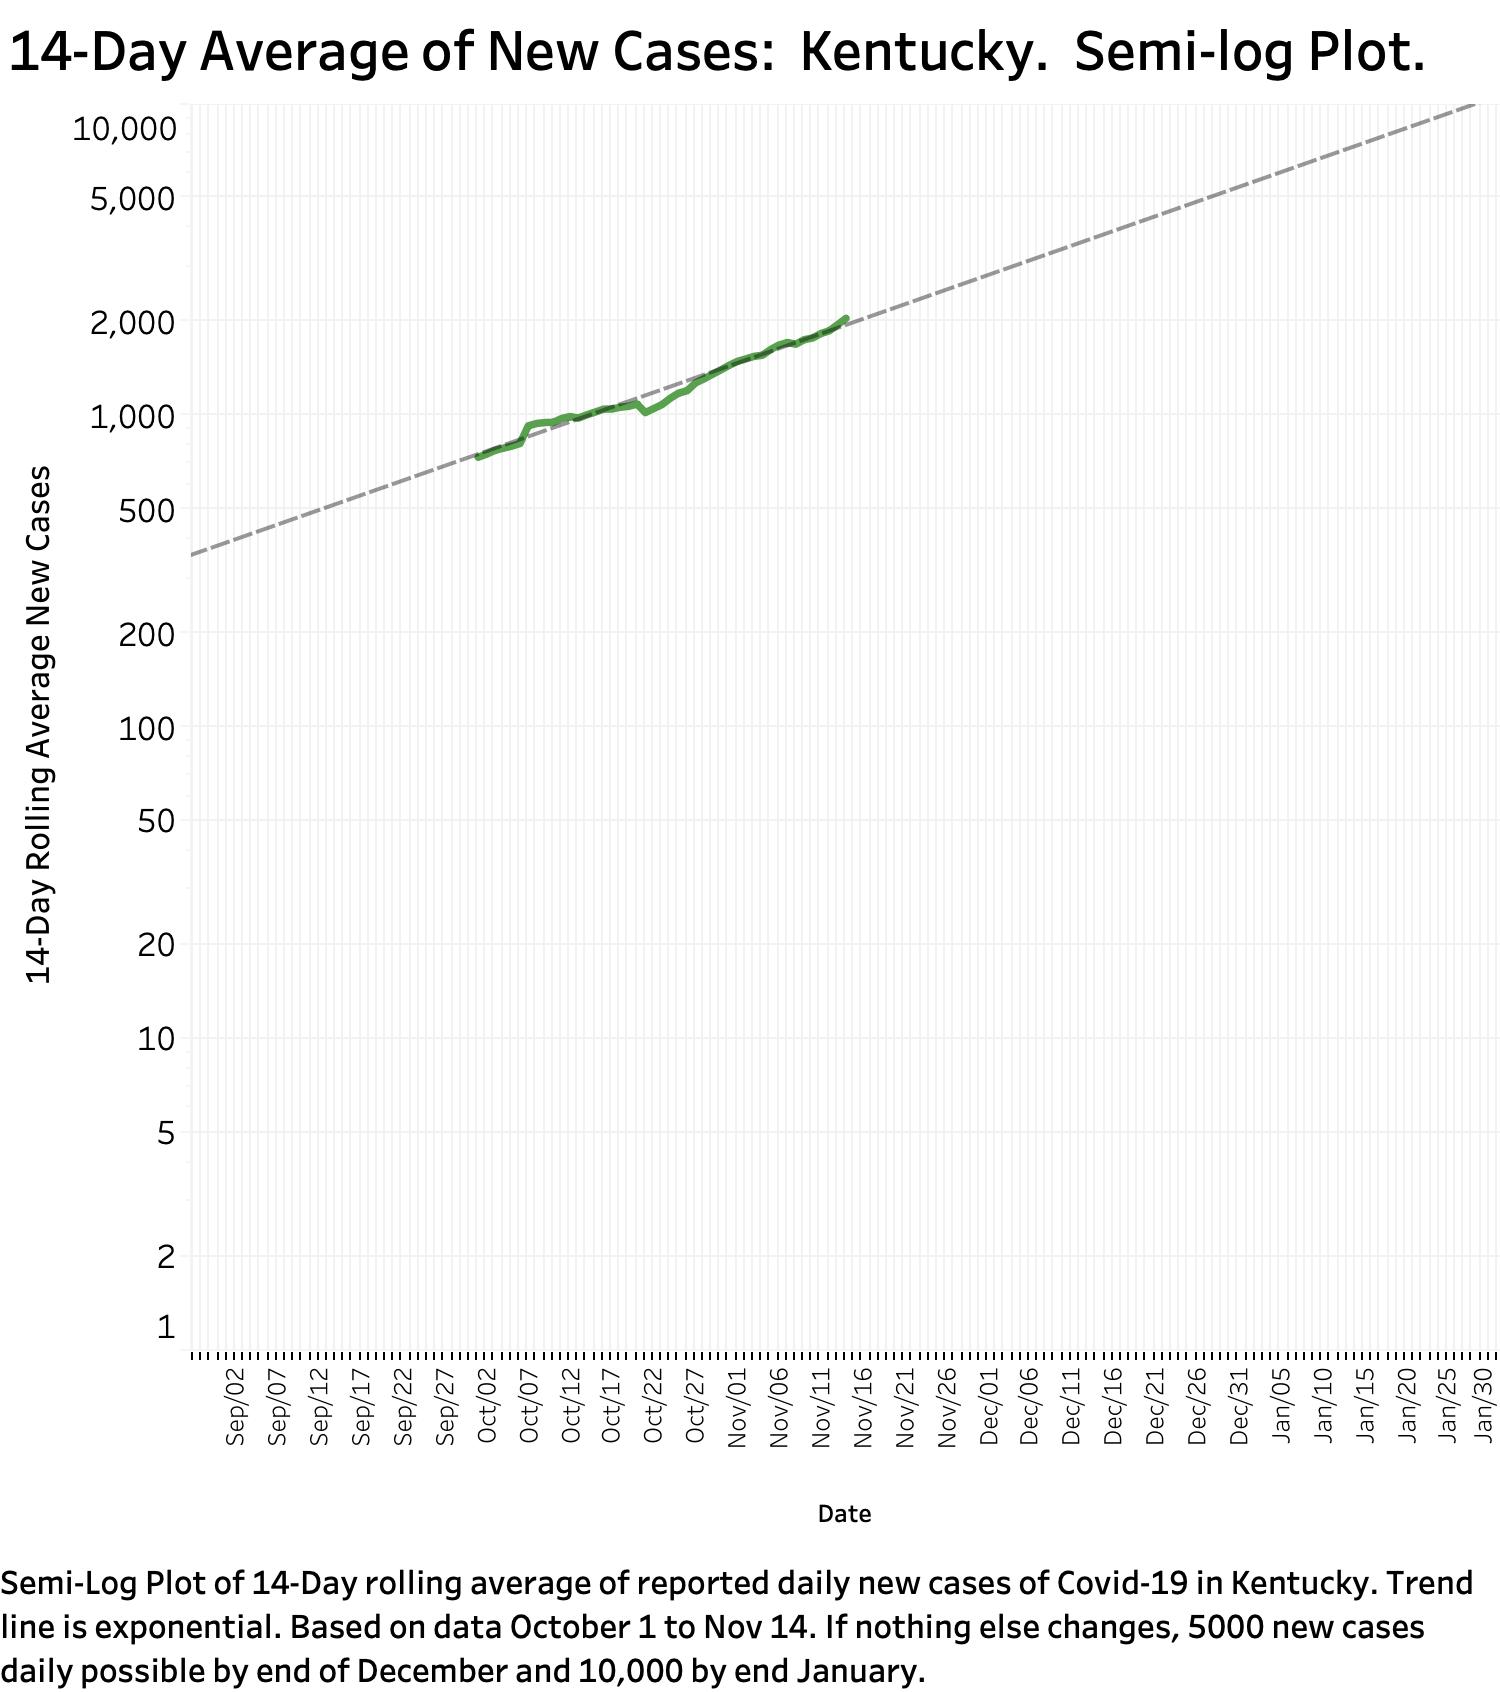
Below is a semi-log plot of the 14-Day average of new cases of Covid-19 in Kentucky based on daily Frankfort numbers from October 1 through November 14. As is anticipated when an exponentially rising curve is graphed with new cases on a logarithmic axis against linear time, the data points fit a straight line very well. Indeed, the statistical fit for Kentucky’s numbers is excellent. [For data-aware folks, R-Squared= 0.97 and p= 0.0001]. I forget the calculus I learned 50 years ago to offer an equation, but inspection of the trend-line on device screens or on paper allows one to estimate a doubling time of some 30 days. Based on new case numbers over the last month-and-a-half, we may be seeing as many as 5000 new cases per day by Christmas. By the end of January 10,000 cases per day are in the realm of possibility. Of course, this assumes that nothing will change– but surely it has to. [Disclaimer: As financial advisors always note, yields of the past do not necessarily predict profits for the future!] You can interactively change the data intervals Tableau Online uses to calculate trends and forecasts to see how they are becoming steeper. My take-away from these exercises is that we should have seen this coming for some time– at least since last summer.
It could be worse– and for the rest of the USA it is!
There is no question that Kentuckians have been working hard to stay ahead of the curve. It has been difficult. Sacrifices have been made. Most of us have suffered financially and all of us injured someway in spirit. Thank goodness we have Mississippi or Indiana to compare ourselves to. We are definitely doing better than many other communities by a lot!
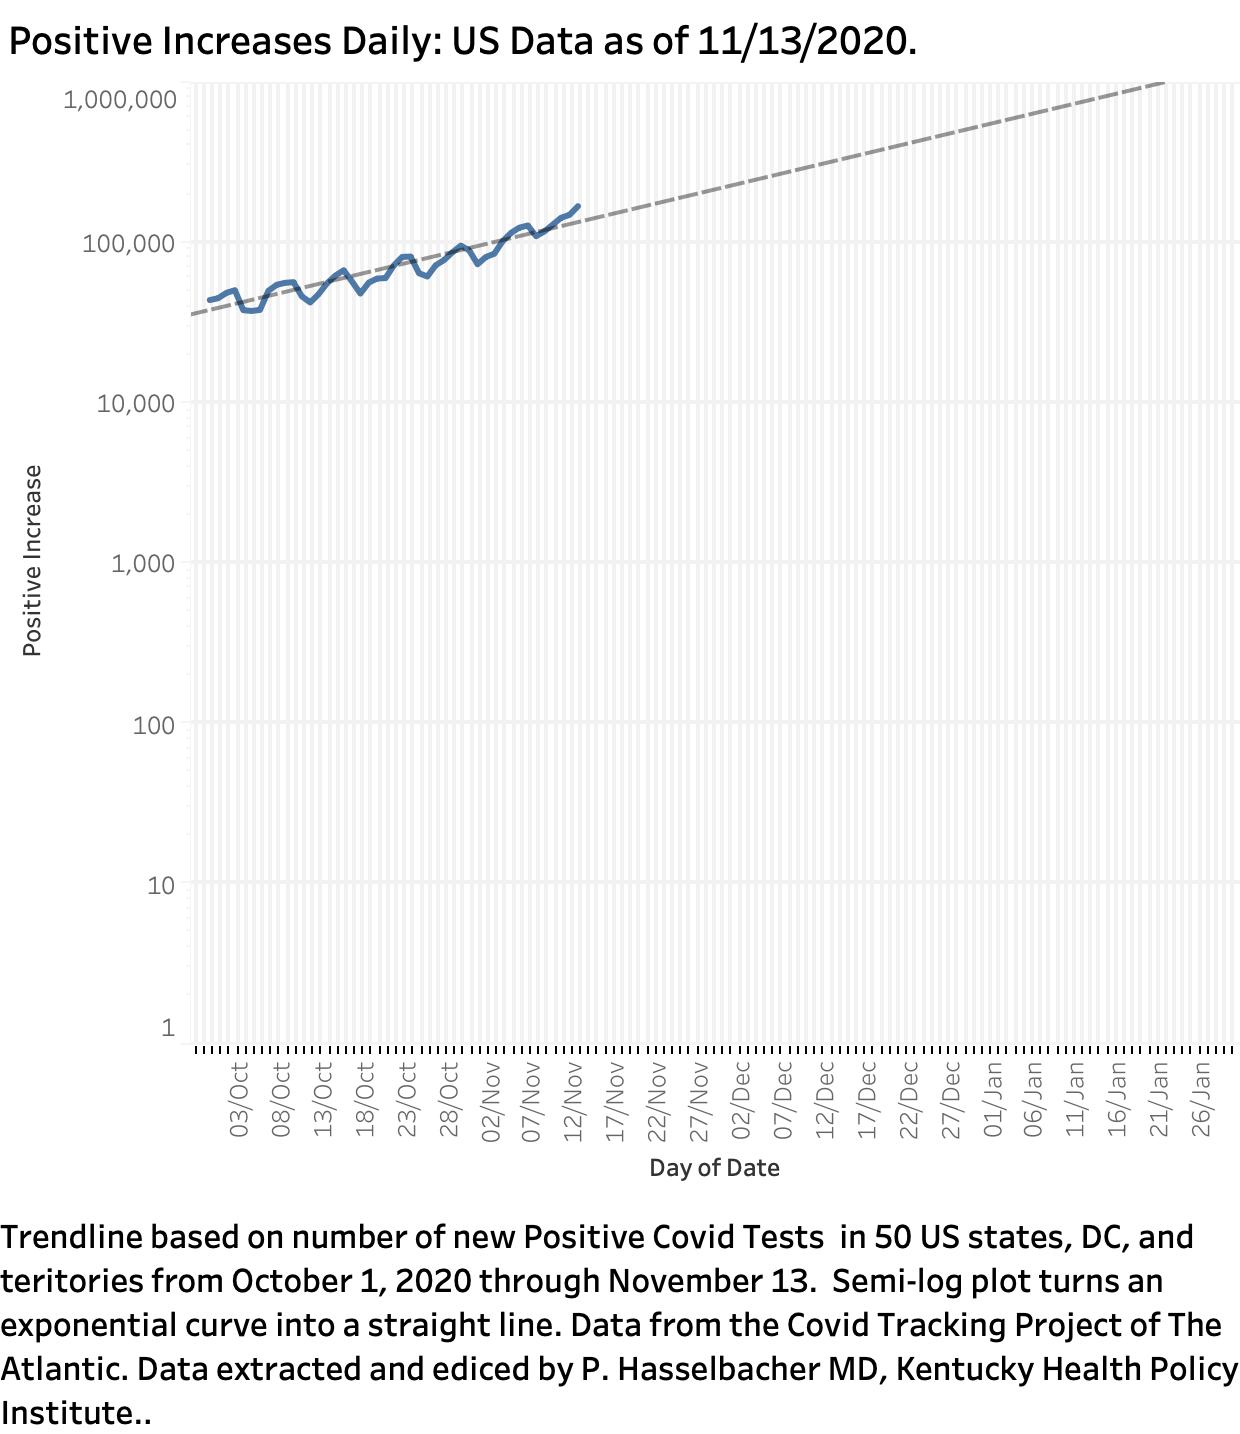
I downloaded Covid-19 historical data for all the US states and territories from the Covid Tracking Project and plotted the increase in daily positive tests (a proxy for new cases) in the same manner above that used Kentucky’s home-grown data. Nationally, new positives rose from 45,481 on Oct 1 to 170,333 on November 13. The trendline based on these dates indicates that positives have been doubling every 24 days. At this rate of accelerating growth, the US will hit 200,000 positives per day by November 28, and 500,000 by December 28. If only the surging data beginning November 1 are used (74,051 positives), the doubling time drops to 2 weeks, and we hit 500,000 positives by Dec 7.
Where do we go from here?
I wish I knew. The Covid brand of Lysenkoism that evolved in our current American political climate has not been healthy for us. Lysenkoism is a political strategy that arose (or at least was named) under Stalin in Communist Russia. To quote Wikipedia, ” it has come to be identified as any deliberate distortion of scientific facts or theories for purposes that are deemed politically, religiously or socially desirable.”
When applied to agricultural practices in Russia and China, the making-up or denial of scientific facts to suit a tyrant government led to widespread famine and death. There was a terrible price paid for rejecting evolution and plant science. (The term is now used for areas other than agricultural science.) Although there have been elements of science-denial in previous American government institutions (and Americans), it is patently obvious that flagrant Lysenkoism has been a general guiding principal for the current White House, and specifically for dealing with Coronavirus. In Russia and in the Chinese Great Leap Forward, Lysenkoism sent scientists and other educated persons to gulags or otherwise to their deaths. To say that such things could never happen in America remains to be examined by history.
I would really like to be optimistic and say that we will all buckle down and minimize the damage to both our psyches and pocketbooks. However, with a Kentucky Republican legislature, an Attorney General, some judges, and a large segment of Kentucky’s population content to let them try their darndest to reverse a Democratic Governor’s application of proven public health measures, I believe we have not yet seen our darkest days.
Hope?
One glimmer of distant hope may remain. Given the emerging multistate explosions of Covid-19 cases around the country, even previously hands-off governors and governments are issuing new restrictions that Kentucky has been using for some time. One can only pretend for so long that there is nothing that can be done to mitigate this disaster. Hopefully any holdouts will listen to Ohio Governor Mike DeWine who was quoted last week in the WSJ about protecting both the economy and beating the virus: “We made a mistake when we talk about these two things separately” as he imposed stricter mask wearing requirements. “Customers confidence that they can go out and be safe is entirely related to how bad the virus is in their community.” Perhaps it will no longer be acceptable in any form to stand by and let bad things happen without a defendable plan to mitigate the damage. A combination of leadership, education, and a judicious modicum of enforcement is in order.
“Girl, ya gotta love your man
Take him by the hand
Make him understand
The world on you depends
Our life will never end”
Peter Hasselbacher, MD
Emeritus Professor of Medicine, UofL
15 November 2020