
I want to use this post to explore enhancements to Medicare’s Part-D drug utilization-and-cost files using Insulin as an example. I have previously dissected the public use files released by the Centers for Medicare and Medicaid Services (CMS) to explore a number of health policy issues. These included utilization and cost of medical services by hospitals and other providers; quality and safety issues related to hospitals; the overall monstrous rises in prices of generic and other drugs; and prescribing patterns of opioids by individual practitioners. Other analyses examined insulin utilization and cost for Medicare and Medicaid beneficiaries. The rapid (and large) increases in the price of insulin are exemplars of the gut-punch impact of drug prices on individuals and our healthcare system. Drug companies have diabetics and their public and private payers over a barrel. Large numbers of patients with diabetes need the drug to keep them healthy if not alive. In mid-2016, CMS updated and standardized their Medicare Part-D databases making them comparable for the three initial calendar years of 2013 through 2015. I took this opportunity to take another look at Insulin. Although only some 70% of all Medicare beneficiaries are enrolled in Part-D Drug benefit programs, I suggest that prescribing patterns to these Medicare beneficiaries are not very different than those for non-Medicare adult patients and can be generalized. To make the initial data available to some new colleagues and simply just to get a start somewhere, I placed my first peeks into the enhanced Medicare databases on my Tableau Public Site in three sets of interactive tables and visualizations individually for 2013, 2014, and 2015.
The simple table below gives an overview. (Click to enlarge.)
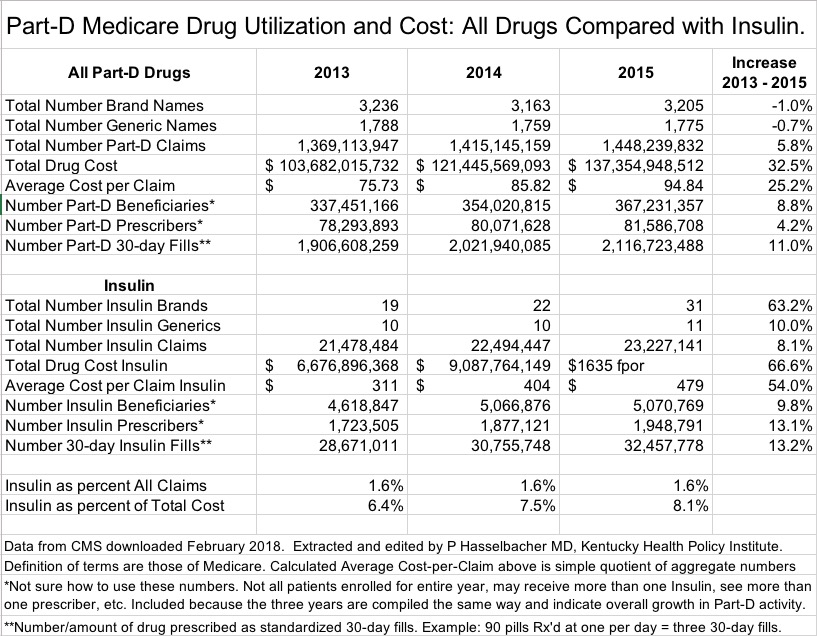 Summary of Part-D and its Insulins.
The Part-D program itself grew in volume and cost from 2013 to 2015. The Number of Claims for all drugs (defined as prescriptions and refills) and corresponding Total Drug Cost increased by 5.8% and 32.5% respectively. Note that for all Part-D covered drugs, Total Drug Cost (defined as all amounts paid by Medicare, the patient, secondary insurers, and other sources) increased much more than Claims! For all Insulins alone, these figures were 8.1% and 66.6% respectively. It is clear that consumer complaints about exorbitant increases in the prices of insulin do not exist in their imagination. [Doesn’t it make your blood boil? It does mine.]
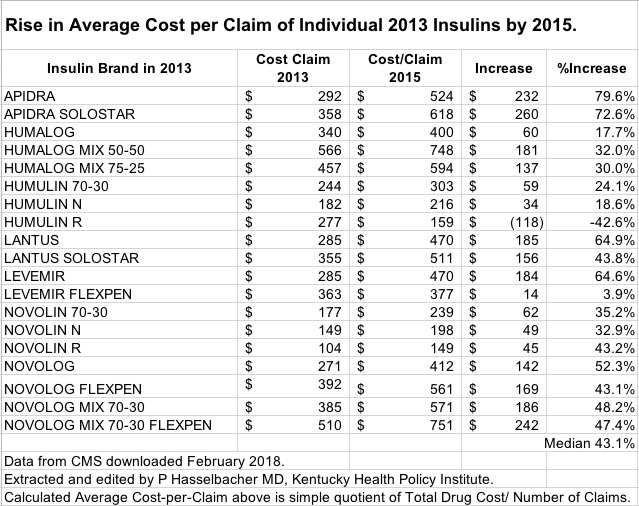
The cost of Insulin to the Medicare program is frankly staggering. While the per cent of all Part-D drug Claims that were for Insulin remained relatively constant at 1.6% across the three years, the percent of Total Part-D Drug Cost spent on Insulin rose from 6.4% to 8.1%. In 2015, $11.1 billion was spent for this patient population by patients who use Insulin– $4.3 billion for a single brand name. In further analyses I will try to tease out the major drivers for the increased share of our collective treasure spent on Insulin. Probably a contributing factor was that in 2015, there were 12 more branded versions of Insulin available than there were in 2003. At least three of these had a cost-per-claim of over $1000 including one for $1635 per prescription. The rapid rise in total cost of insulins has to have been driven in large part by high-priced, high-volume brands such as Lantus, the most frequently prescribed insulin whose cost per claim rose 65% from 2013 to 2015.
Is the most expensive Insulin always better?
I have no opinion about whether one brand or chemical modification of Insulin is better overall or for subsets of patients, but I do suspect some potential differences are minor. What I can do is examine the insulin-prescribing profiles of practitioners in differing specialties, in different geographic localities, or as categorized by one of the many new identifiers in the databases. If there is a standard of care, that should show up broadly. However, I still expect to find wide variations in how Insulin is used. Such differences can provide clues about how to spend our resources more wisely.
How would you make this purchase for shampoo?
What if the most expensive insulins are not all that much better– if at all? I did a back-of-the-envelope calculation to show the premium we all pay for our anything-goes mindset. In 2015, Medicare spent $11.1 billion on 31 different branded Insulin product variations with a wide range of Cost-per-Claim ranging from $149 for Novolin-R, up to $1635 for Humulin R U-500. If Novolin-R was the only brand available and at the same cost, Part-D patients their insurers would have paid only $3.5 billion. The $7.7 billion savings (a 55% decrease) would be available for something else! In this regard [and curiously], according to Medicare’s database for 2015, only a single insulin had its cost decrease. The cost per claim of Humulin-R had its price-per-claim decrease by 43%. Something is going on here that I am currently unaware of. If this is not an error in the data or my analysis, why not use more Humulin-R? Let’s hear from knowledgeable people out there. Surely such value judgements can ethically be made across the wide spectrum of drugs on the market.
Surely these double-digit percent increases over a short time as exemplified for Insulin are a cause for concern. I am personally unaware of any rational explanation for the price increases in Insulin other than that its manufacturers are charging as much as they think they can get away with on the backs of dependent populations of individuals with diabetes. I would like to be kinder to the pharmaceutical industry and my government, but their business models are incompatible with my understanding of medical ethics or social justice. The extortionist shenanigans of at least some in the pharmaceutical industry have had so far the passive support of the people we elect to our state and local governments who seem to pass the best laws that money can buy. A few hearings and indignant comments may give them political cover but are simply inadequate to protect the public. Do guns and drugs really run the show?
A few comments about the enhanced databases.
The main database is enormous. It contains one row of data for each and every individual brand or generic drug prescribed by every unique individual prescriber in the United States, Washington DC, Puerto Rico, and other territories. Each of these 24+ million rows of data has 84 different fields containing a variety of demographic information about prescriber and patient; race, gender, and age of patients; severity of illness; proxies for socioeconomic status; generic vs. brand names; and specific counts of certain categories of drugs such as opioids, antibiotics, anti-psychotic drugs, and the like. Simple desktop programs like Excel cannot handle all this at once. Medicare provides certain derivative summary tables for individual states, prescribers, or drugs, but these do not contain the granular detail of the main file.
Anyone who works with this kind of data knows that derivative conclusions based on such are no better than the quality of the information itself, including the process and definitions underlying its compilation. For the Part-D databases, these are complex. For example, the data above undoubtedly contains prescription drug events for people who were not enrolled in Part-D or prescribed insulin for an entire year; who may have seen multiple doctors; or were taking more than one brand of Insulin. Thus, a given “unique” beneficiary may be tallied for more than one Insulin. Given the opaqueness of our pricing and reimbursement structure for drugs, care must be taken in the interpretation of Total Drug Costs. Medicare admits that it has no information about drug rebates that might be given to pharmacy benefit managers or insurers. Regardless of how the value of calculated cost-per-claim as used above compares to retail price or cost to an individual user, I’m pretty comfortable asserting that the cost of insulin (and many other drugs) is out of control. The market does not work when somebody has a gun to your head.
Peter Hasselbacher, MD
President, KHPI
Emeritus Professor of Medicine, UofL
22 February 2018
I need your help.
This article is merely a start. Consider it a work in progress. It and its supporting tables are subject to updating. I ask for your expertise and help in suggesting what other drugs to look at, or what kind of comparisons or analysis I should attempt. As linked here and above, I placed breakdowns by year for insulin elsewhere on the web for your perusal. I will prepare an extract of the data for the Commonwealth of Kentucky that I think can be manipulated with Excel on the typical desktop computer. If I have made an error of fact or interpretation, please help me correct it. Contact me privately if you wish using the link in the BlogRoll
Sorry. There is a nonsense entry in the main table above for the Total Cost of Insulin in 2015. I do not know how that occurred and will fix it as soon as I can. The percent of all claims and cost for that year are correct.
Peter