190 Days into Kentucky’s Recognized Covid-19 Epidemic: Where are we headed now?

This had been a pivotal week for the Covid-19 epidemic in Kentucky, but the incomplete and delayed reporting for the days bracketing Labor Day leave us with insufficient information to predict with any confidence the direction Kentucky is going. Beginning with the simultaneous Memorial Day opening of our summer season and relaxing of public health restrictions which accelerated with the July openings of bars, stadiums, and further loosening of public health “recommendations;” Kentucky experienced a (predictable?) surge of cases and deaths that has not yet demonstrably turned the corner. Last week gave us both record or near record numbers of new cases, deaths, and even tests. Below is an abbreviated discussion of the results.

New cases plotted.
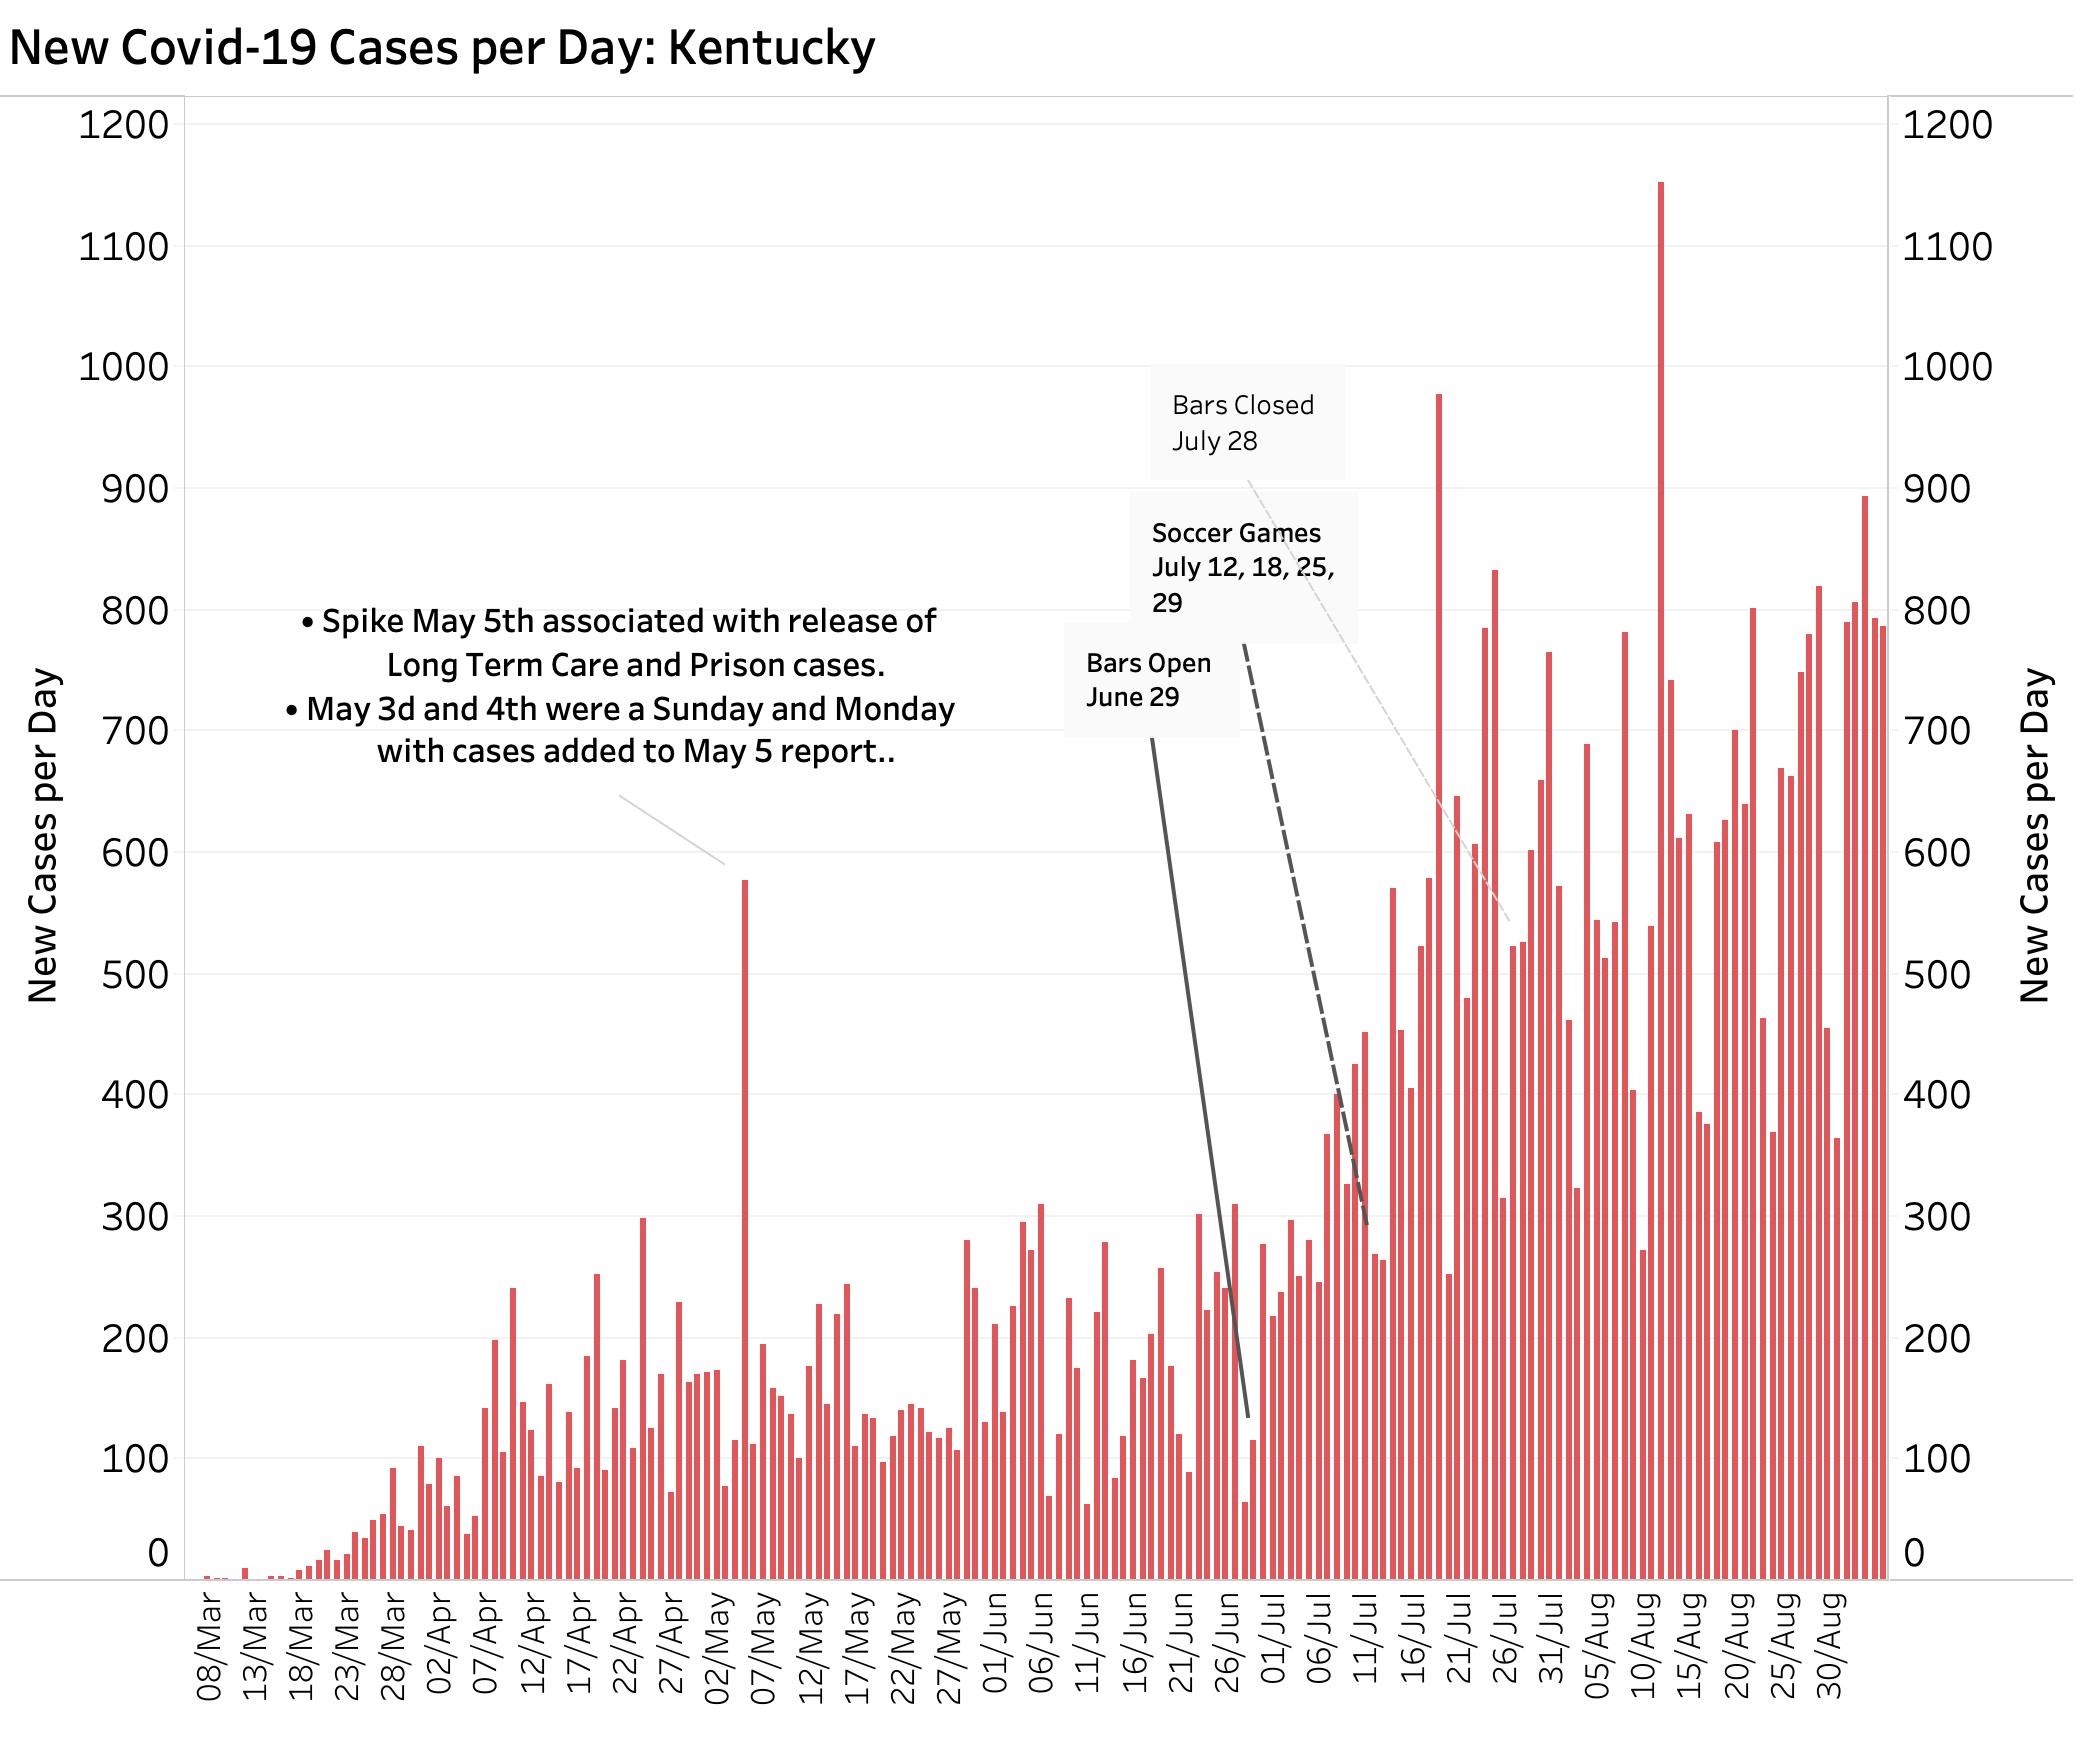
The bar graph below plots the raw daily count of new cases. The long three-day hiatus in reporting generated corresponding high catch-up reporting days through yesterday. The highly variable daily counts were too much even for the 7-day and 14-day rolling averages to smooth out. It will take another week of data to draw meaningful conclusions about where we are going. The September opening of schools, colleges, and related additional sporting events presents us with additional new challenges, as does the relative explosions of new cases in some non-urban Kentucky counties.

Continue reading “190 Days into Kentucky’s Recognized Covid-19 Epidemic: Where are we headed now?”

Last Week’s Kentucky Covid-19 Tracking Update: Not a good week!

We are in an upwardly creeping plateau even before the recent event-filled holiday week and school openings.

As had already been reported, both new cases and deaths during the week of August 30 through September 5 were the highest since Covid-19 arrived in Kentucky– even without the major outbreaks in prisons or long-term living facilities that boosted earlier bad weeks. Day-to-day variation of reported numbers due to lack of capture of data over the weekends grossly distorts epidemic curves, confounds the identification of trends, and reduces considerably the public health effectiveness of case identification and contact tracking. The resulting volatility is evident in the figure below. (See also the interactive data visualizations of all the figures below here.)

New daily Covid-19 cases in Kentucky through 9-5-20.
Continue reading “Last Week’s Kentucky Covid-19 Tracking Update: Not a good week!”

Covid-19 Tracking in Kentucky: Second Highest Weekly Total of New Cases Ever.

Turnaround not yet in sight. Cases exploding in smaller counties.

New Cases.
Last week’s (Sunday to Saturday, Aug 29) total number of new cases of Covid-19 was 4511, higher than either of the previous two weeks. The previous highest week (ending July 25 ) had a total of 4580 cases but probably included some as-yet unreported positive tests of the prior week. There is so much variation in the reported day-to-day numbers that it has been difficult to generate reliable predictive trends, but even following the abrupt surge of new cases that began in early July, the trend for both 7- and 14-day rolling averages can be perceived as worsening. The number of new cases is most certainly not going down. At our current rate of growth, the number of total cases is doubling every 34 days. Waiting in place for a better day will not serve us well! You can explore the interactive versions of the figures below and more at KHPI’s Tableau Public website.

Continue reading “Covid-19 Tracking in Kentucky: Second Highest Weekly Total of New Cases Ever.”

End-of-week Covid-19 Update: Waiting for the Turnaround.

Last week was not a good one in the Coronavirus department. For some of the smaller or more rural counties, the week was frankly terrible. Because of the highly variable day-to-day numbers of new cases reported, it is usually dicey to make predictions about what tomorrow will be like.  Even the use of 7-day averages does not “smooth out the curve” as much as one might like. Some analysists are shifting to 14-day averages for this reason.  Looking at weekly totals is one easily understandable  version of a 7-day average. It provides a rational and understandable way to minimize the distortions of using a 5- or 6-day work week to describe a 7-day virus. KHPI has been using a Sunday to Saturday weekly interval to aggregate data.  Last Saturday, August 22, closed out the most recent full week.  The results are displayed below.  (The full panel of fully updated interactive data visualizations remain available on the KHPI Tableau Public website.)

The following graphic displays the daily counts of new cases (less duplicates and the like) current through August 22d. New cases remain high, with both high and low days dwarfing the counts of the first 3 months of our epidemic.

Continue reading “End-of-week Covid-19 Update: Waiting for the Turnaround.”