Heading Into Covid Winter Flying Unfunded And Blind!

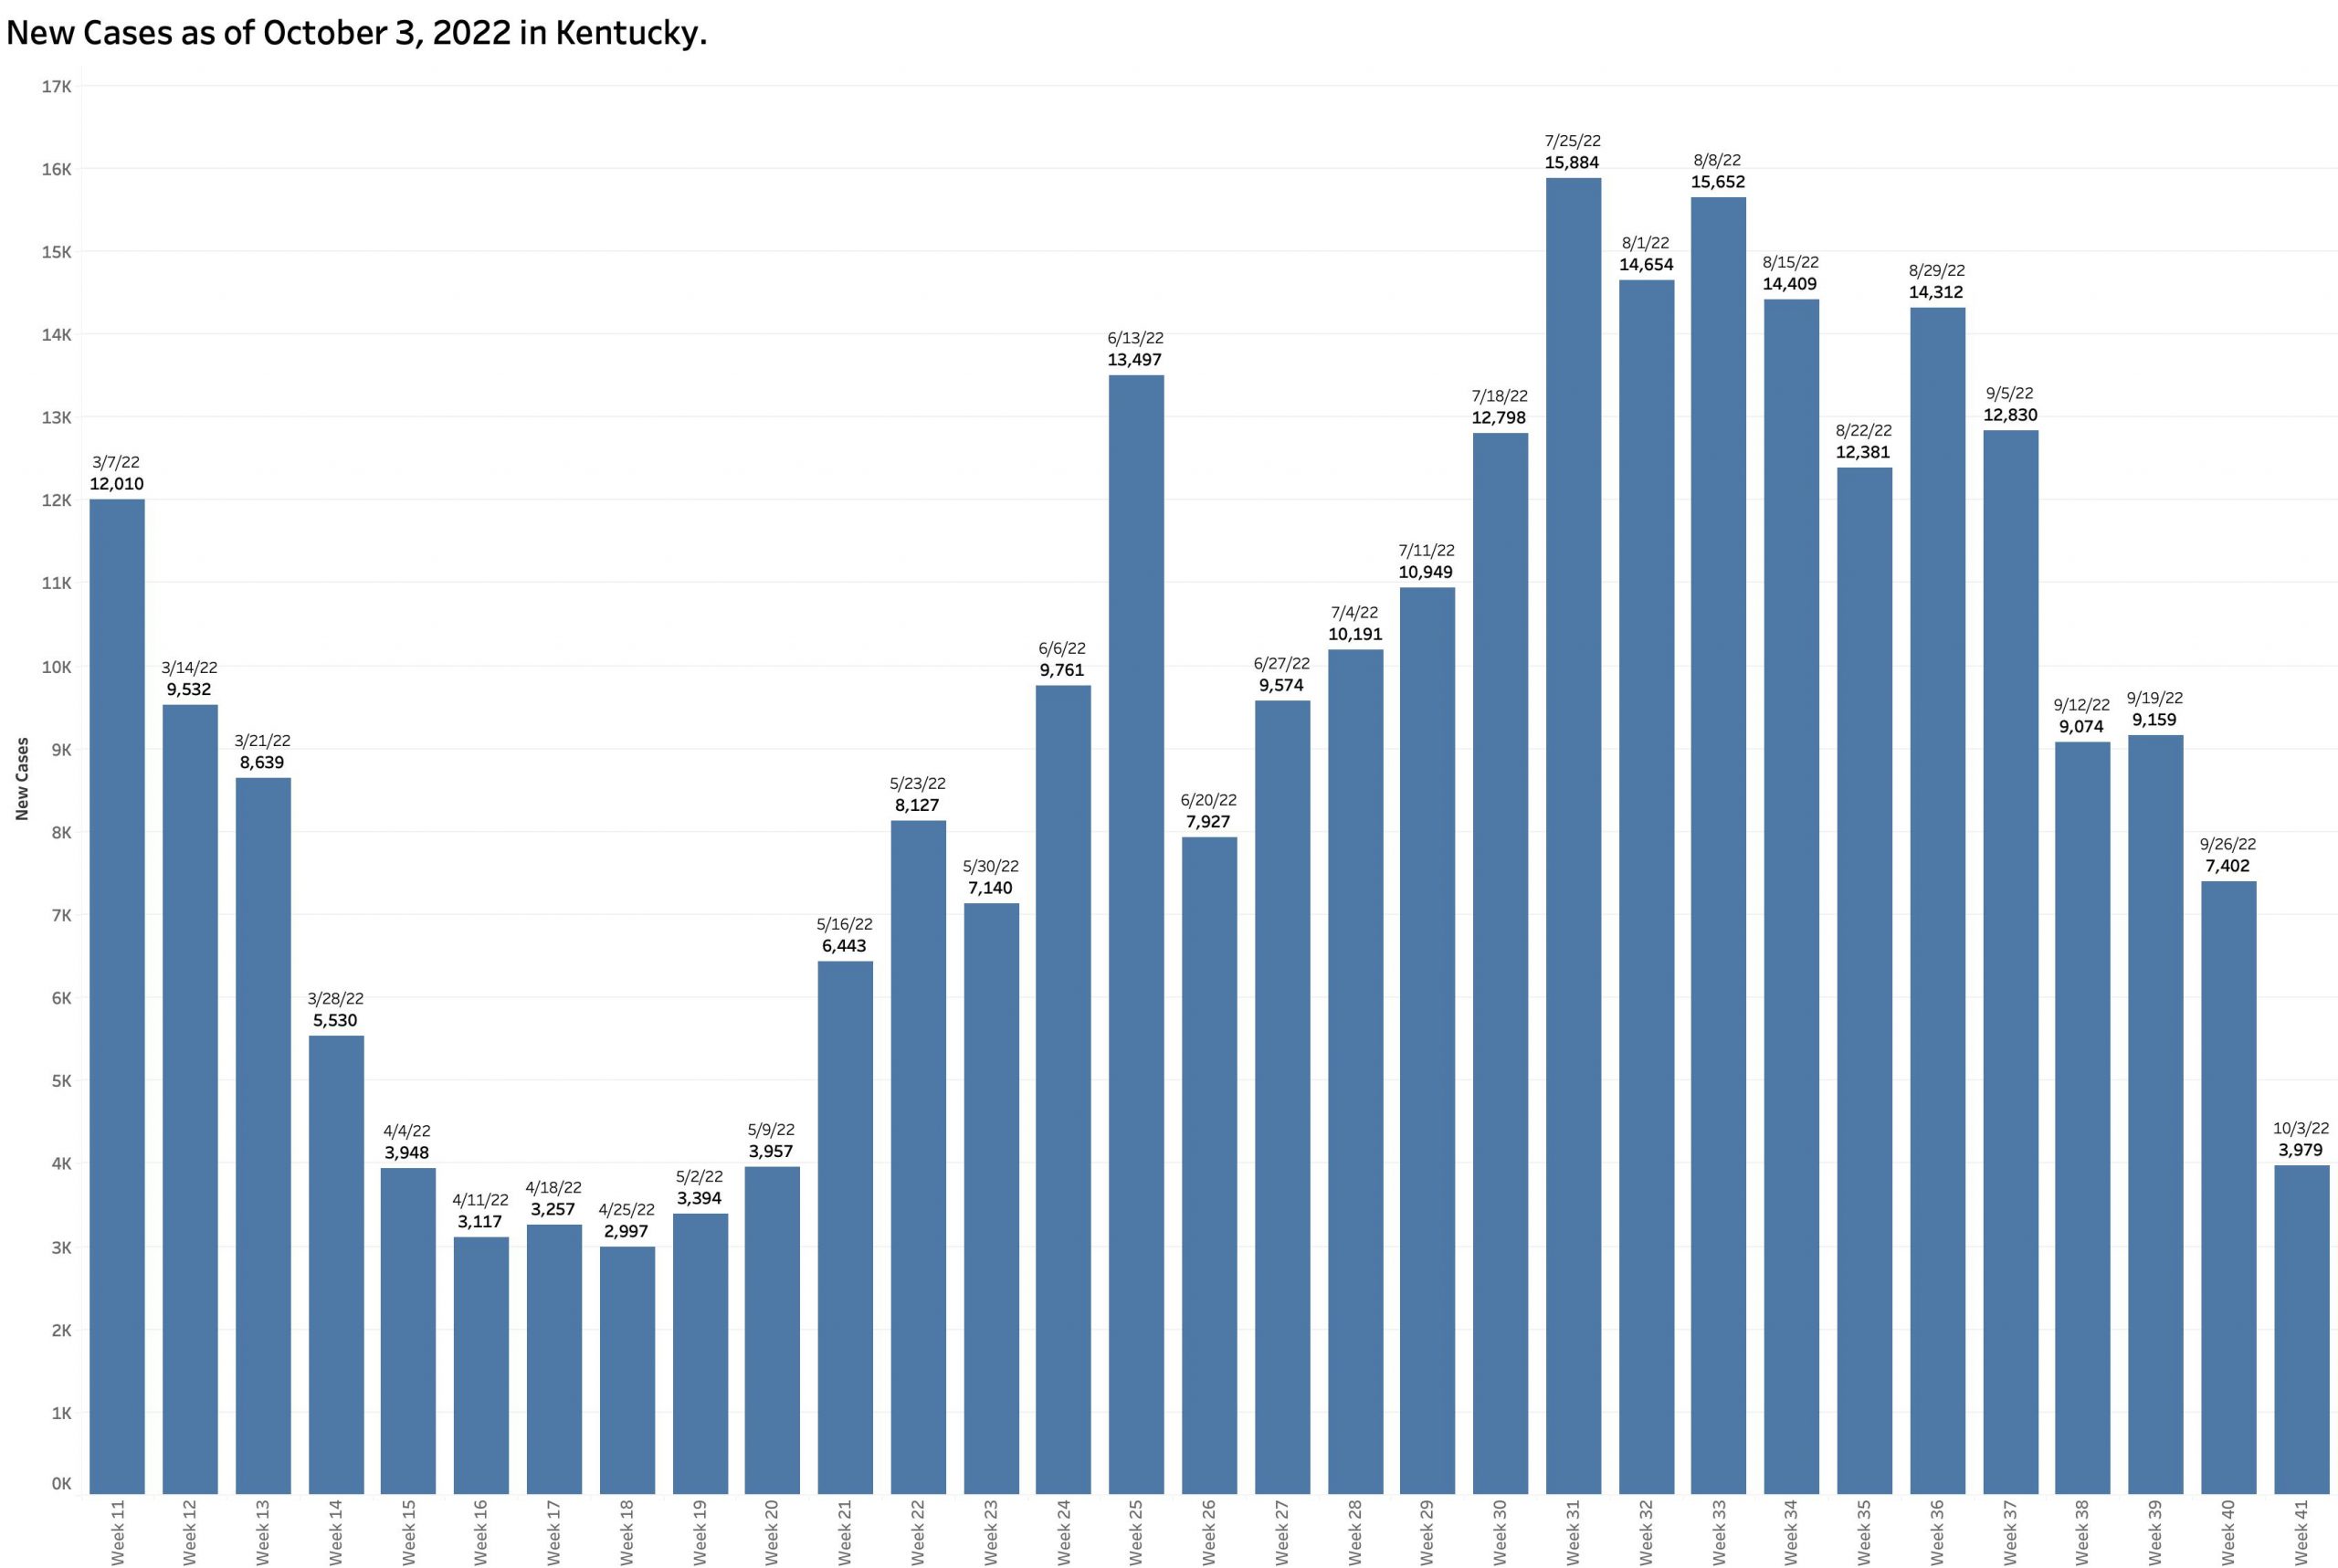
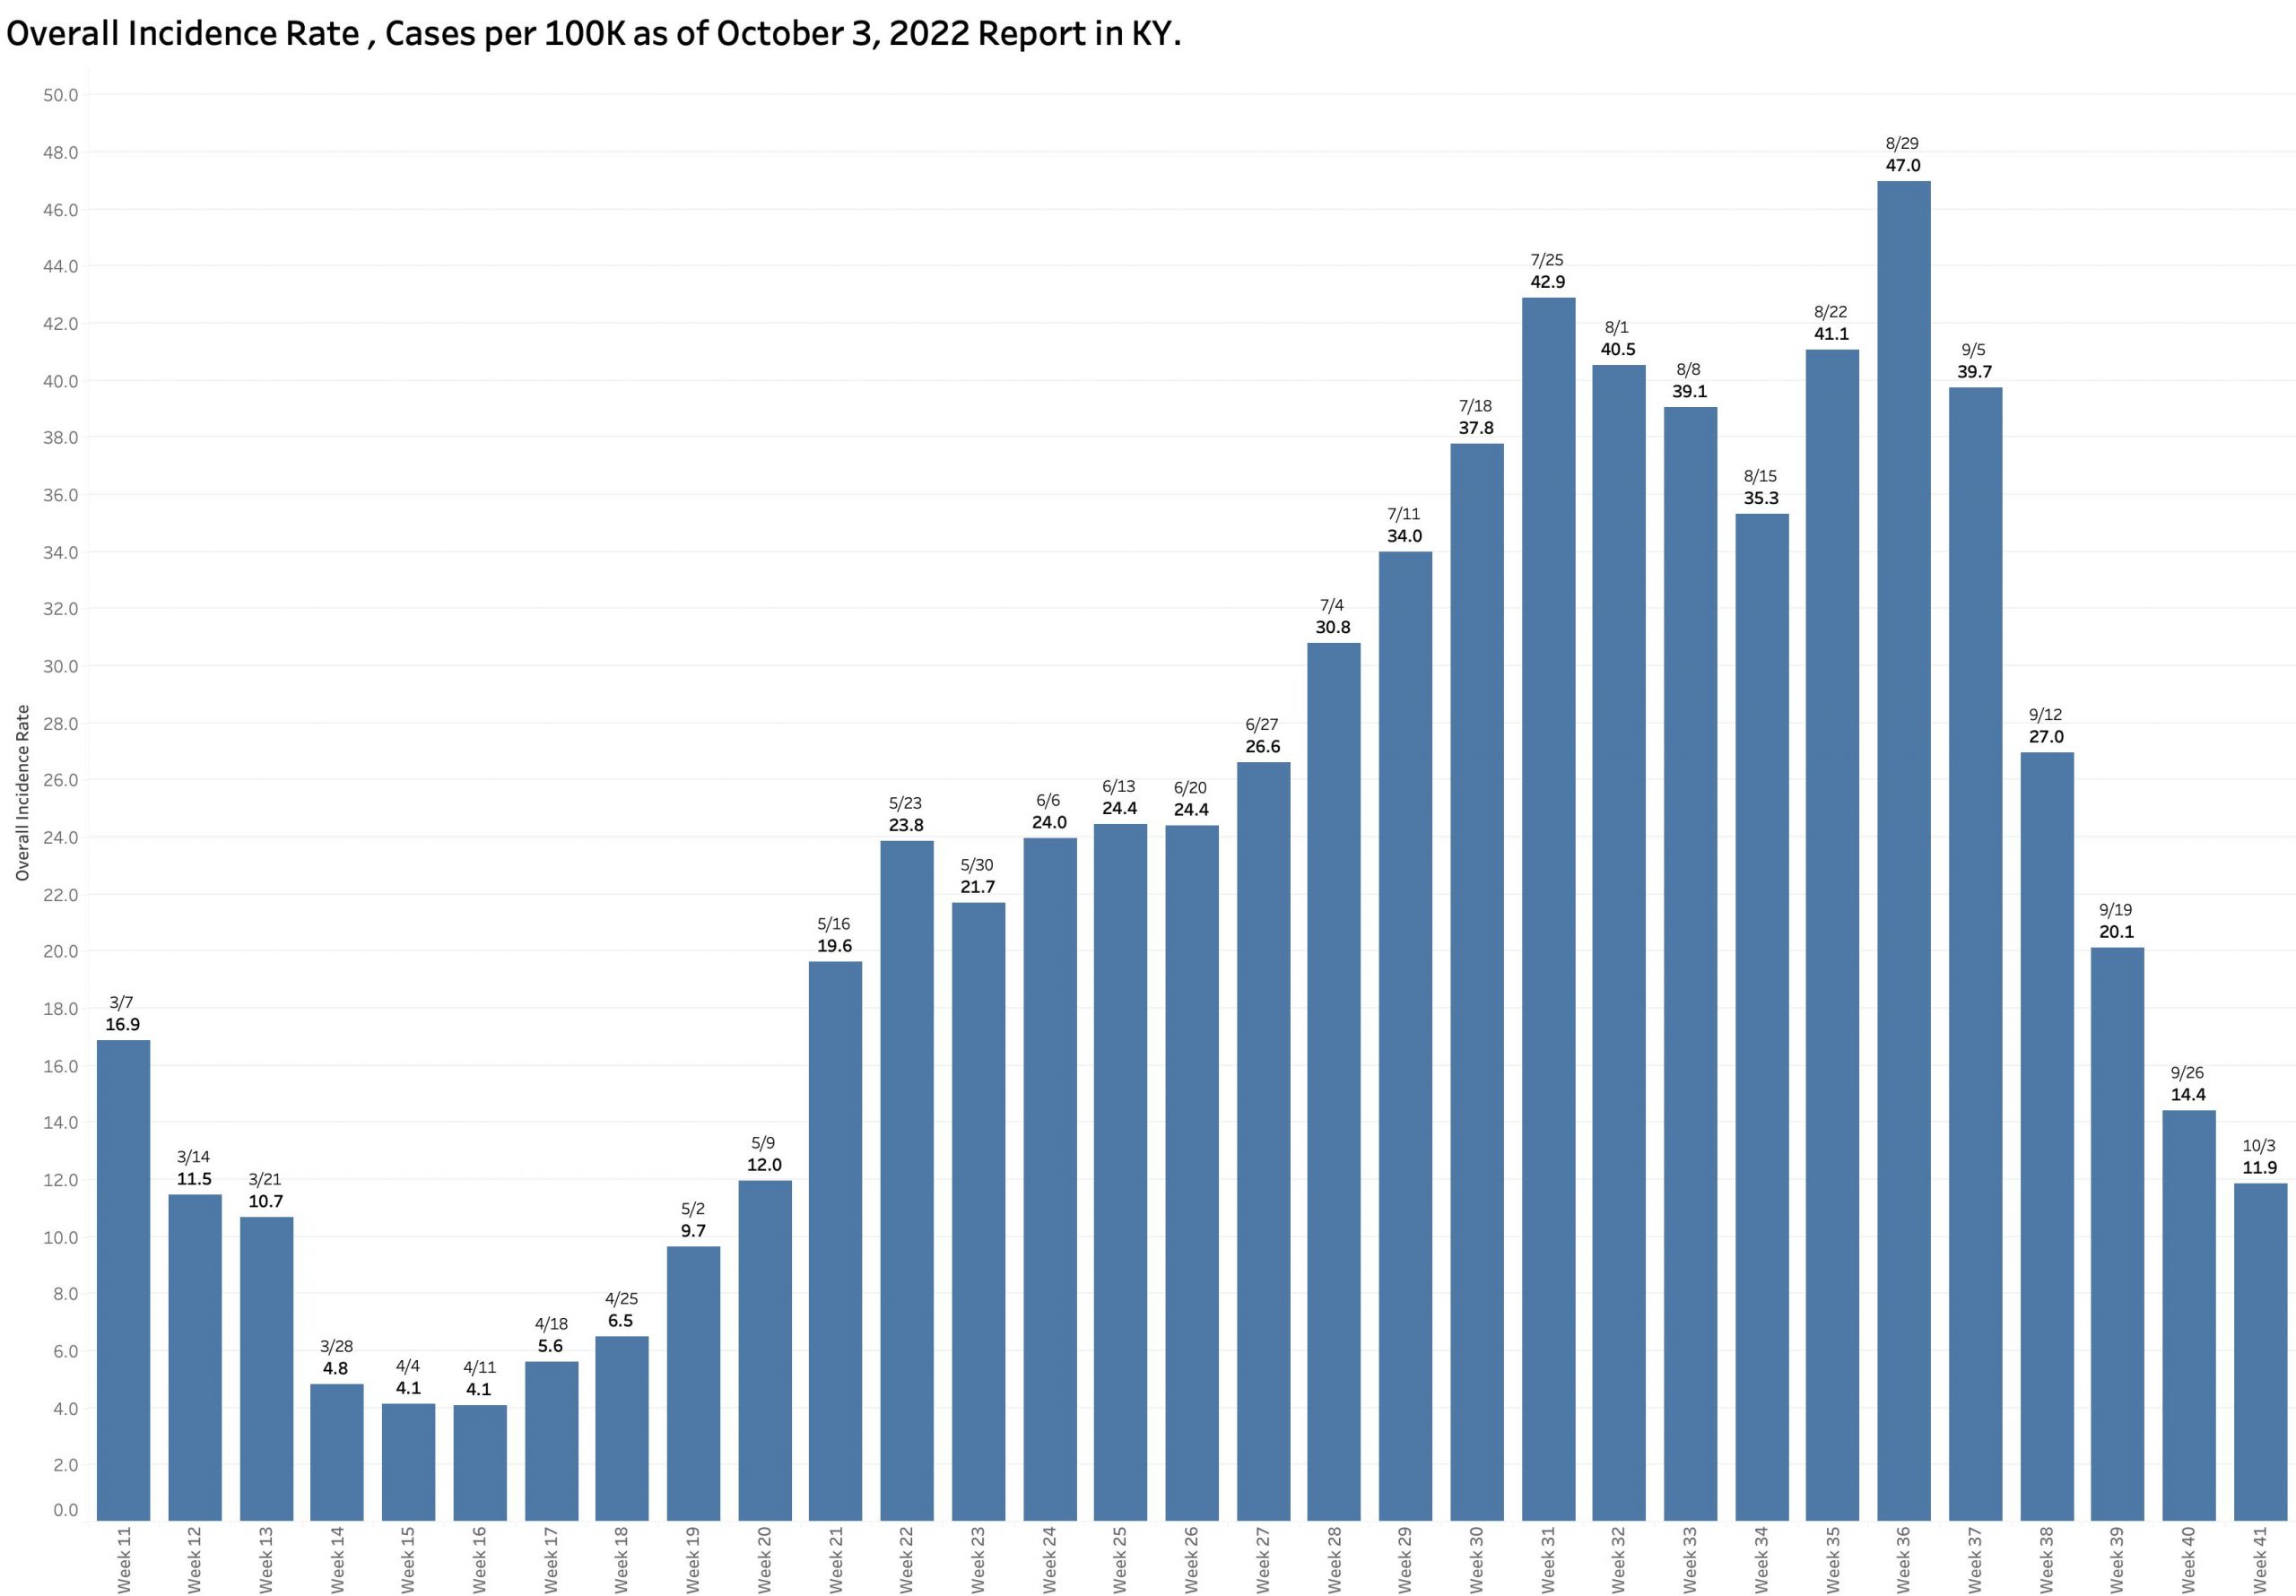
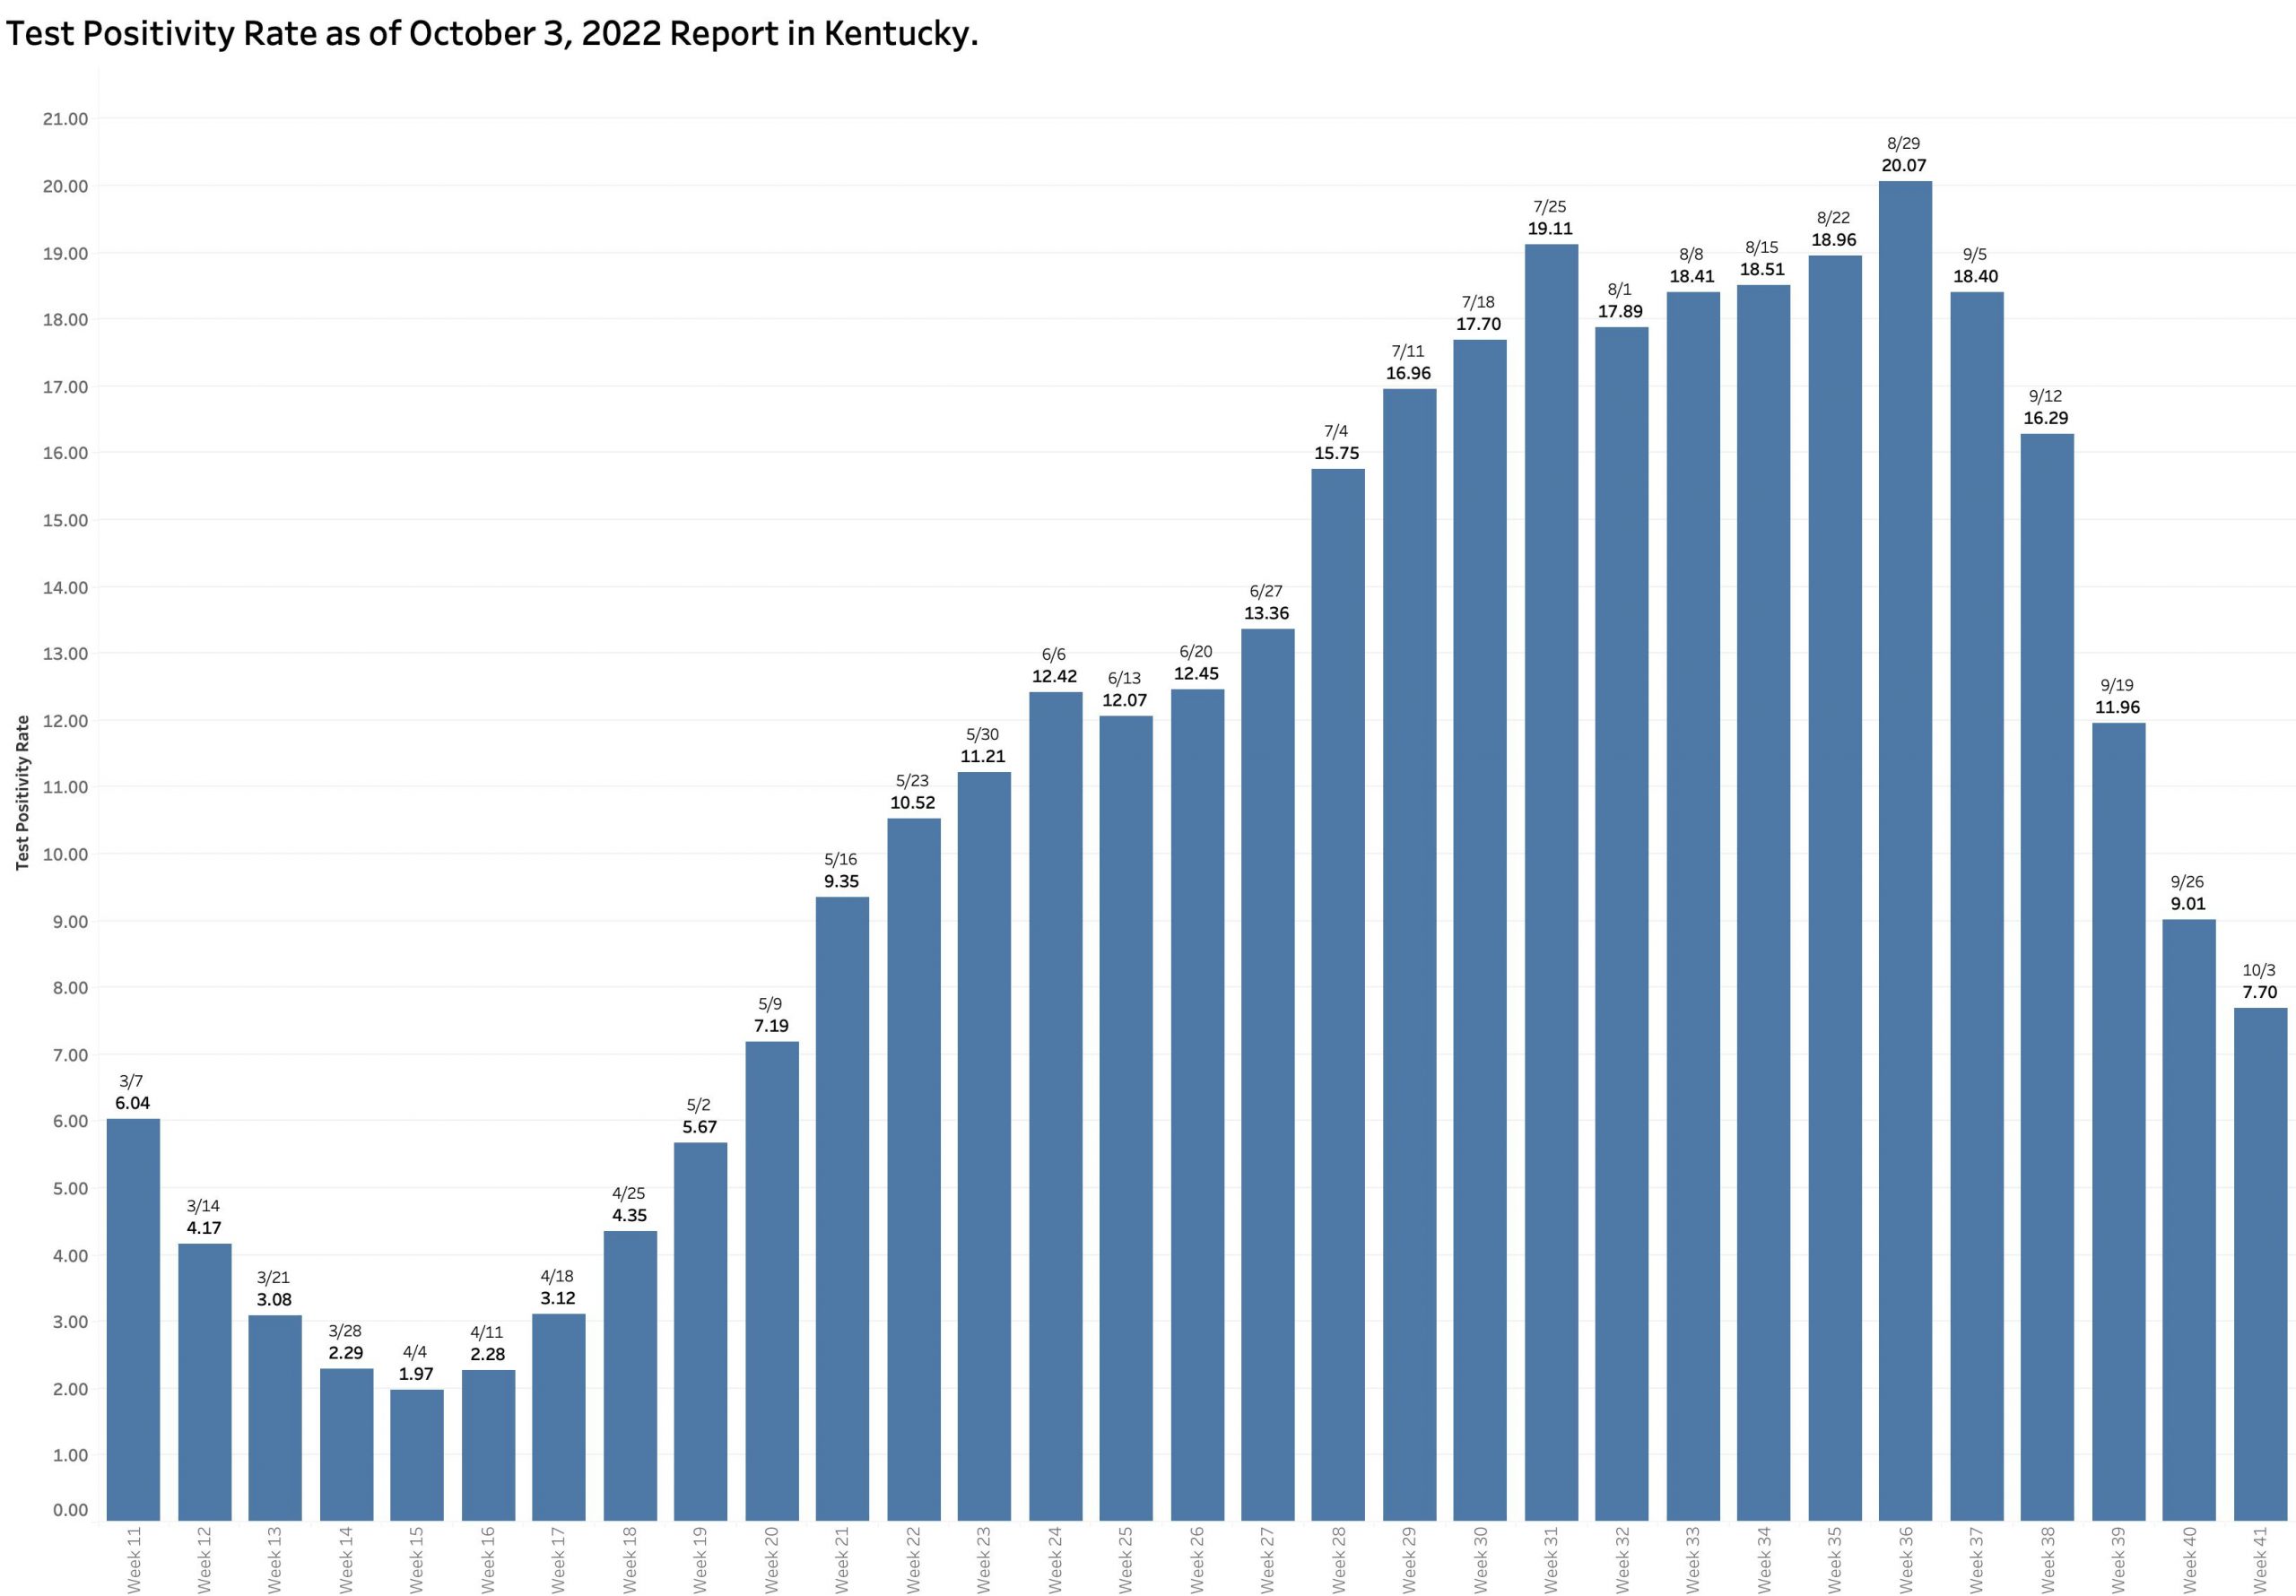
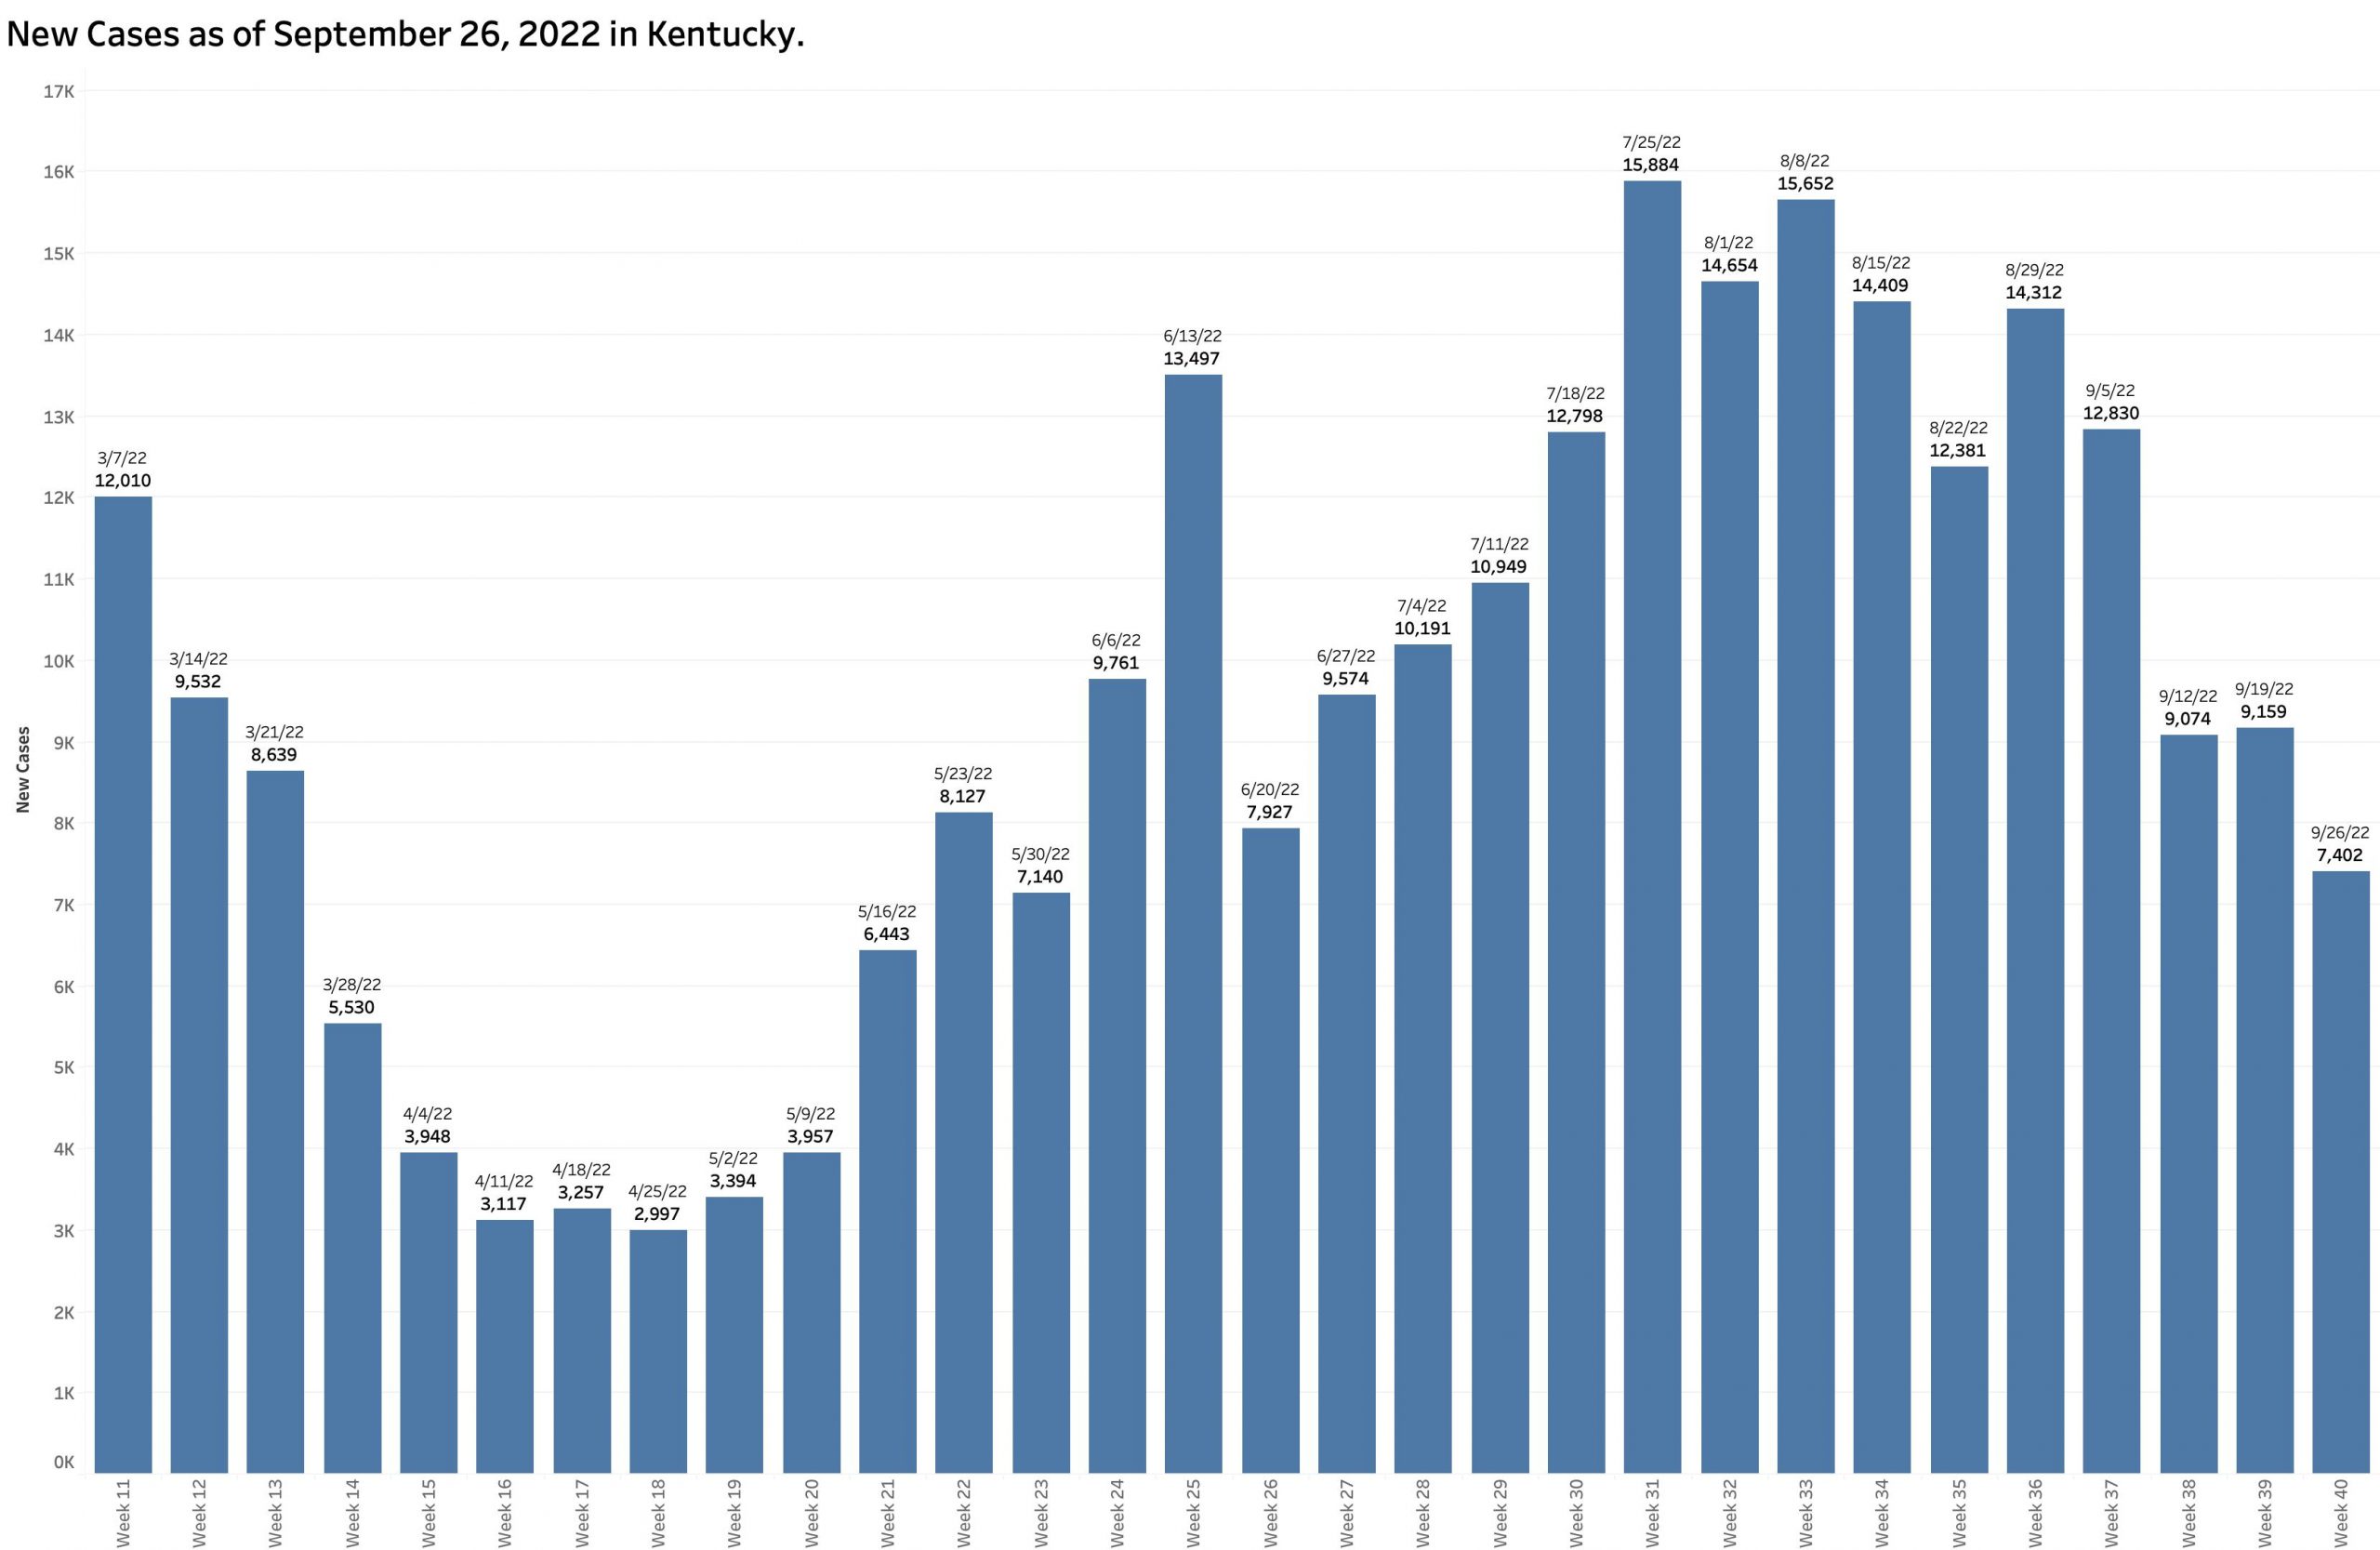
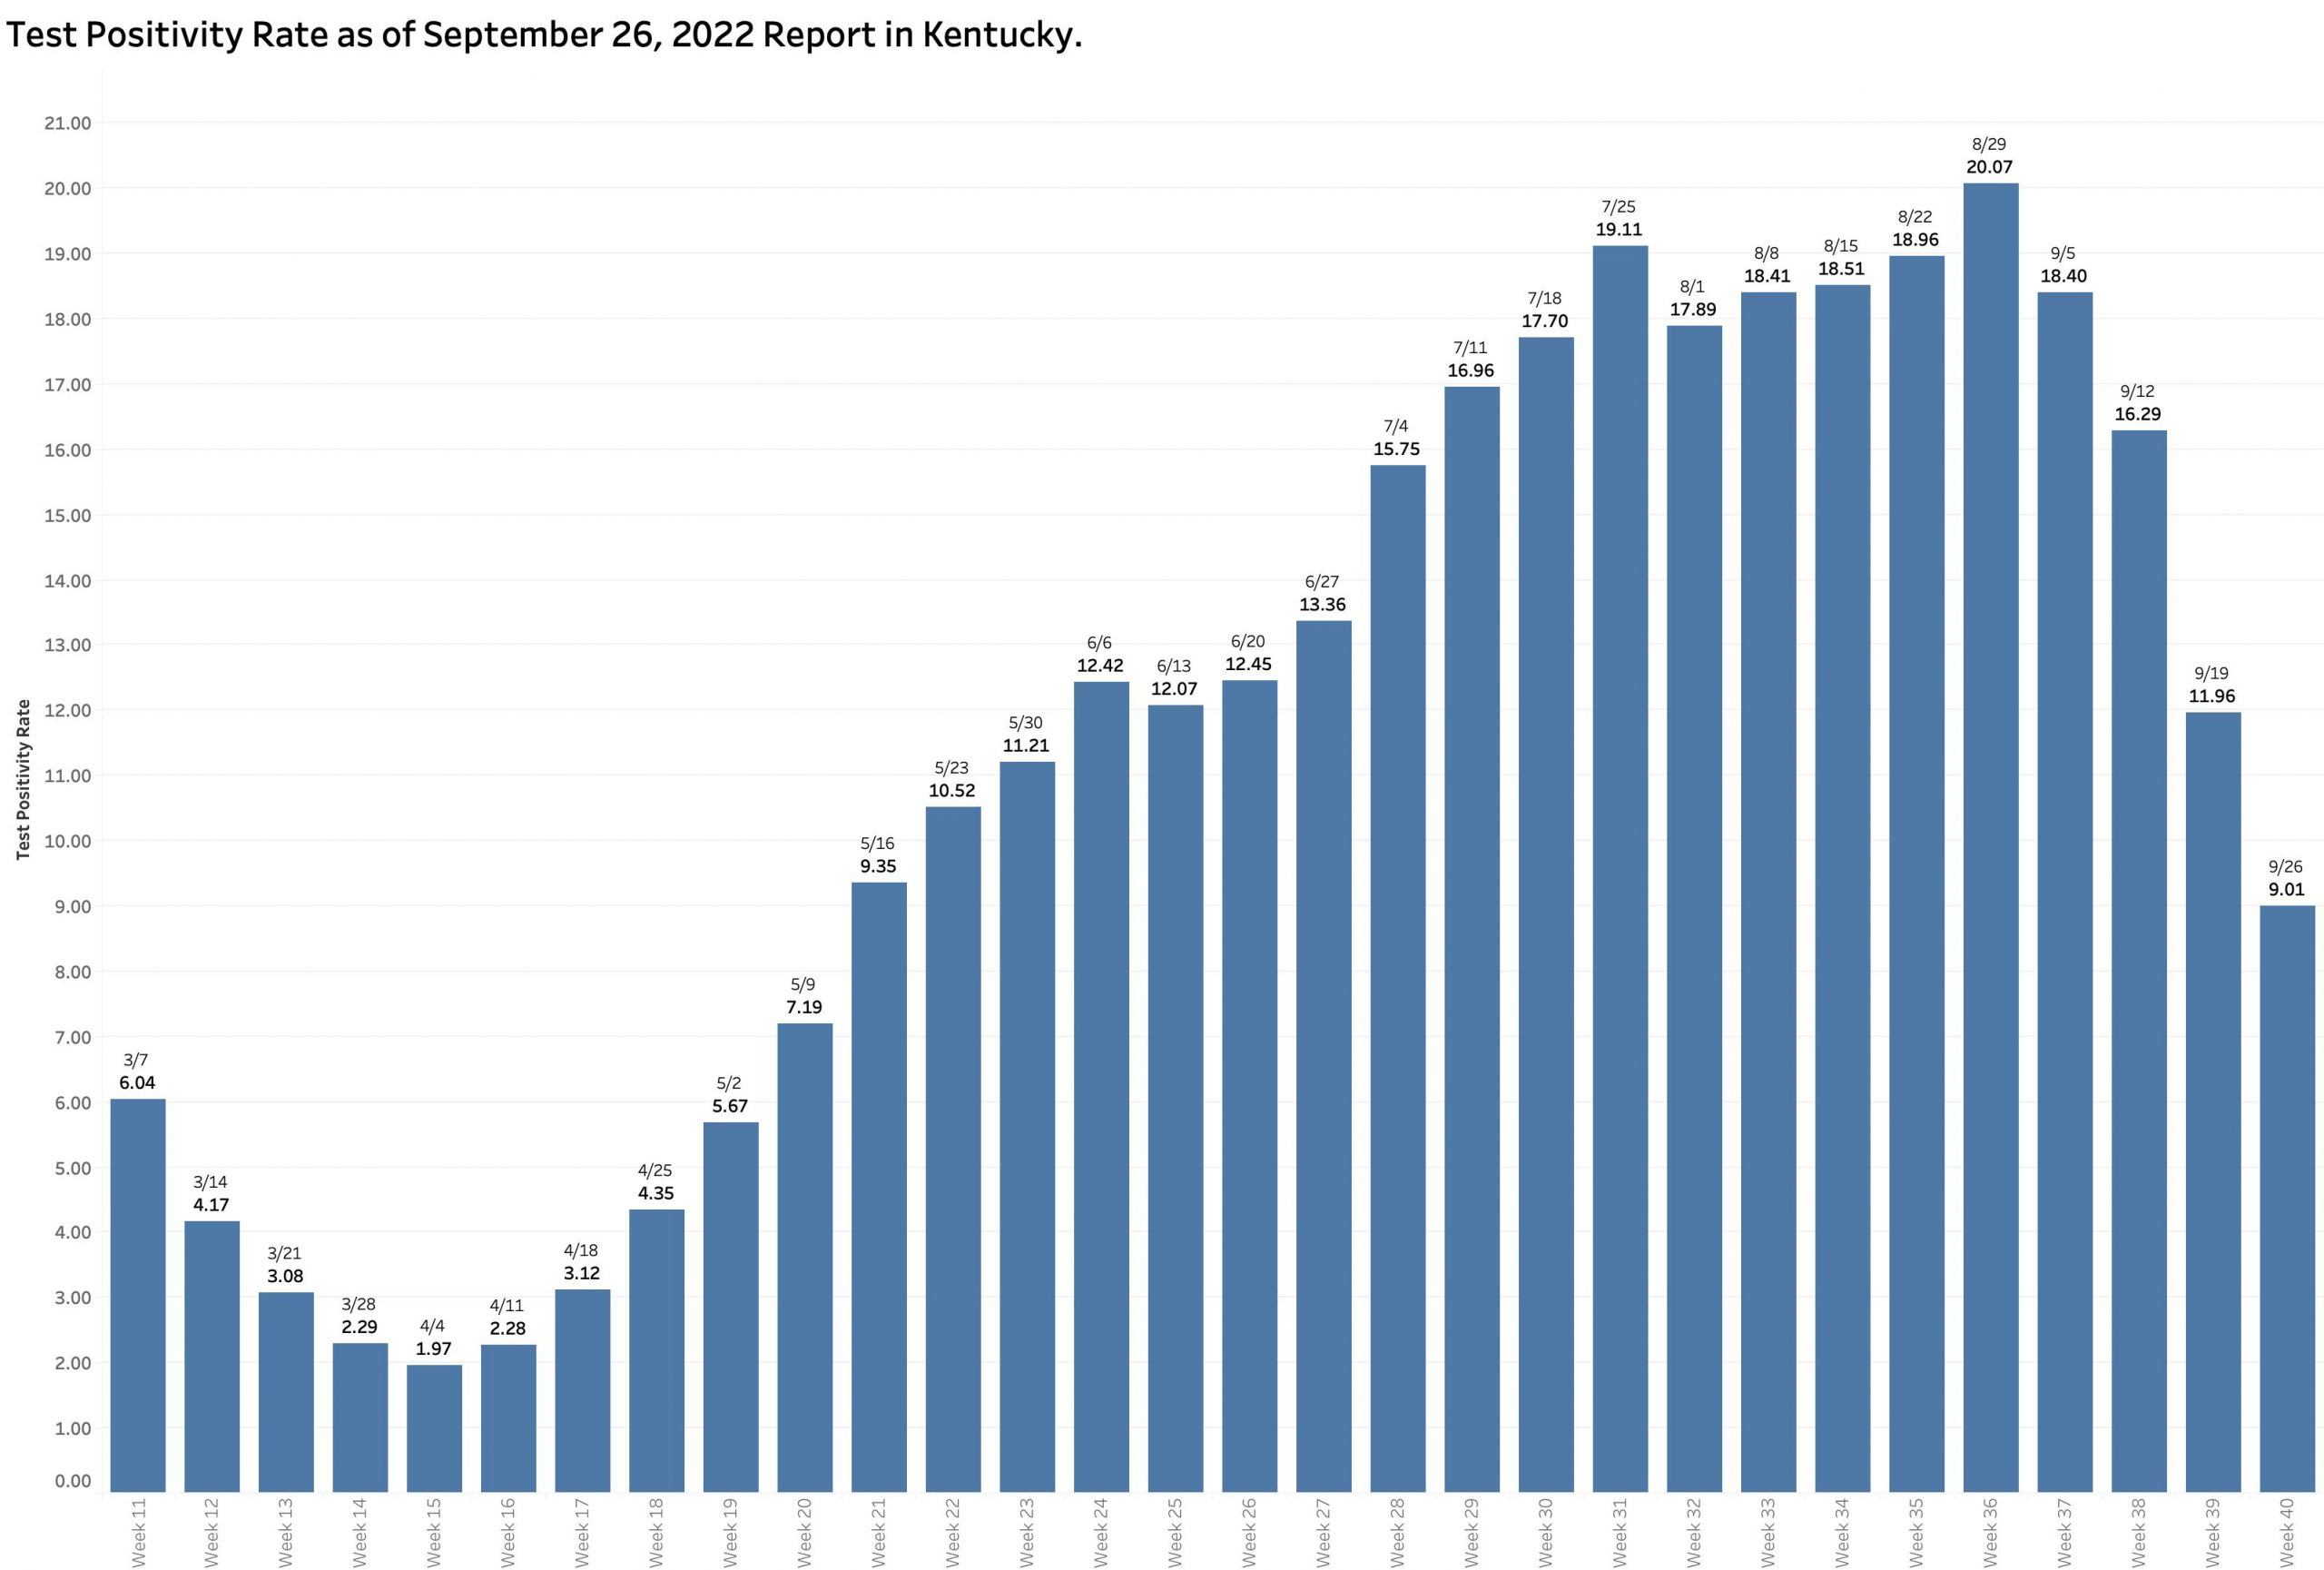
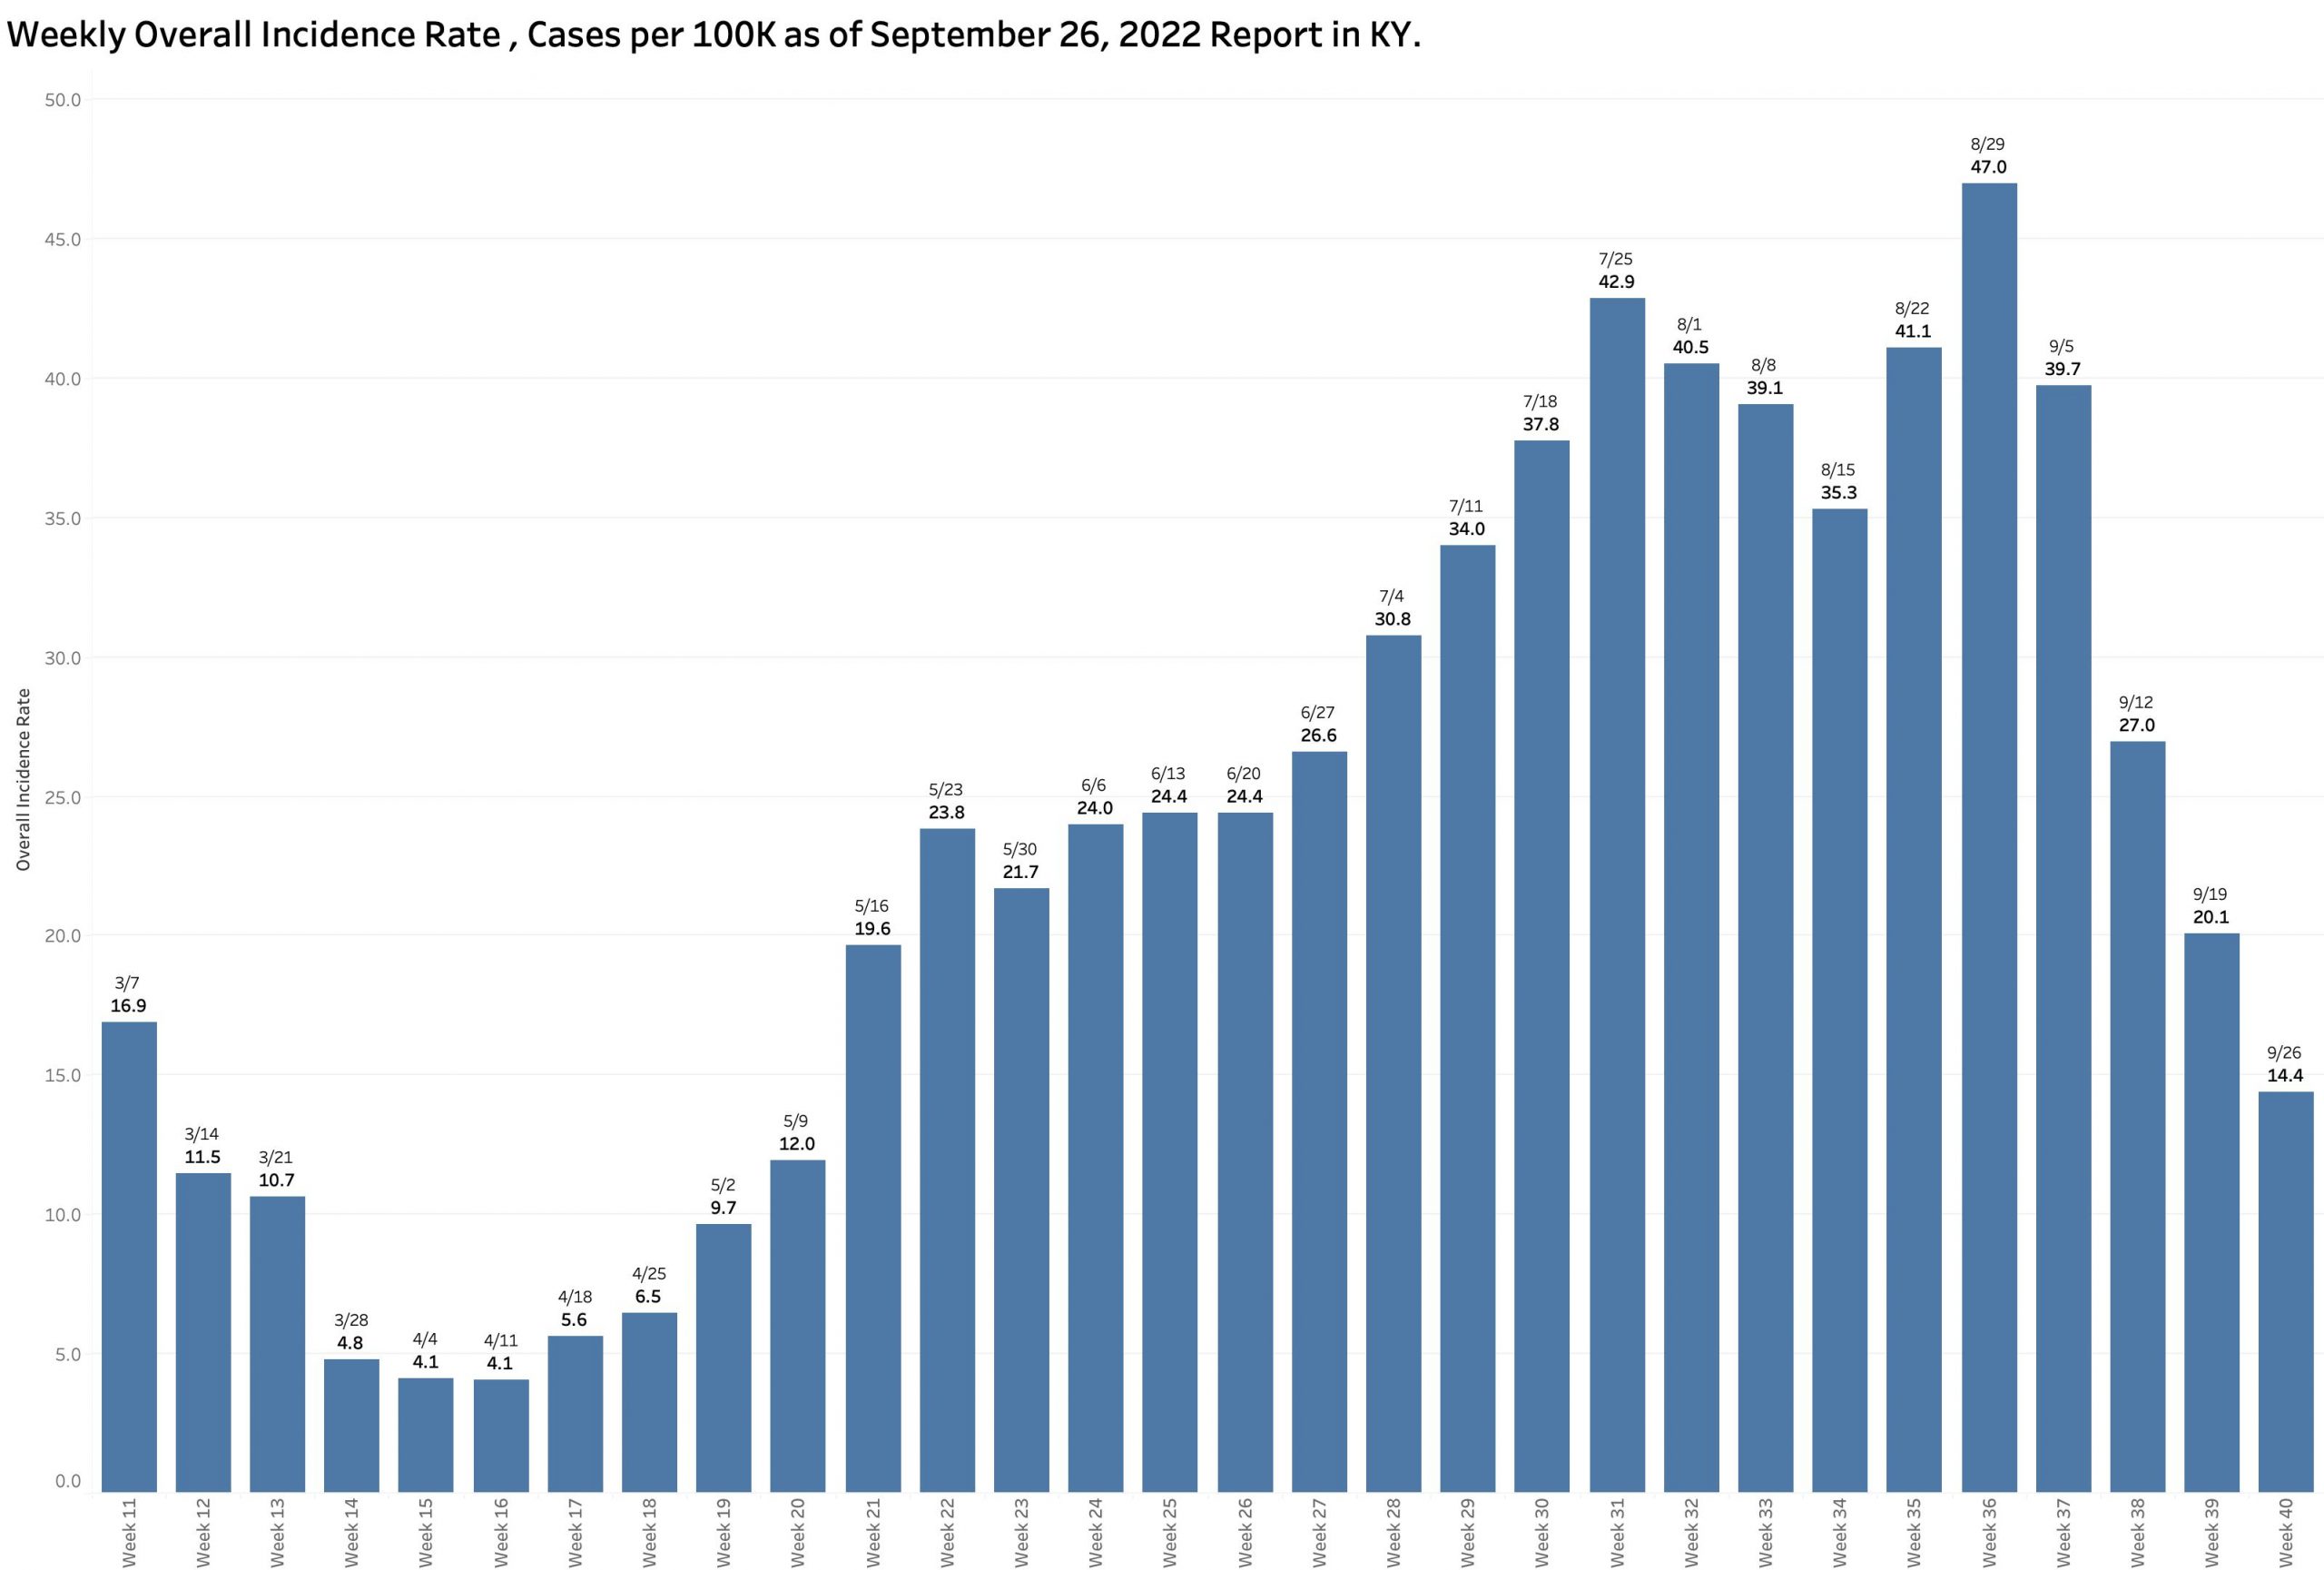
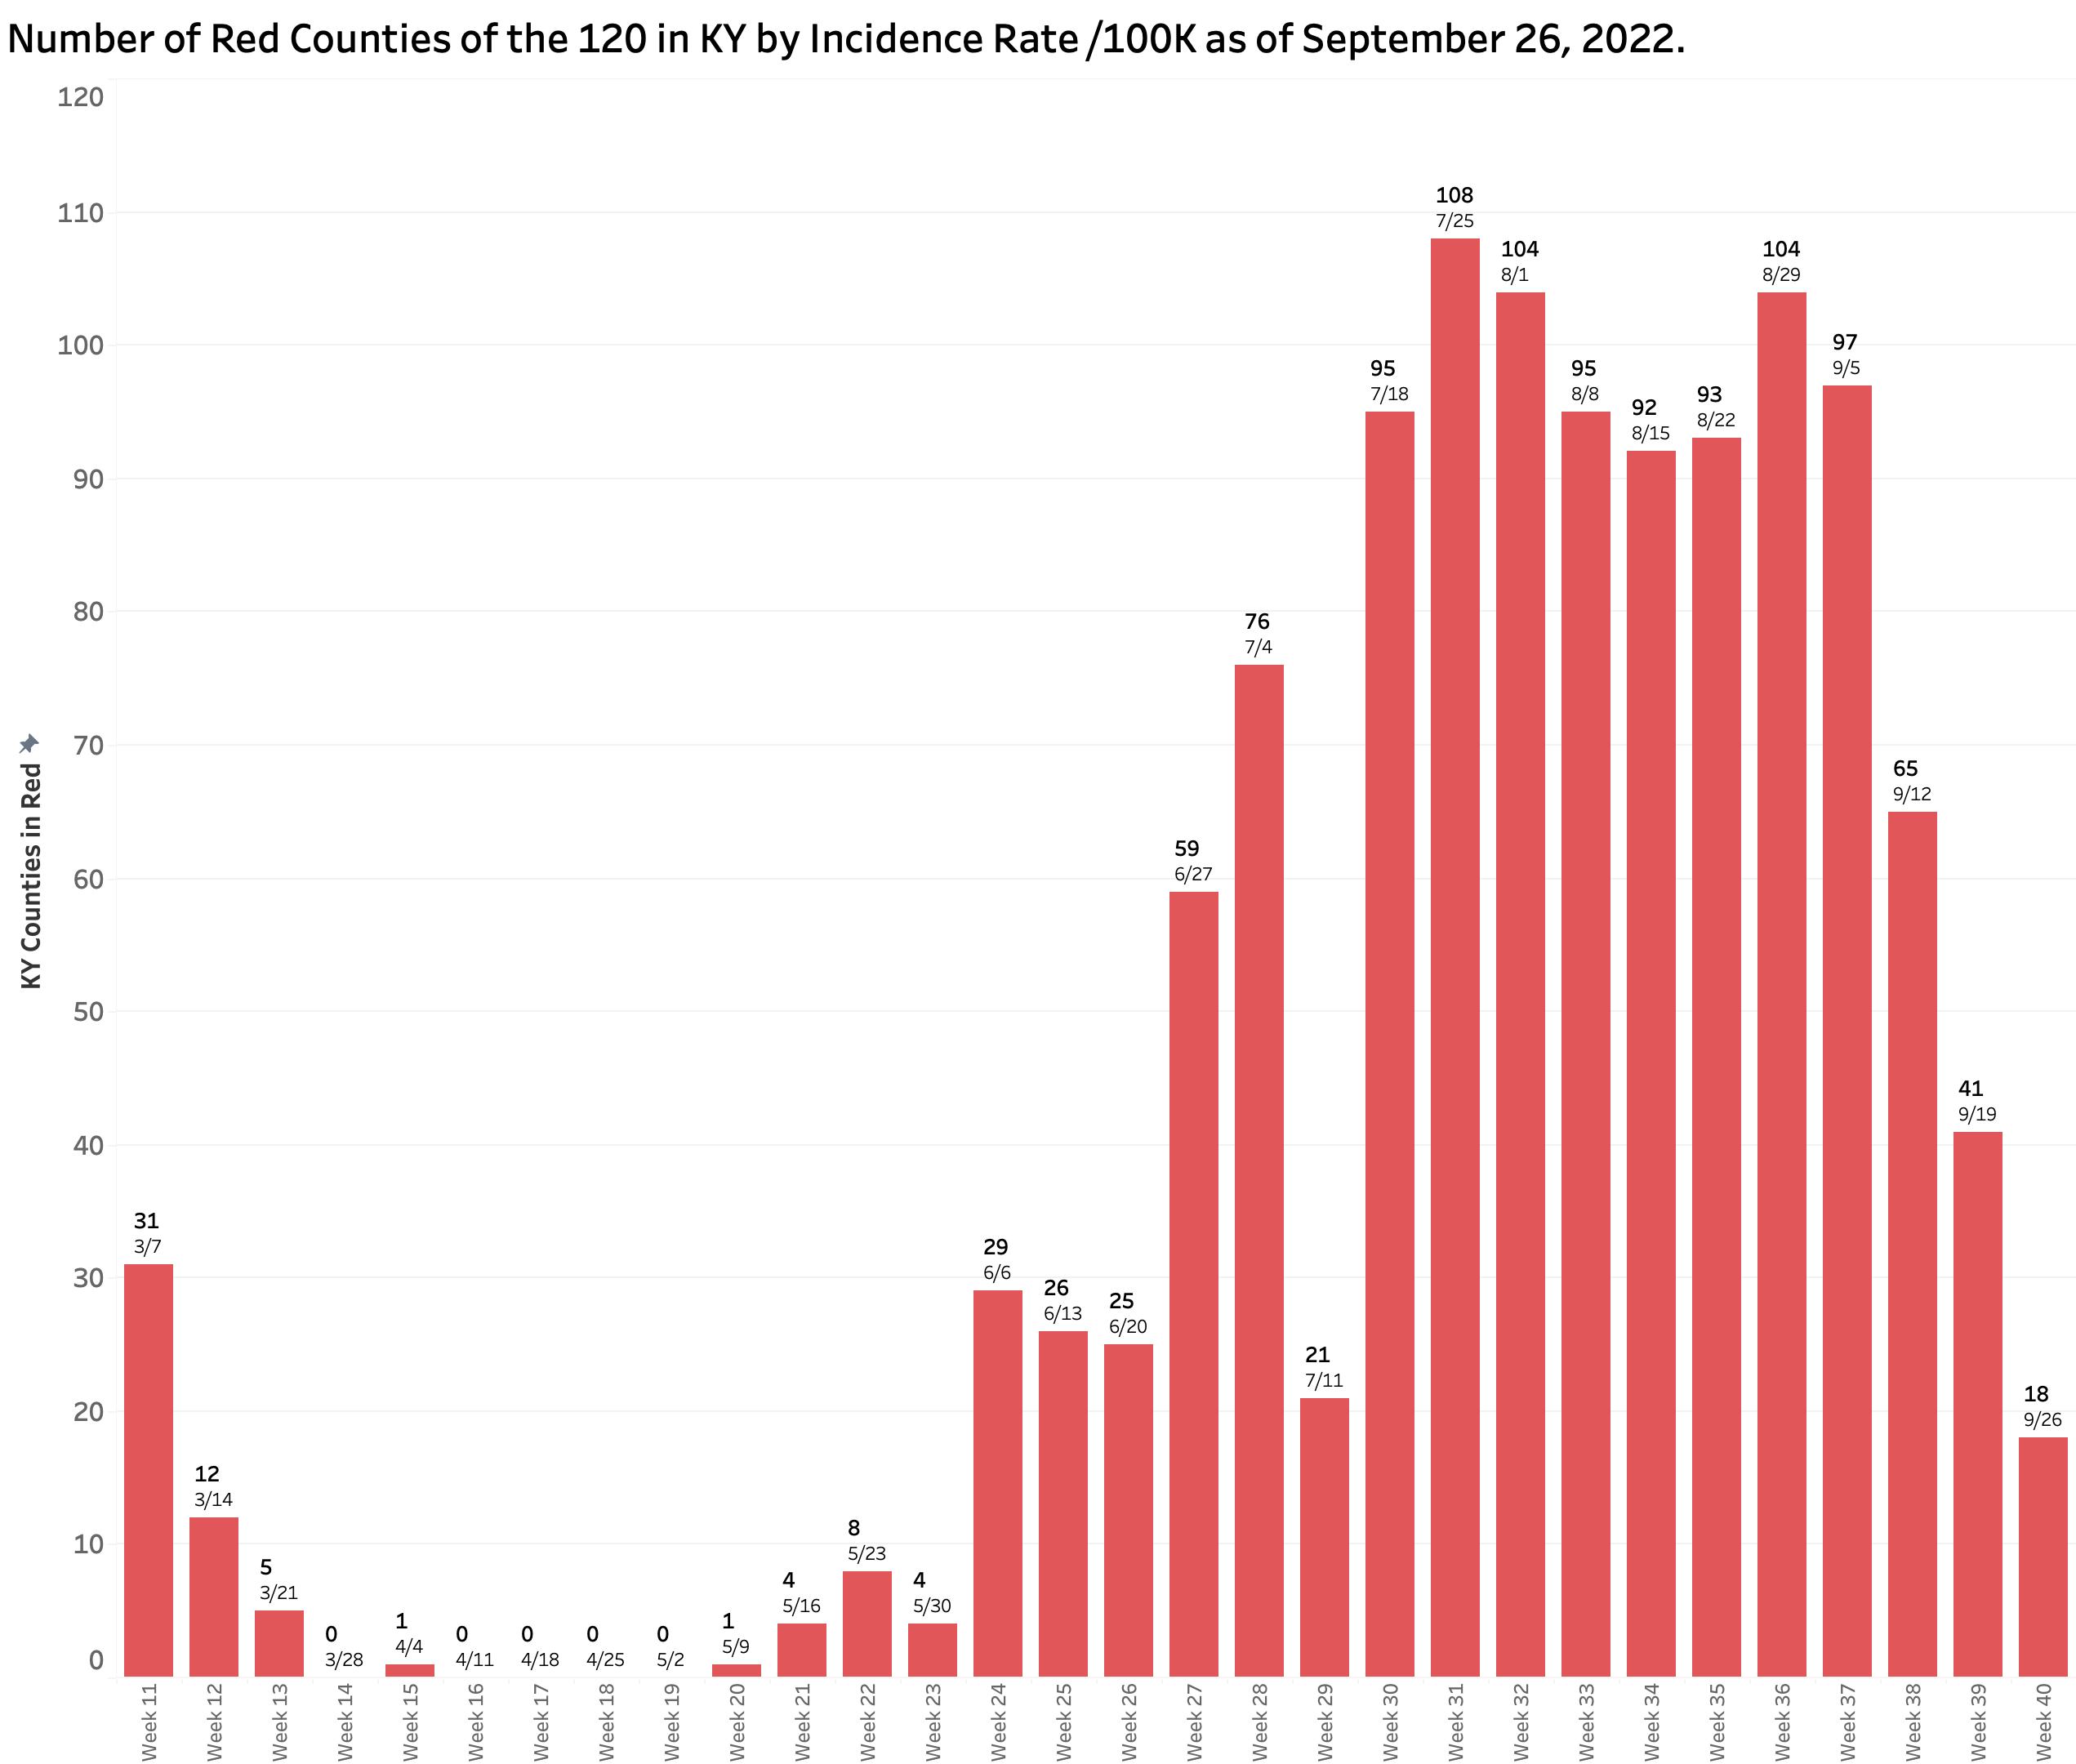
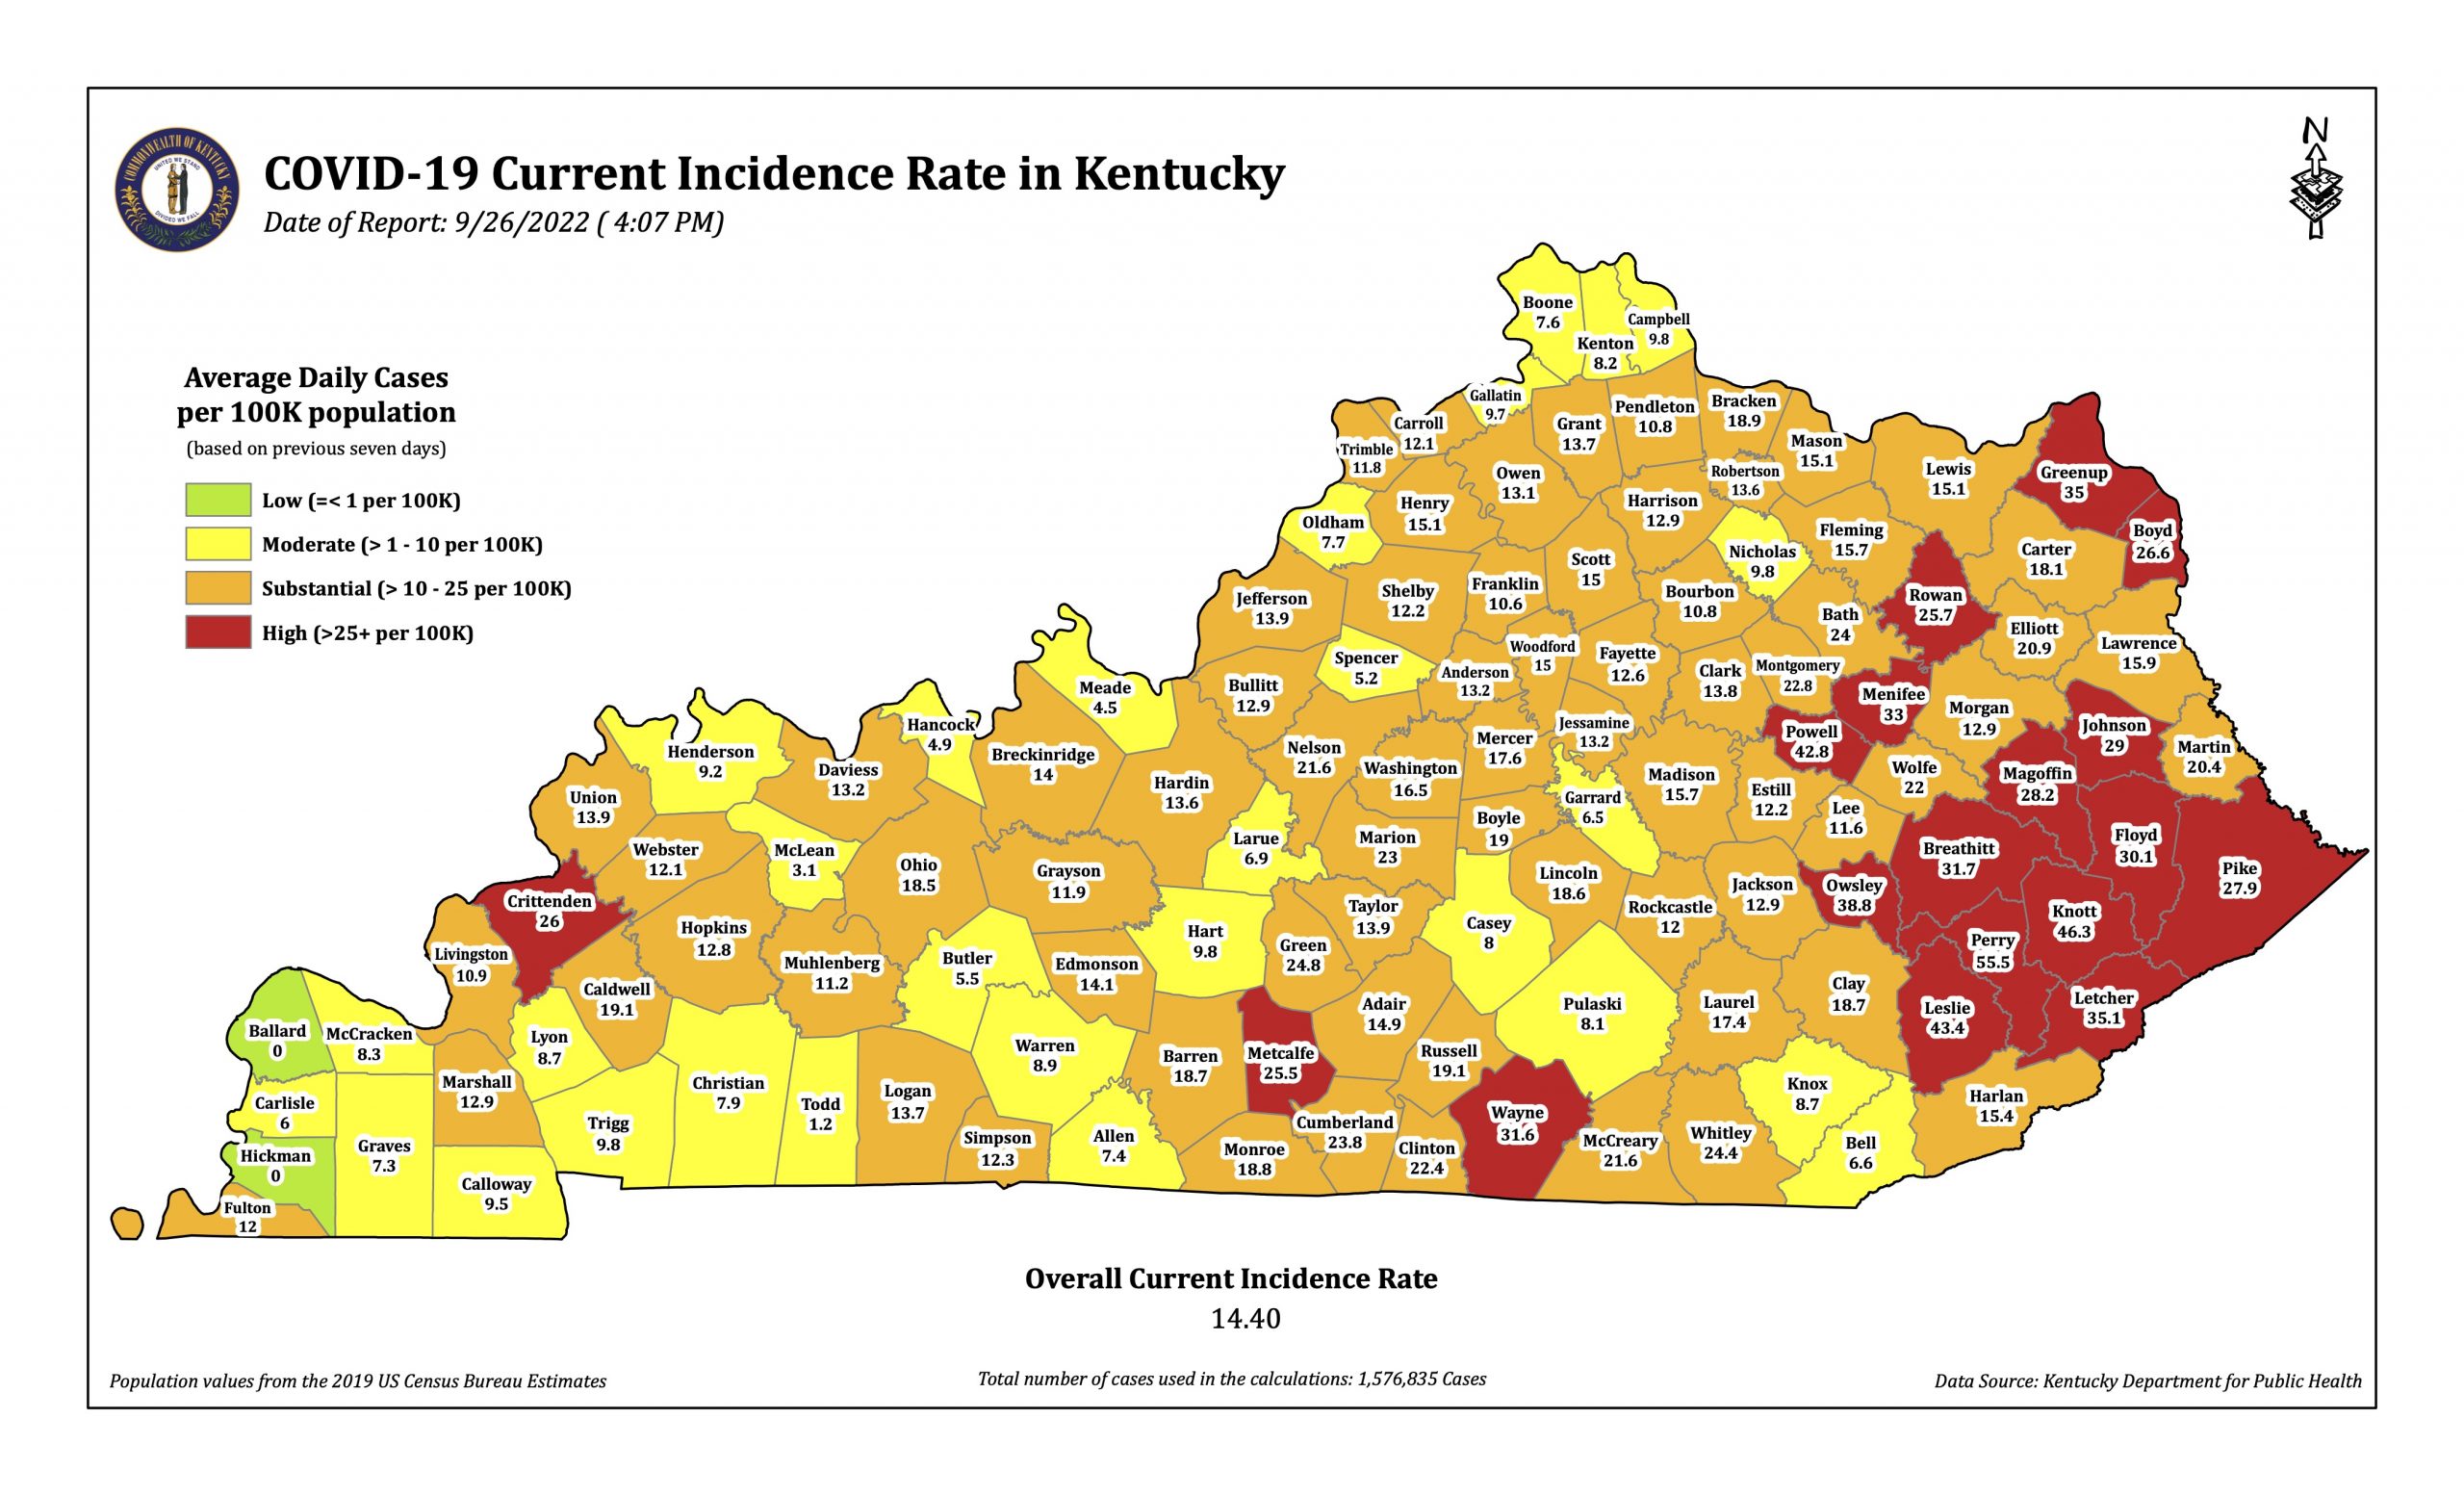
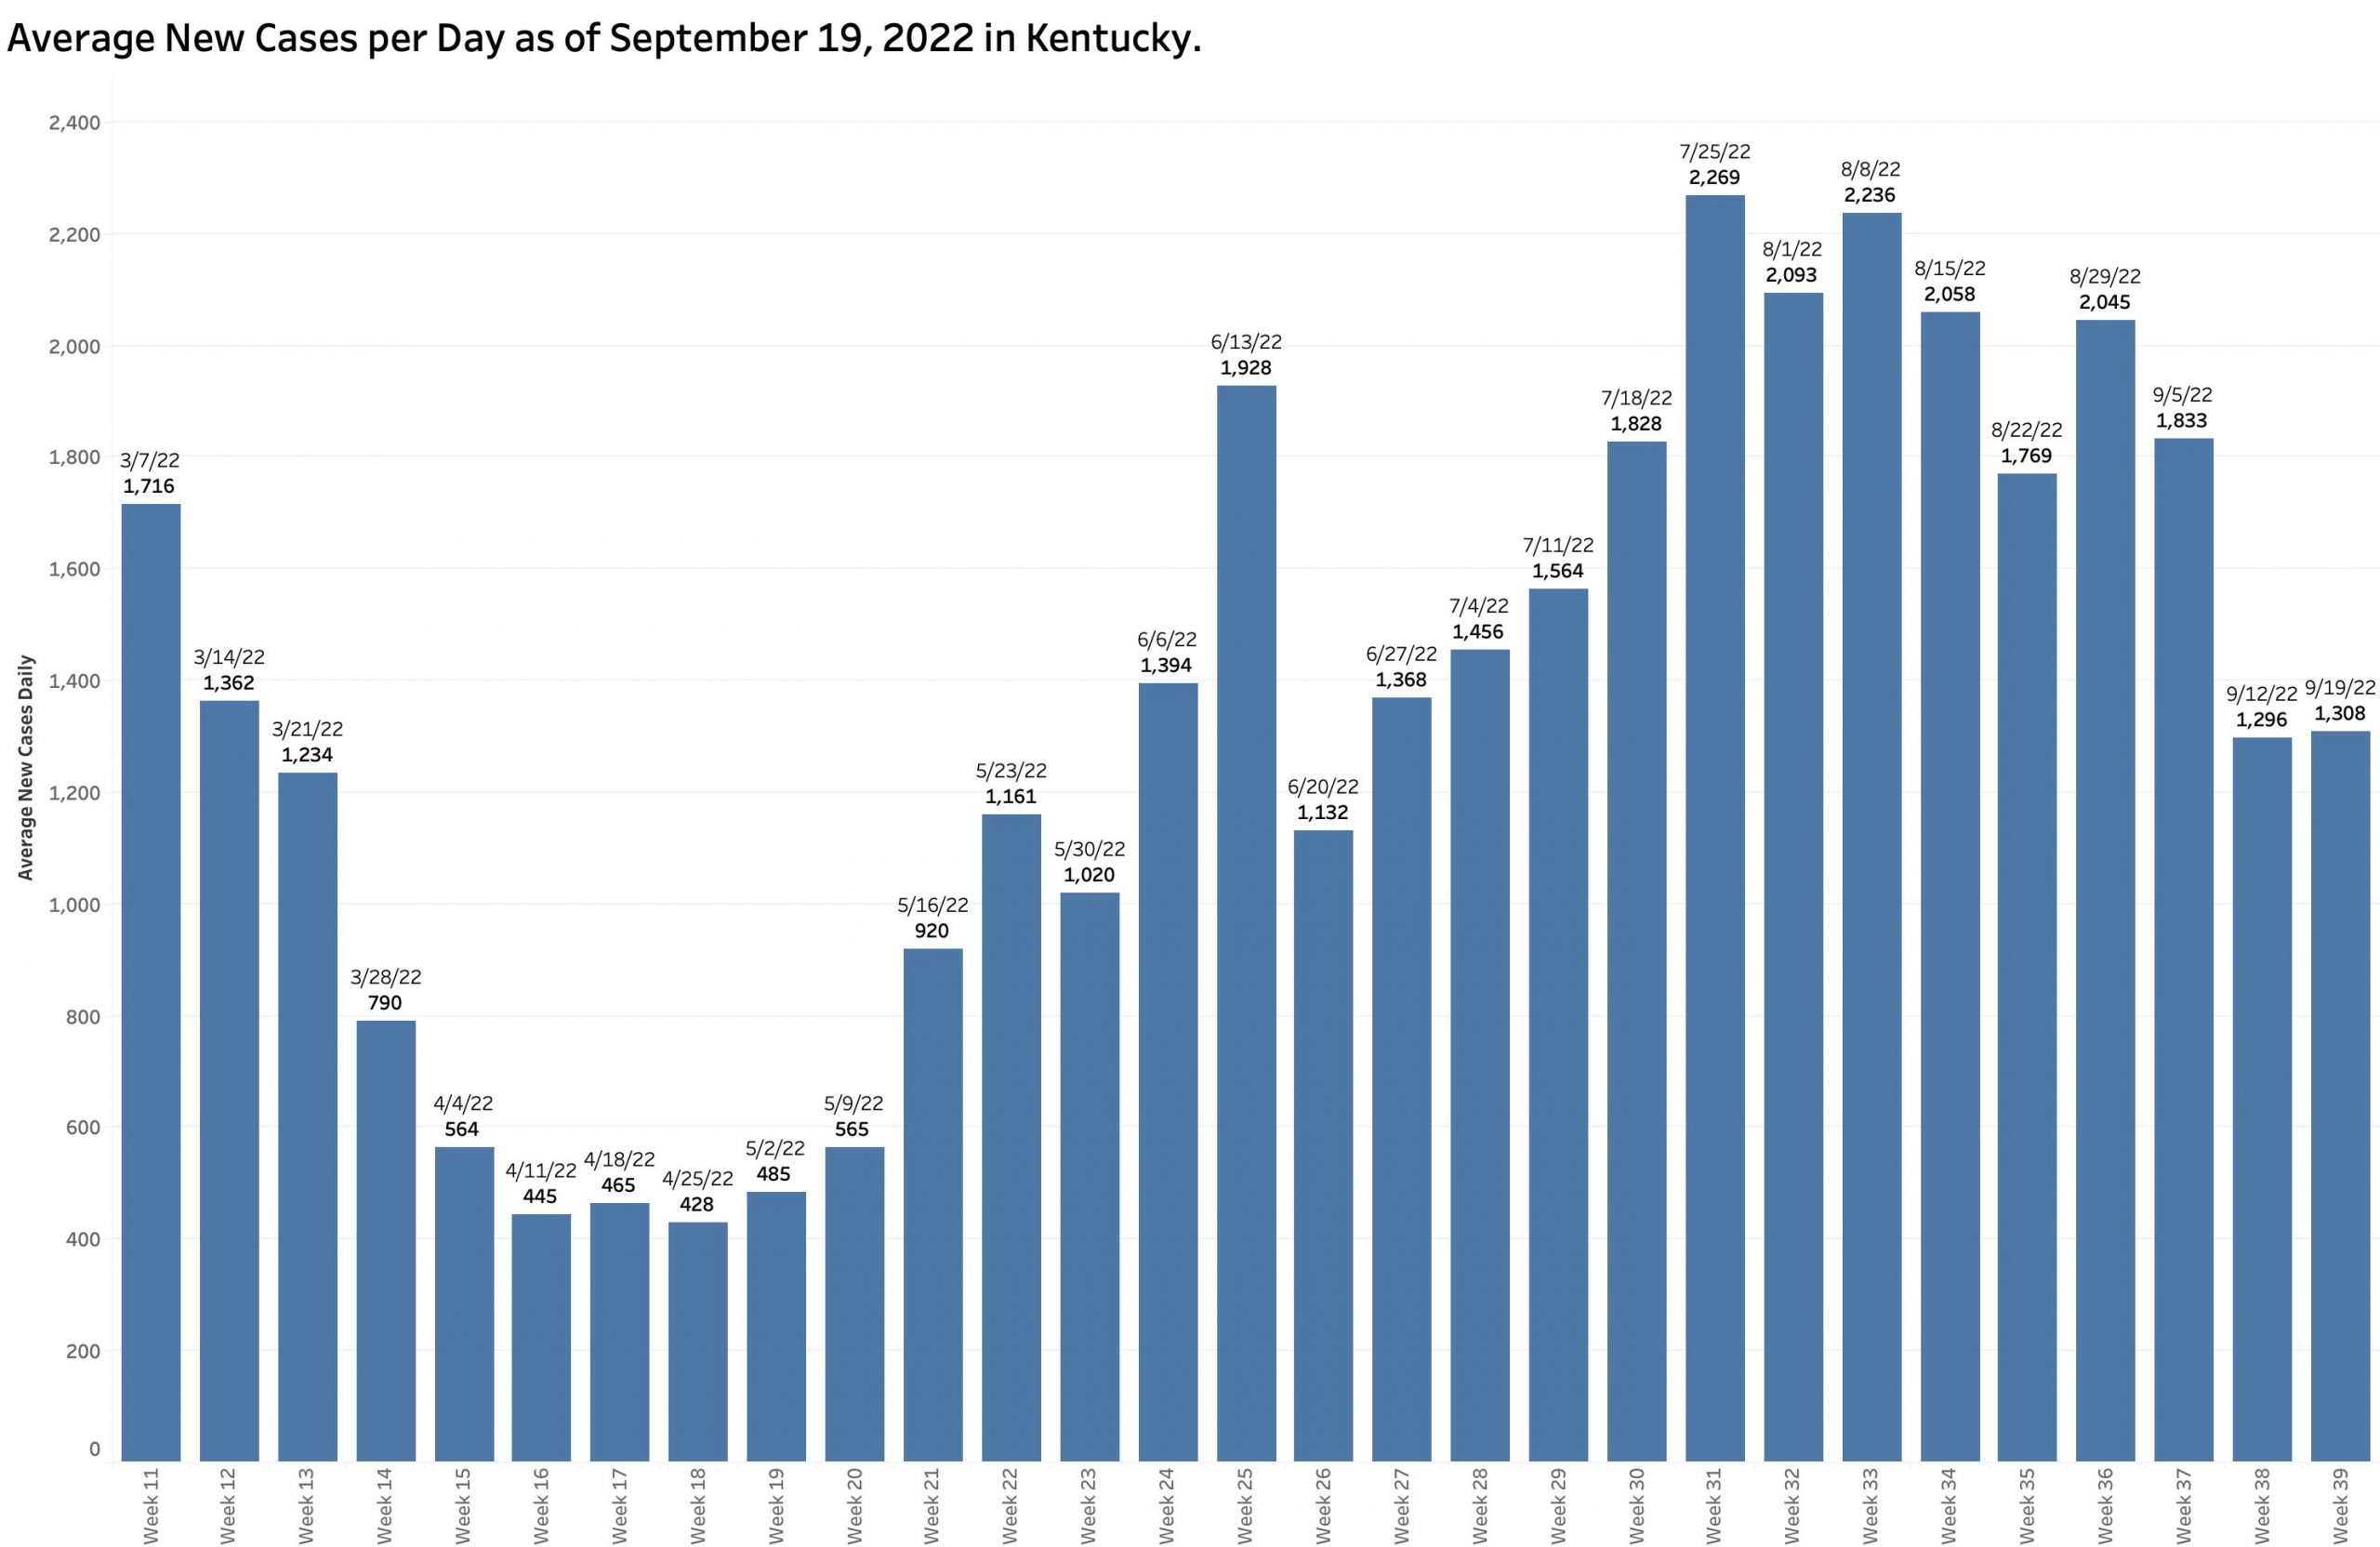
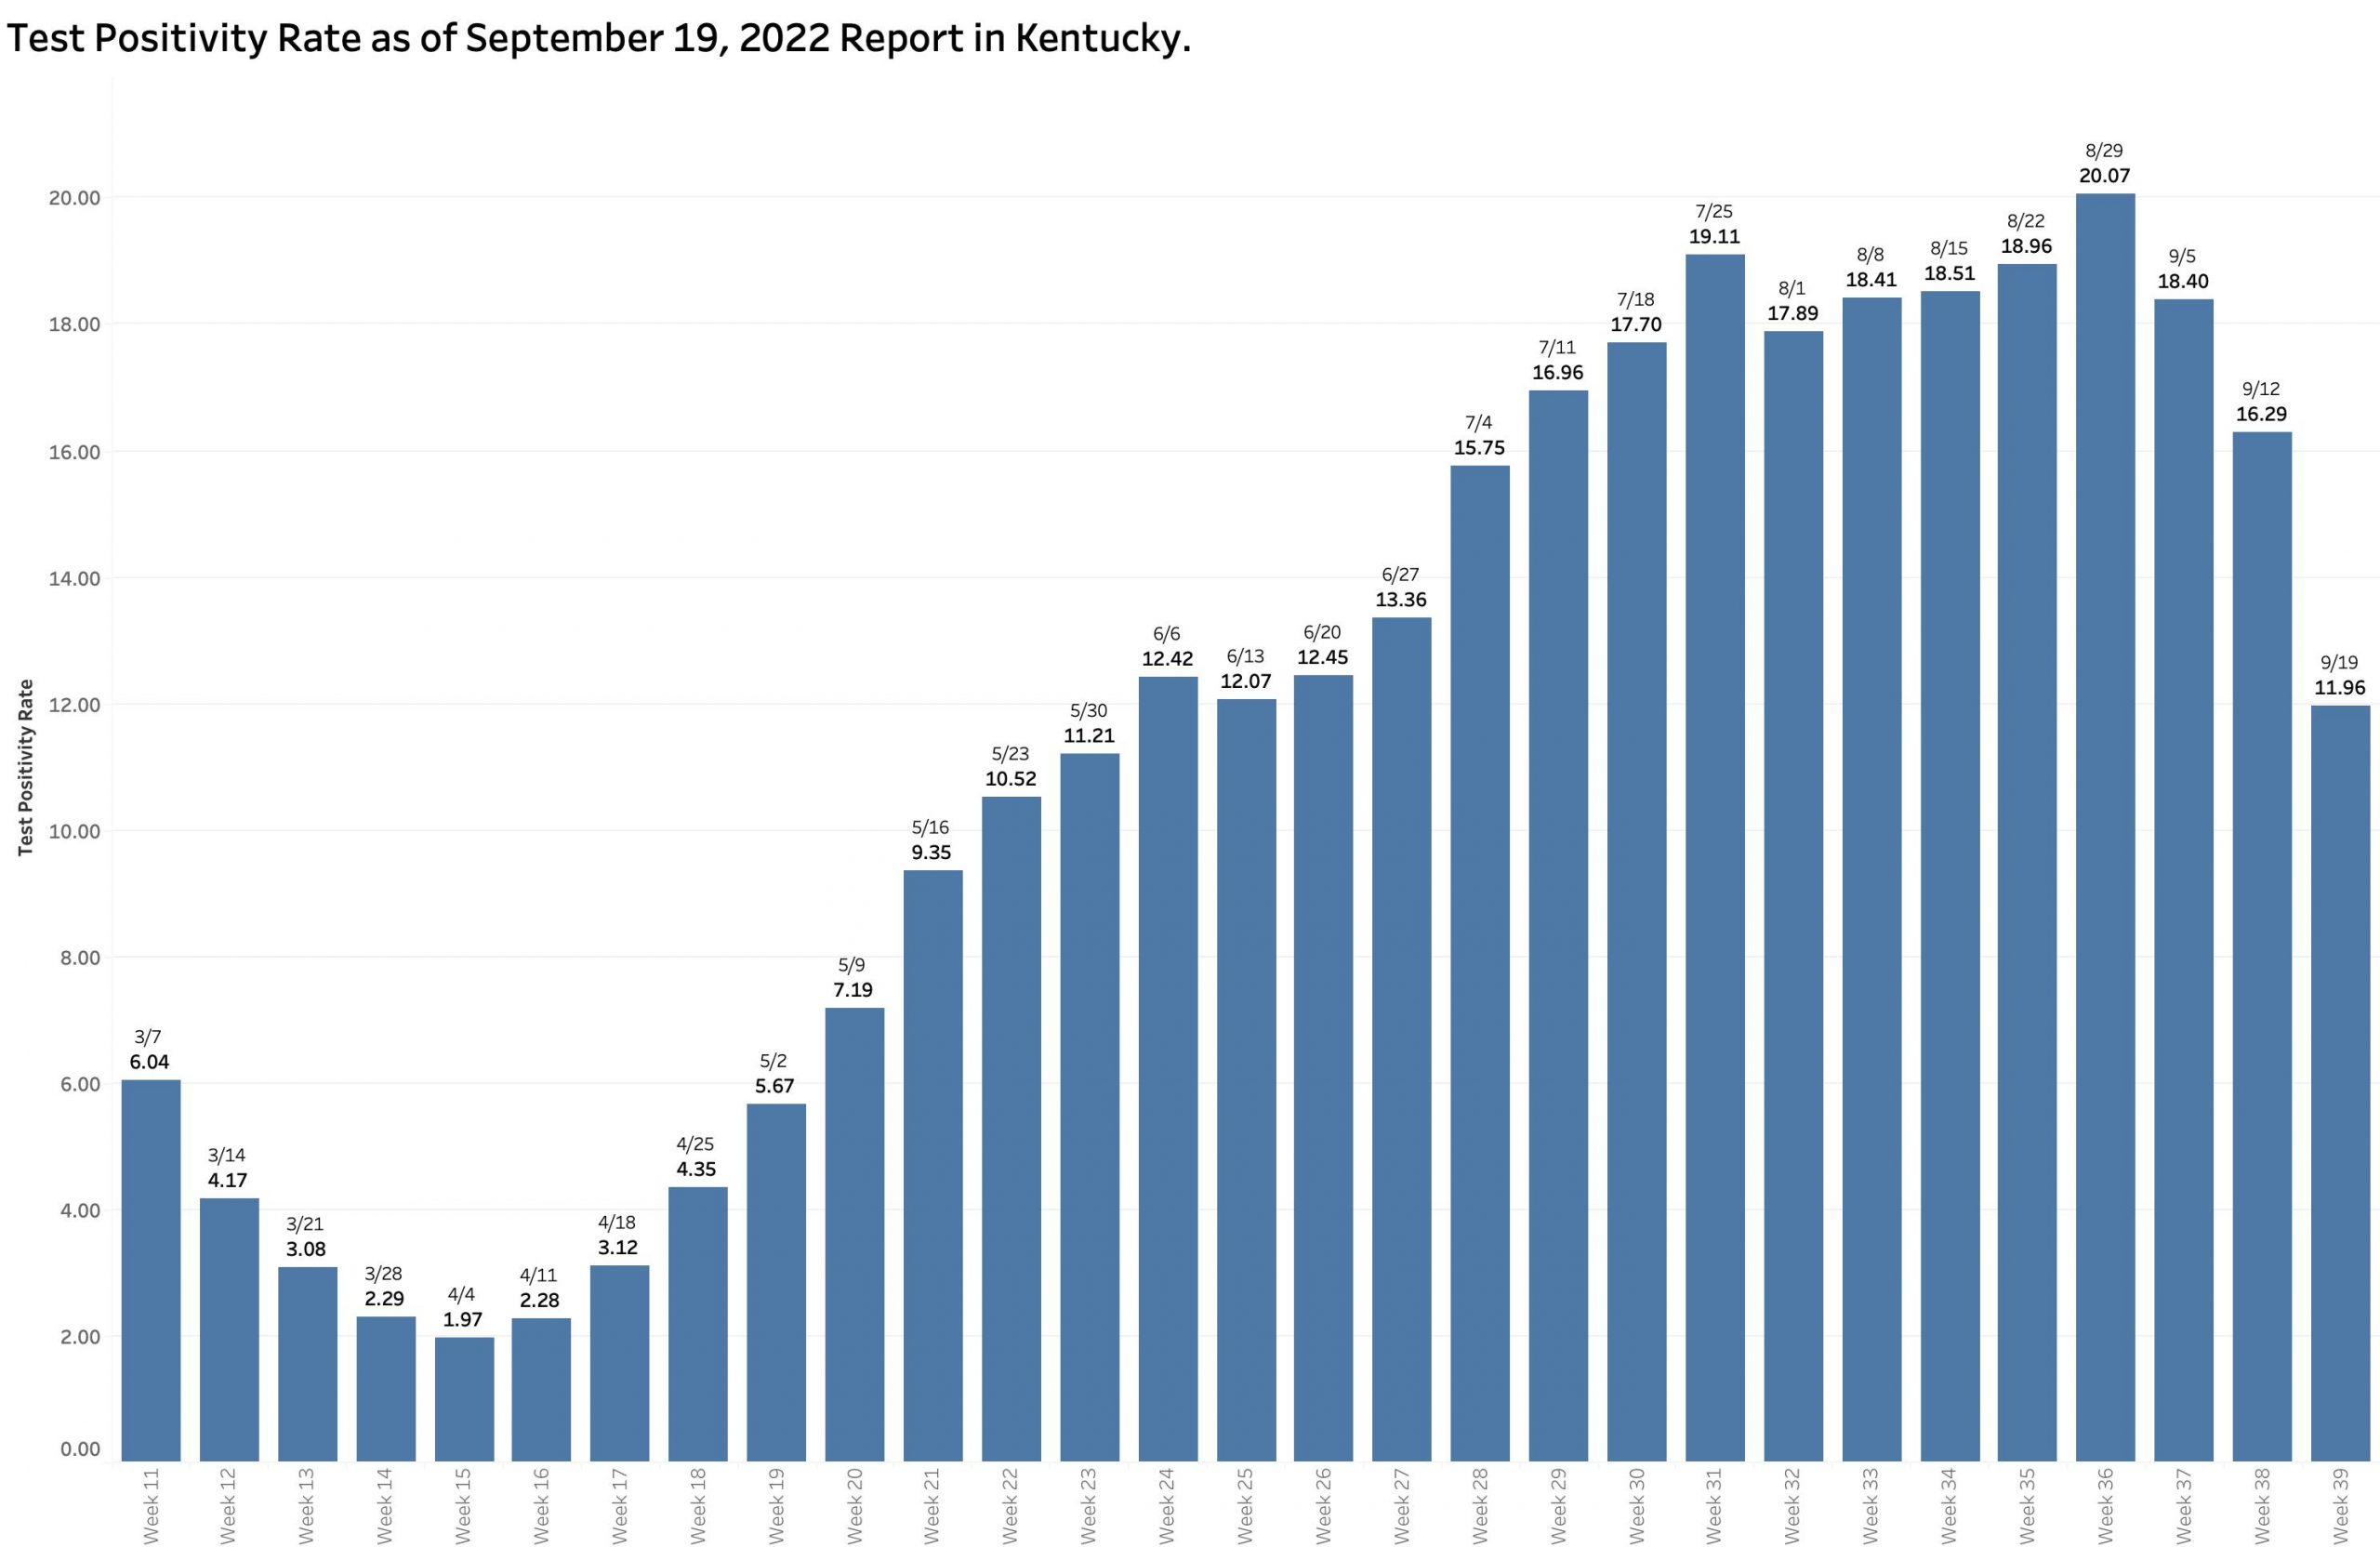
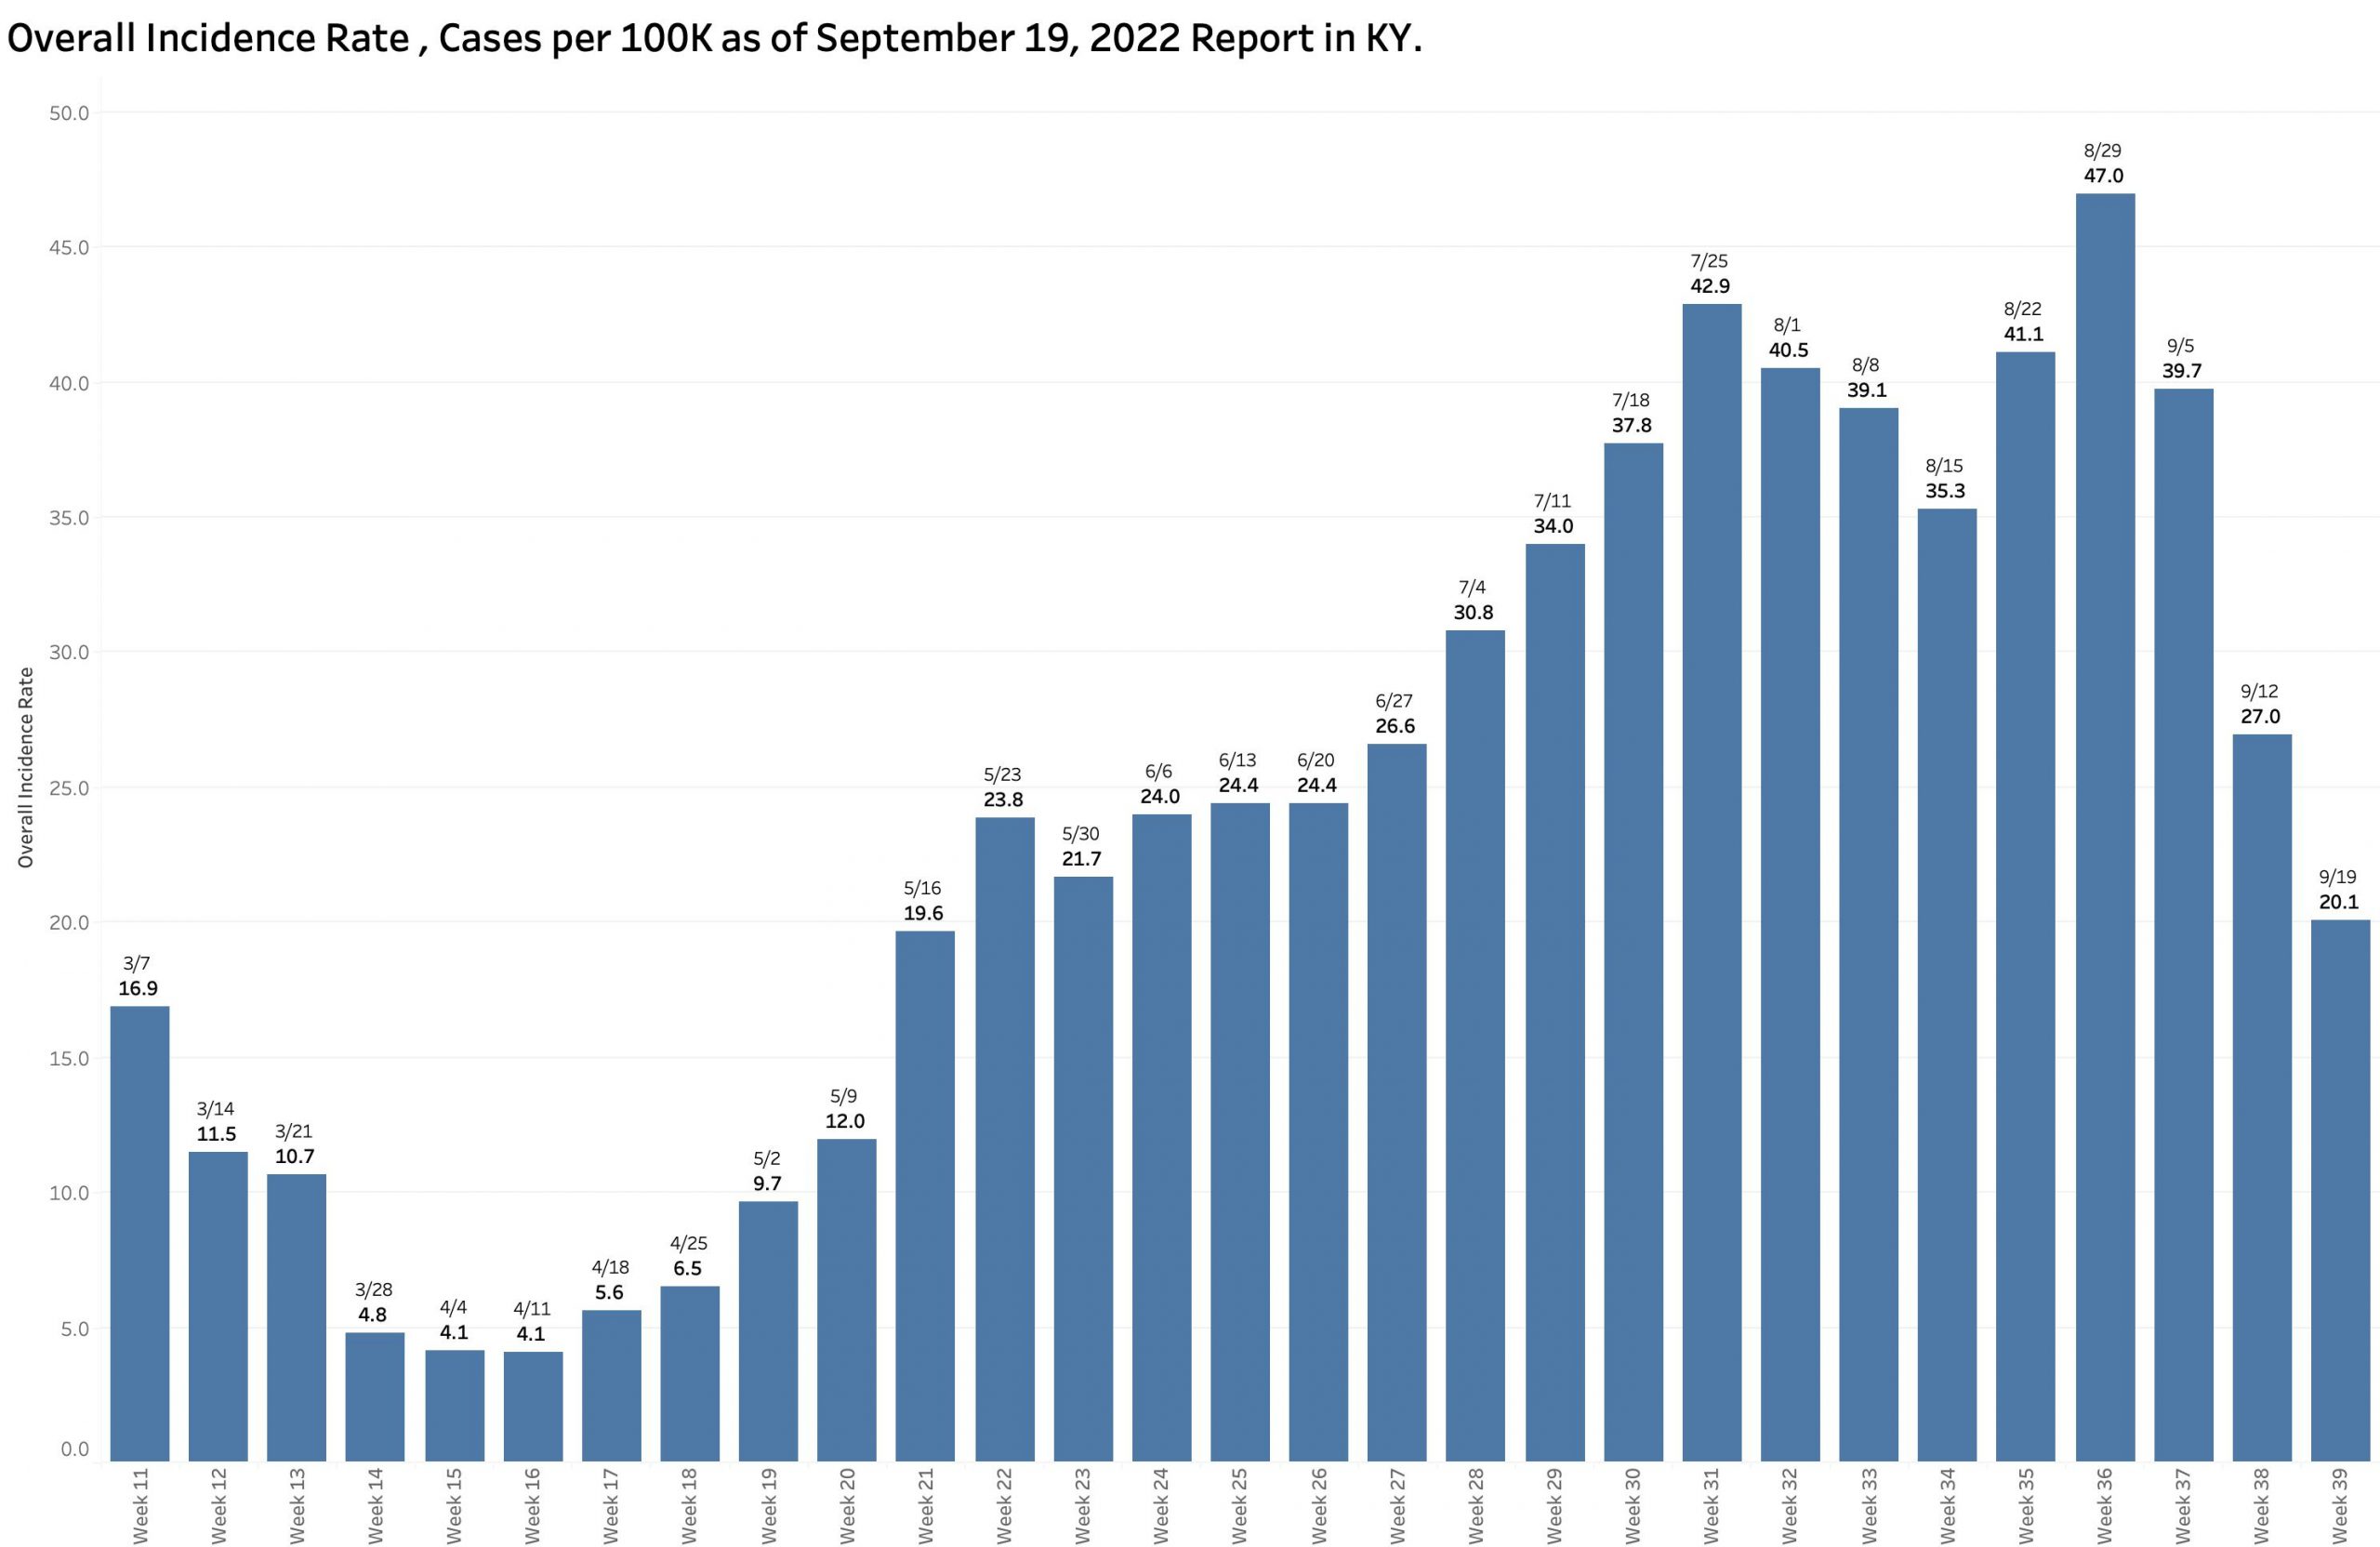
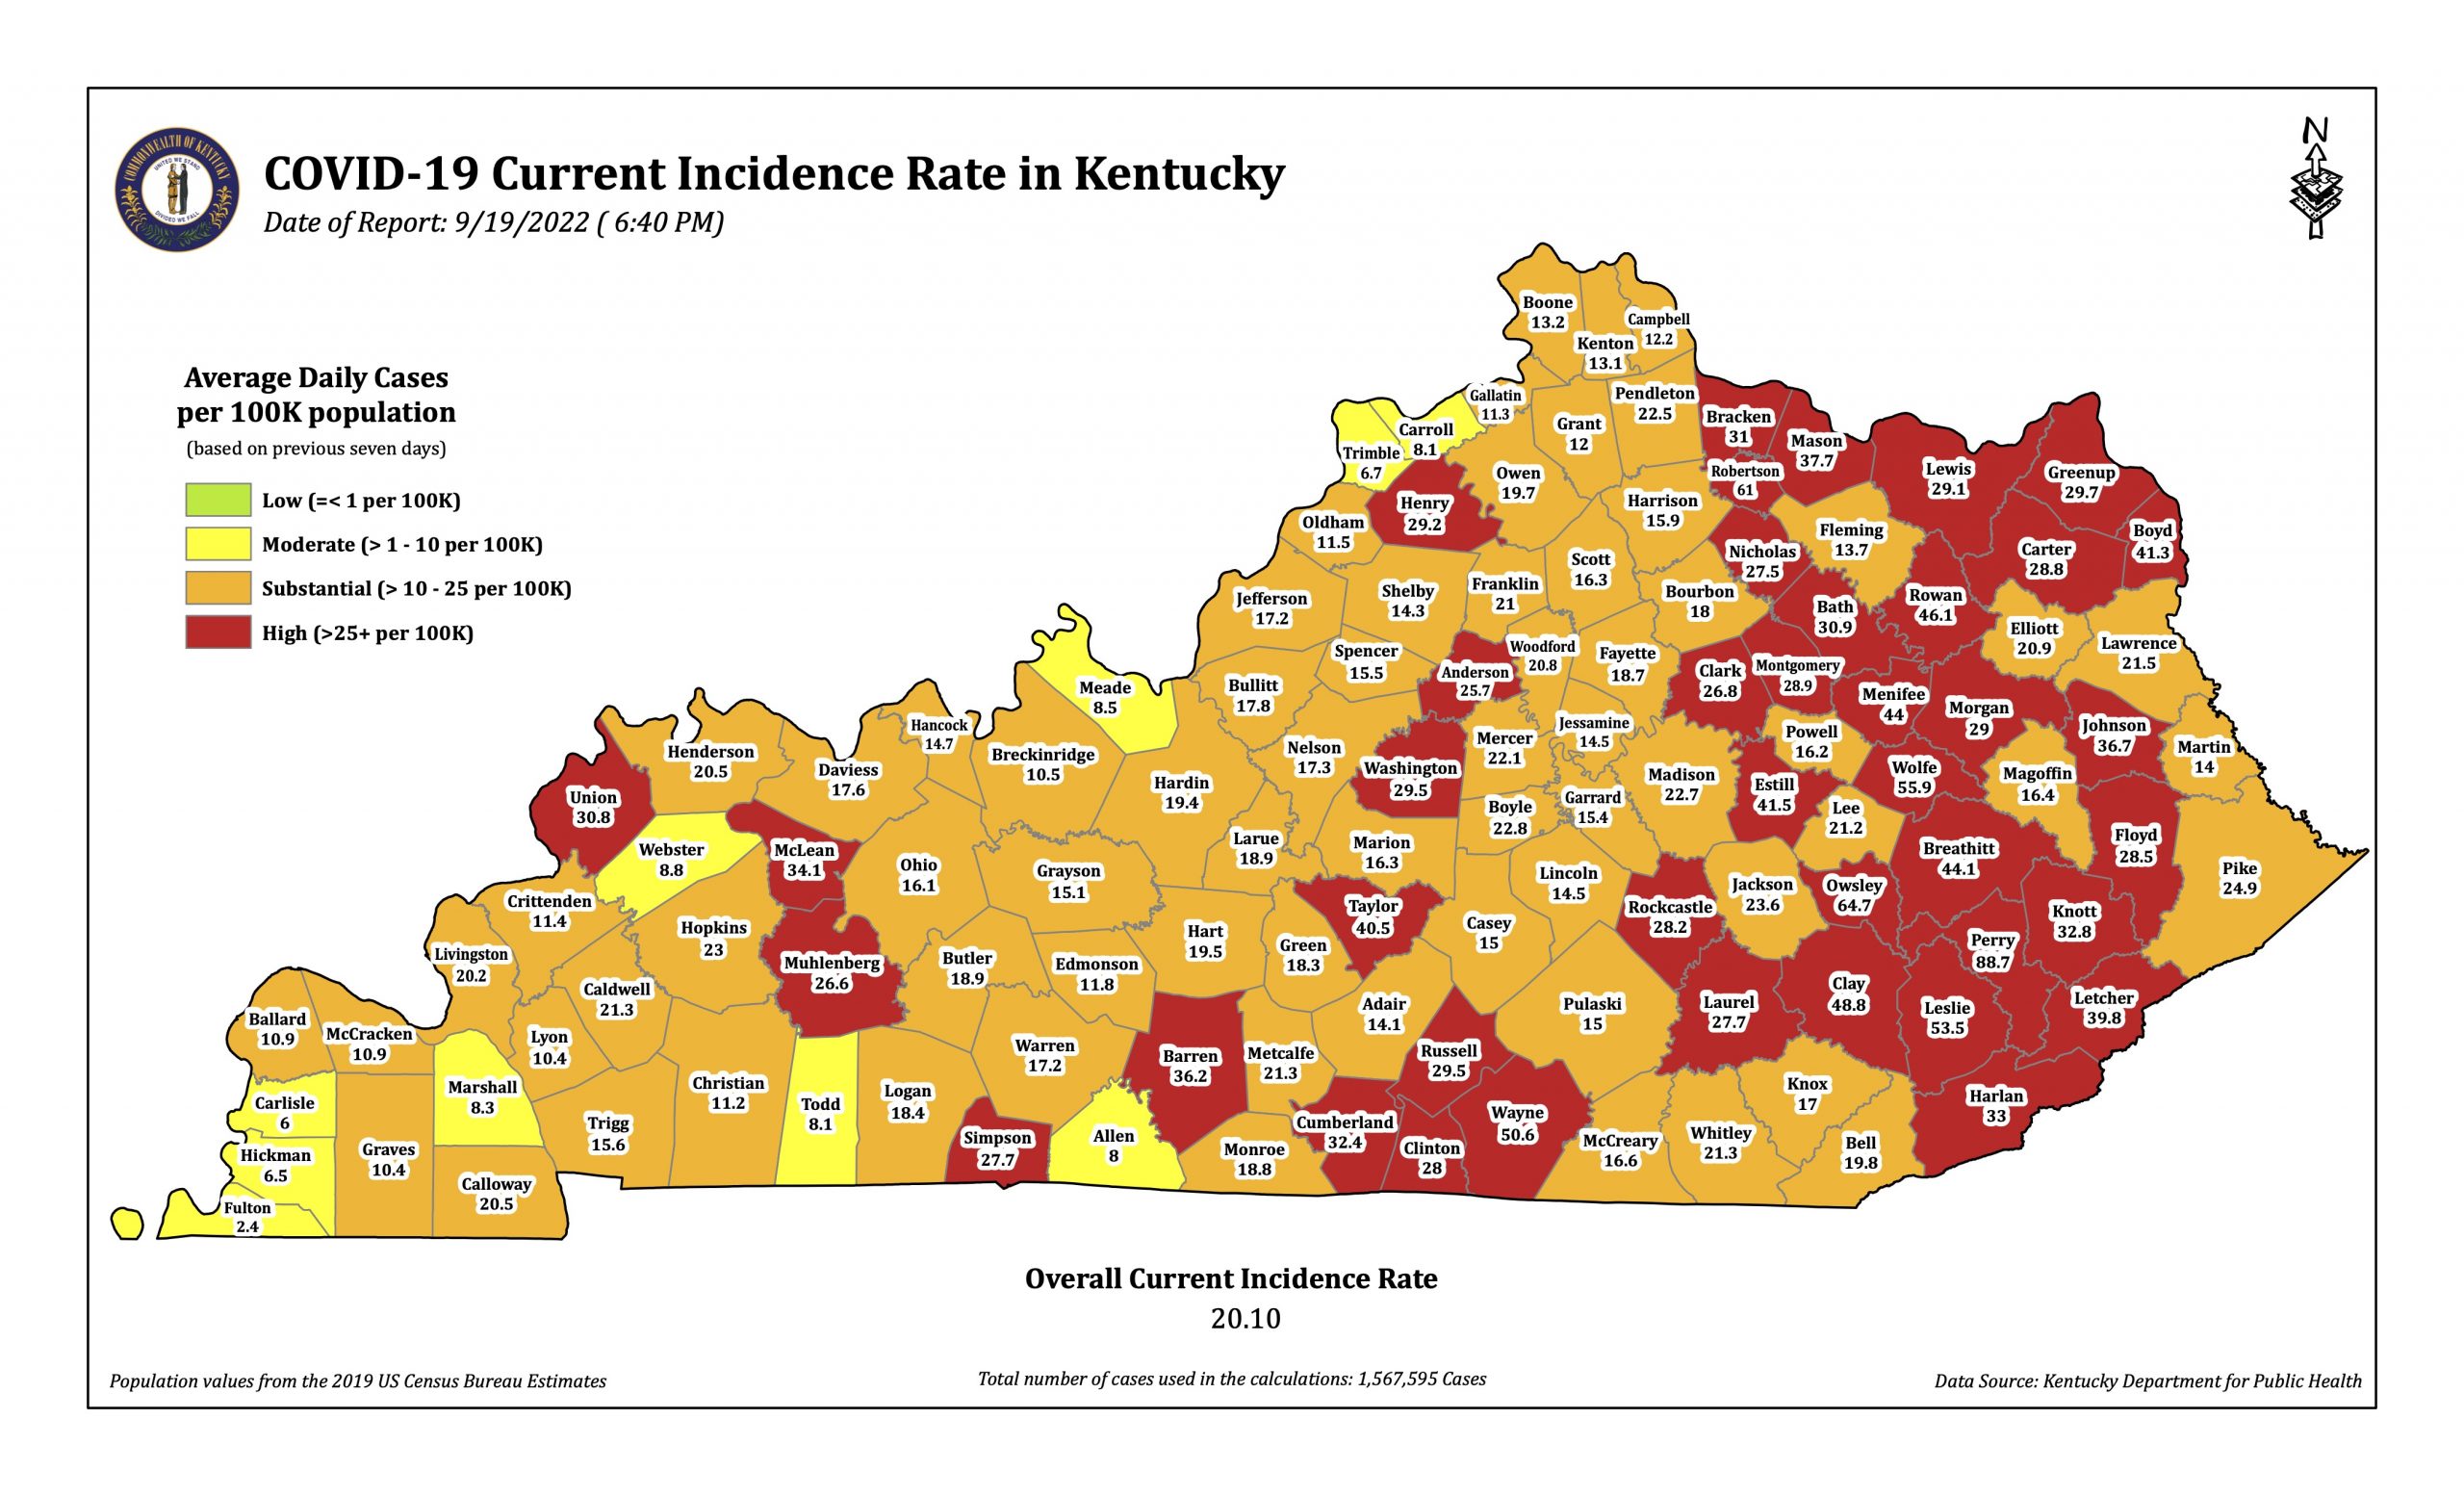
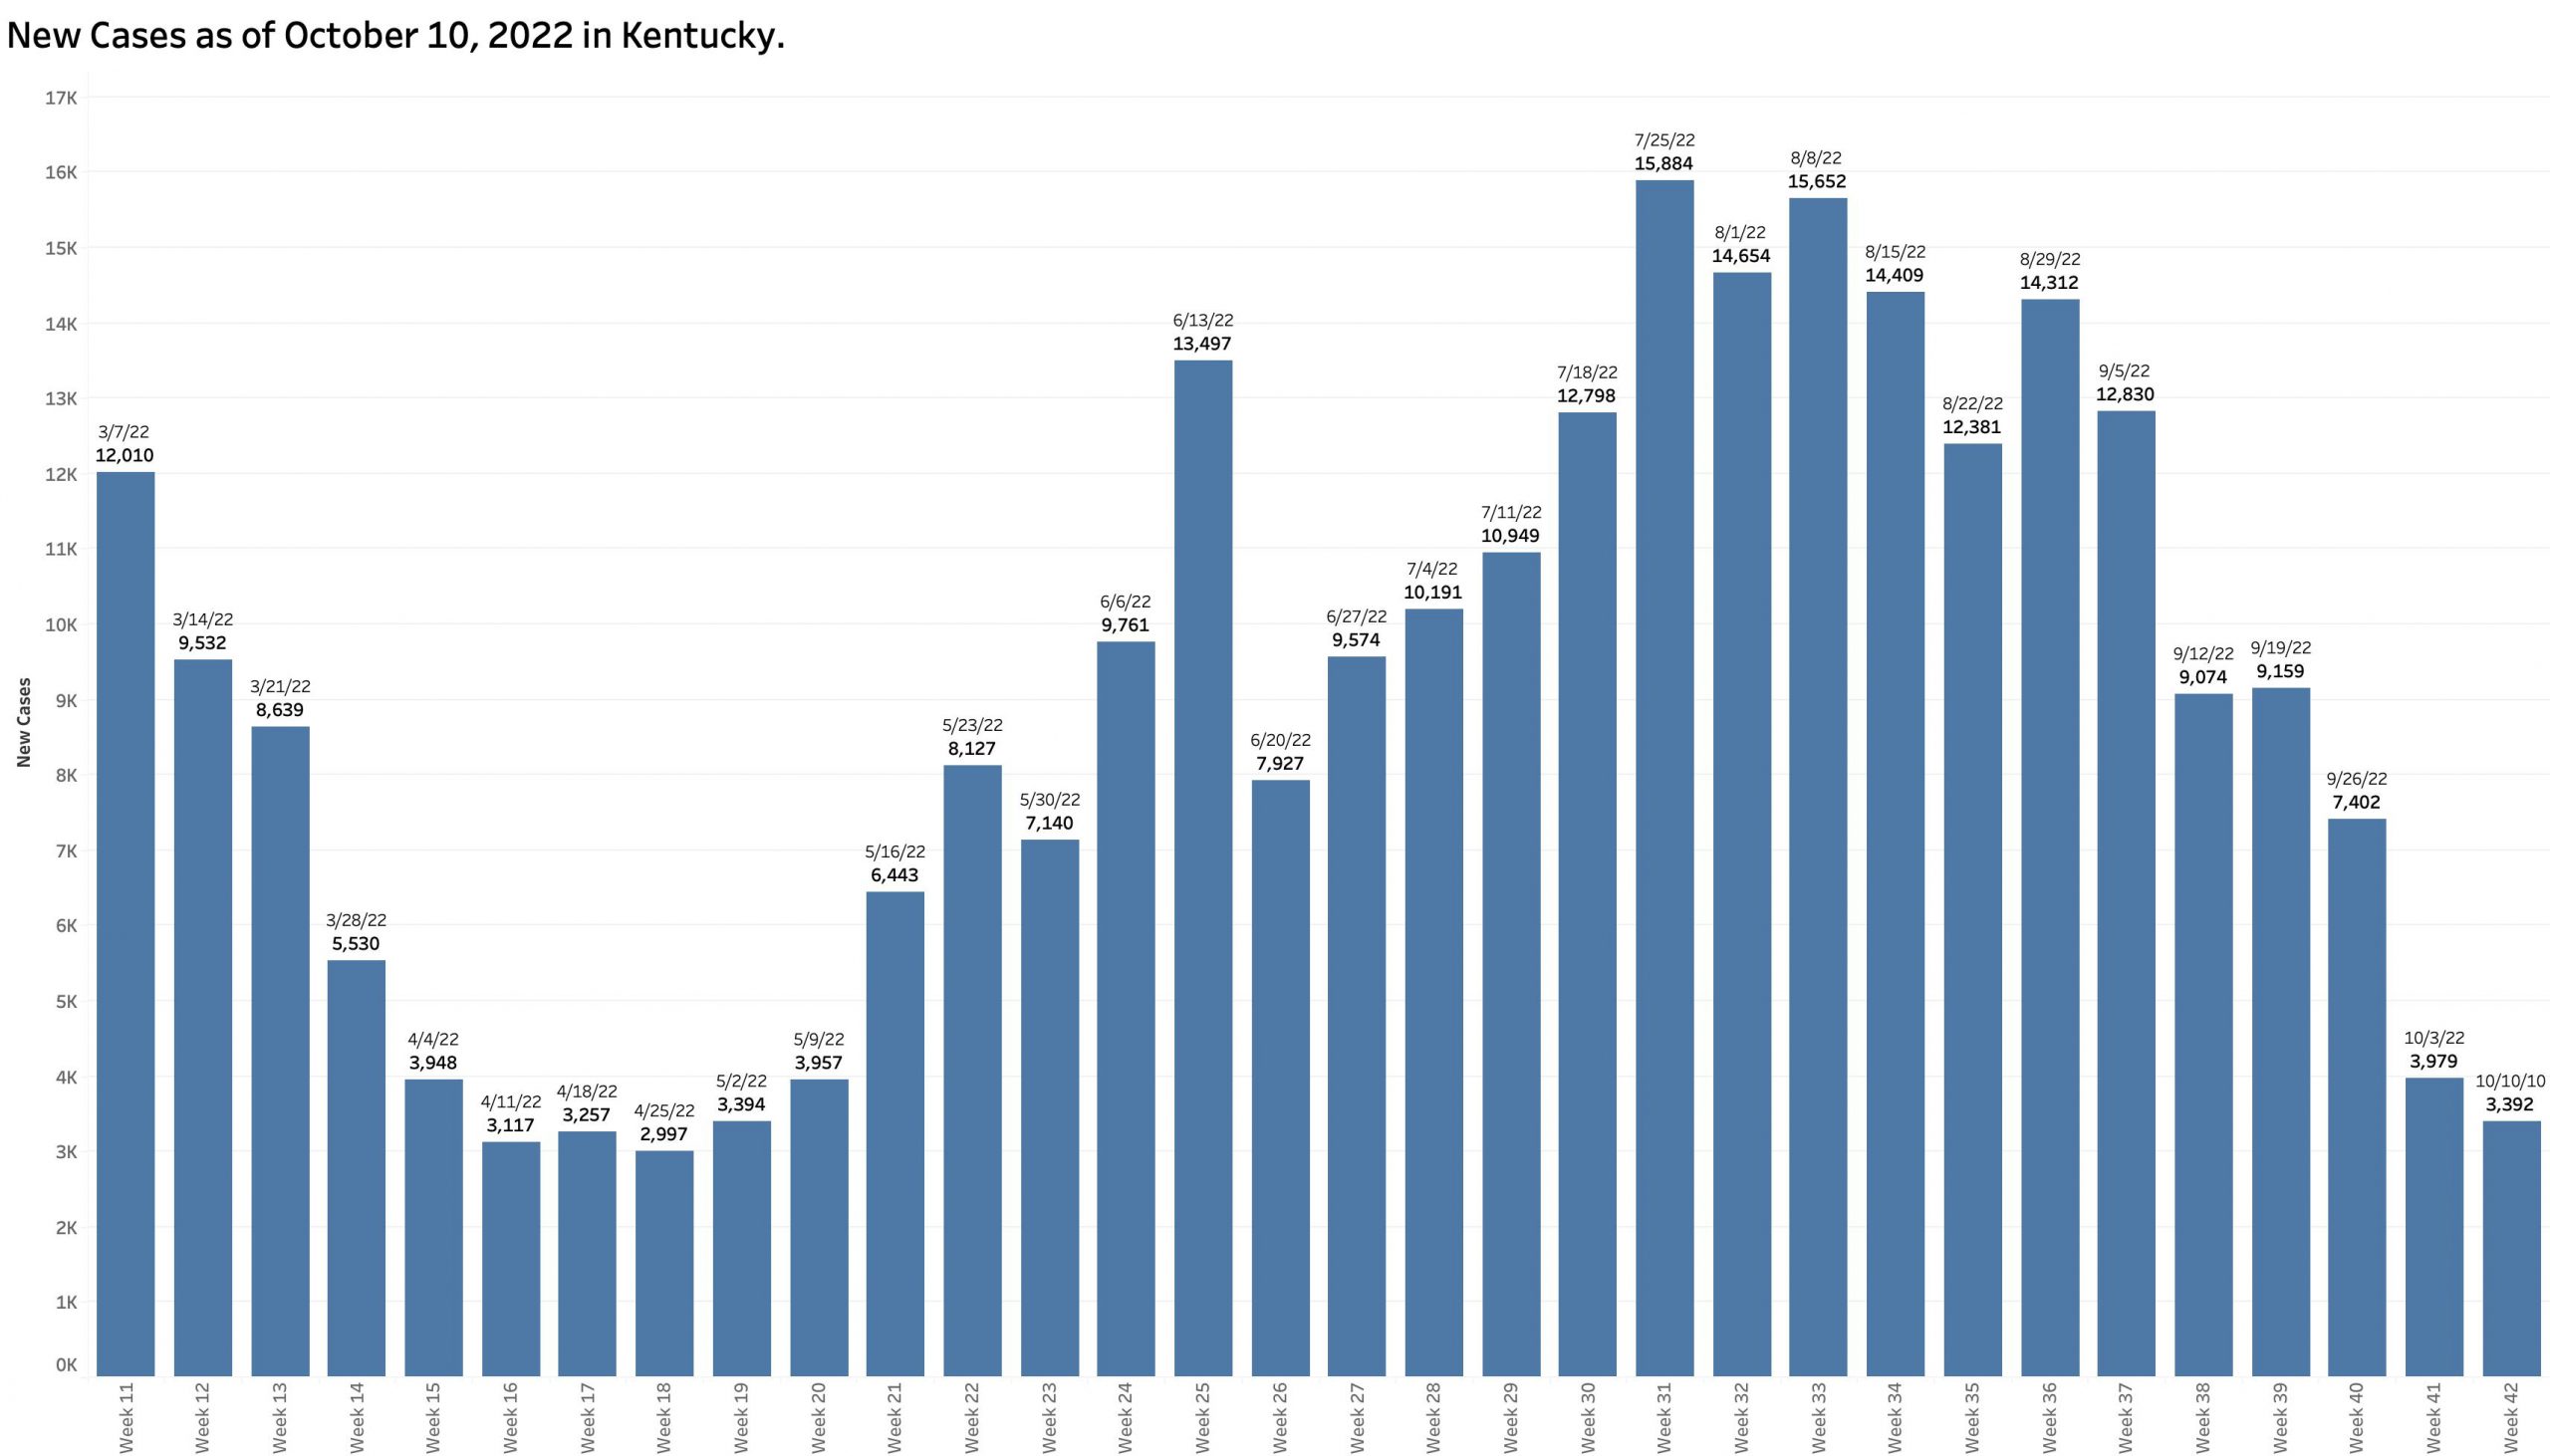
Monday’s October 10th Covid update from the Kentucky Department of Public Health (KYDPH) reports a continuing fall in new cases and in overall state incidence rate.  New cases last week (as defined) fell a little further to 3392, the lowest since early last May.  The current overall incidence rate of 10.3 per 100K population also decreased to May levels.  This is expected because this latter measure of disease activity is derived directly from the number of new cases.  For the same reason, the number of Kentucky counties “in the red” for incidence rates fell to four.  All of these are clustered in the far southeastern part of the state and show up as a prominent hot-spot on national maps.  The statewide test-positivity rate, while up a tad, is also as low as it was last May. Hospitalizations are still going down, but deaths are not.

Nonetheless, a closer look at the report confirms in my mind that the number of new cases acknowledged in the report continues to vastly underestimate the actual number of individuals contracting Covid-19 for reasons I have discussed in the last few articles in this series.  It appears to me that there has been a collapse of reported clinical testing and reporting in Kentucky, and likely in other states. We are in my opinion and that of others, “flying blind.”
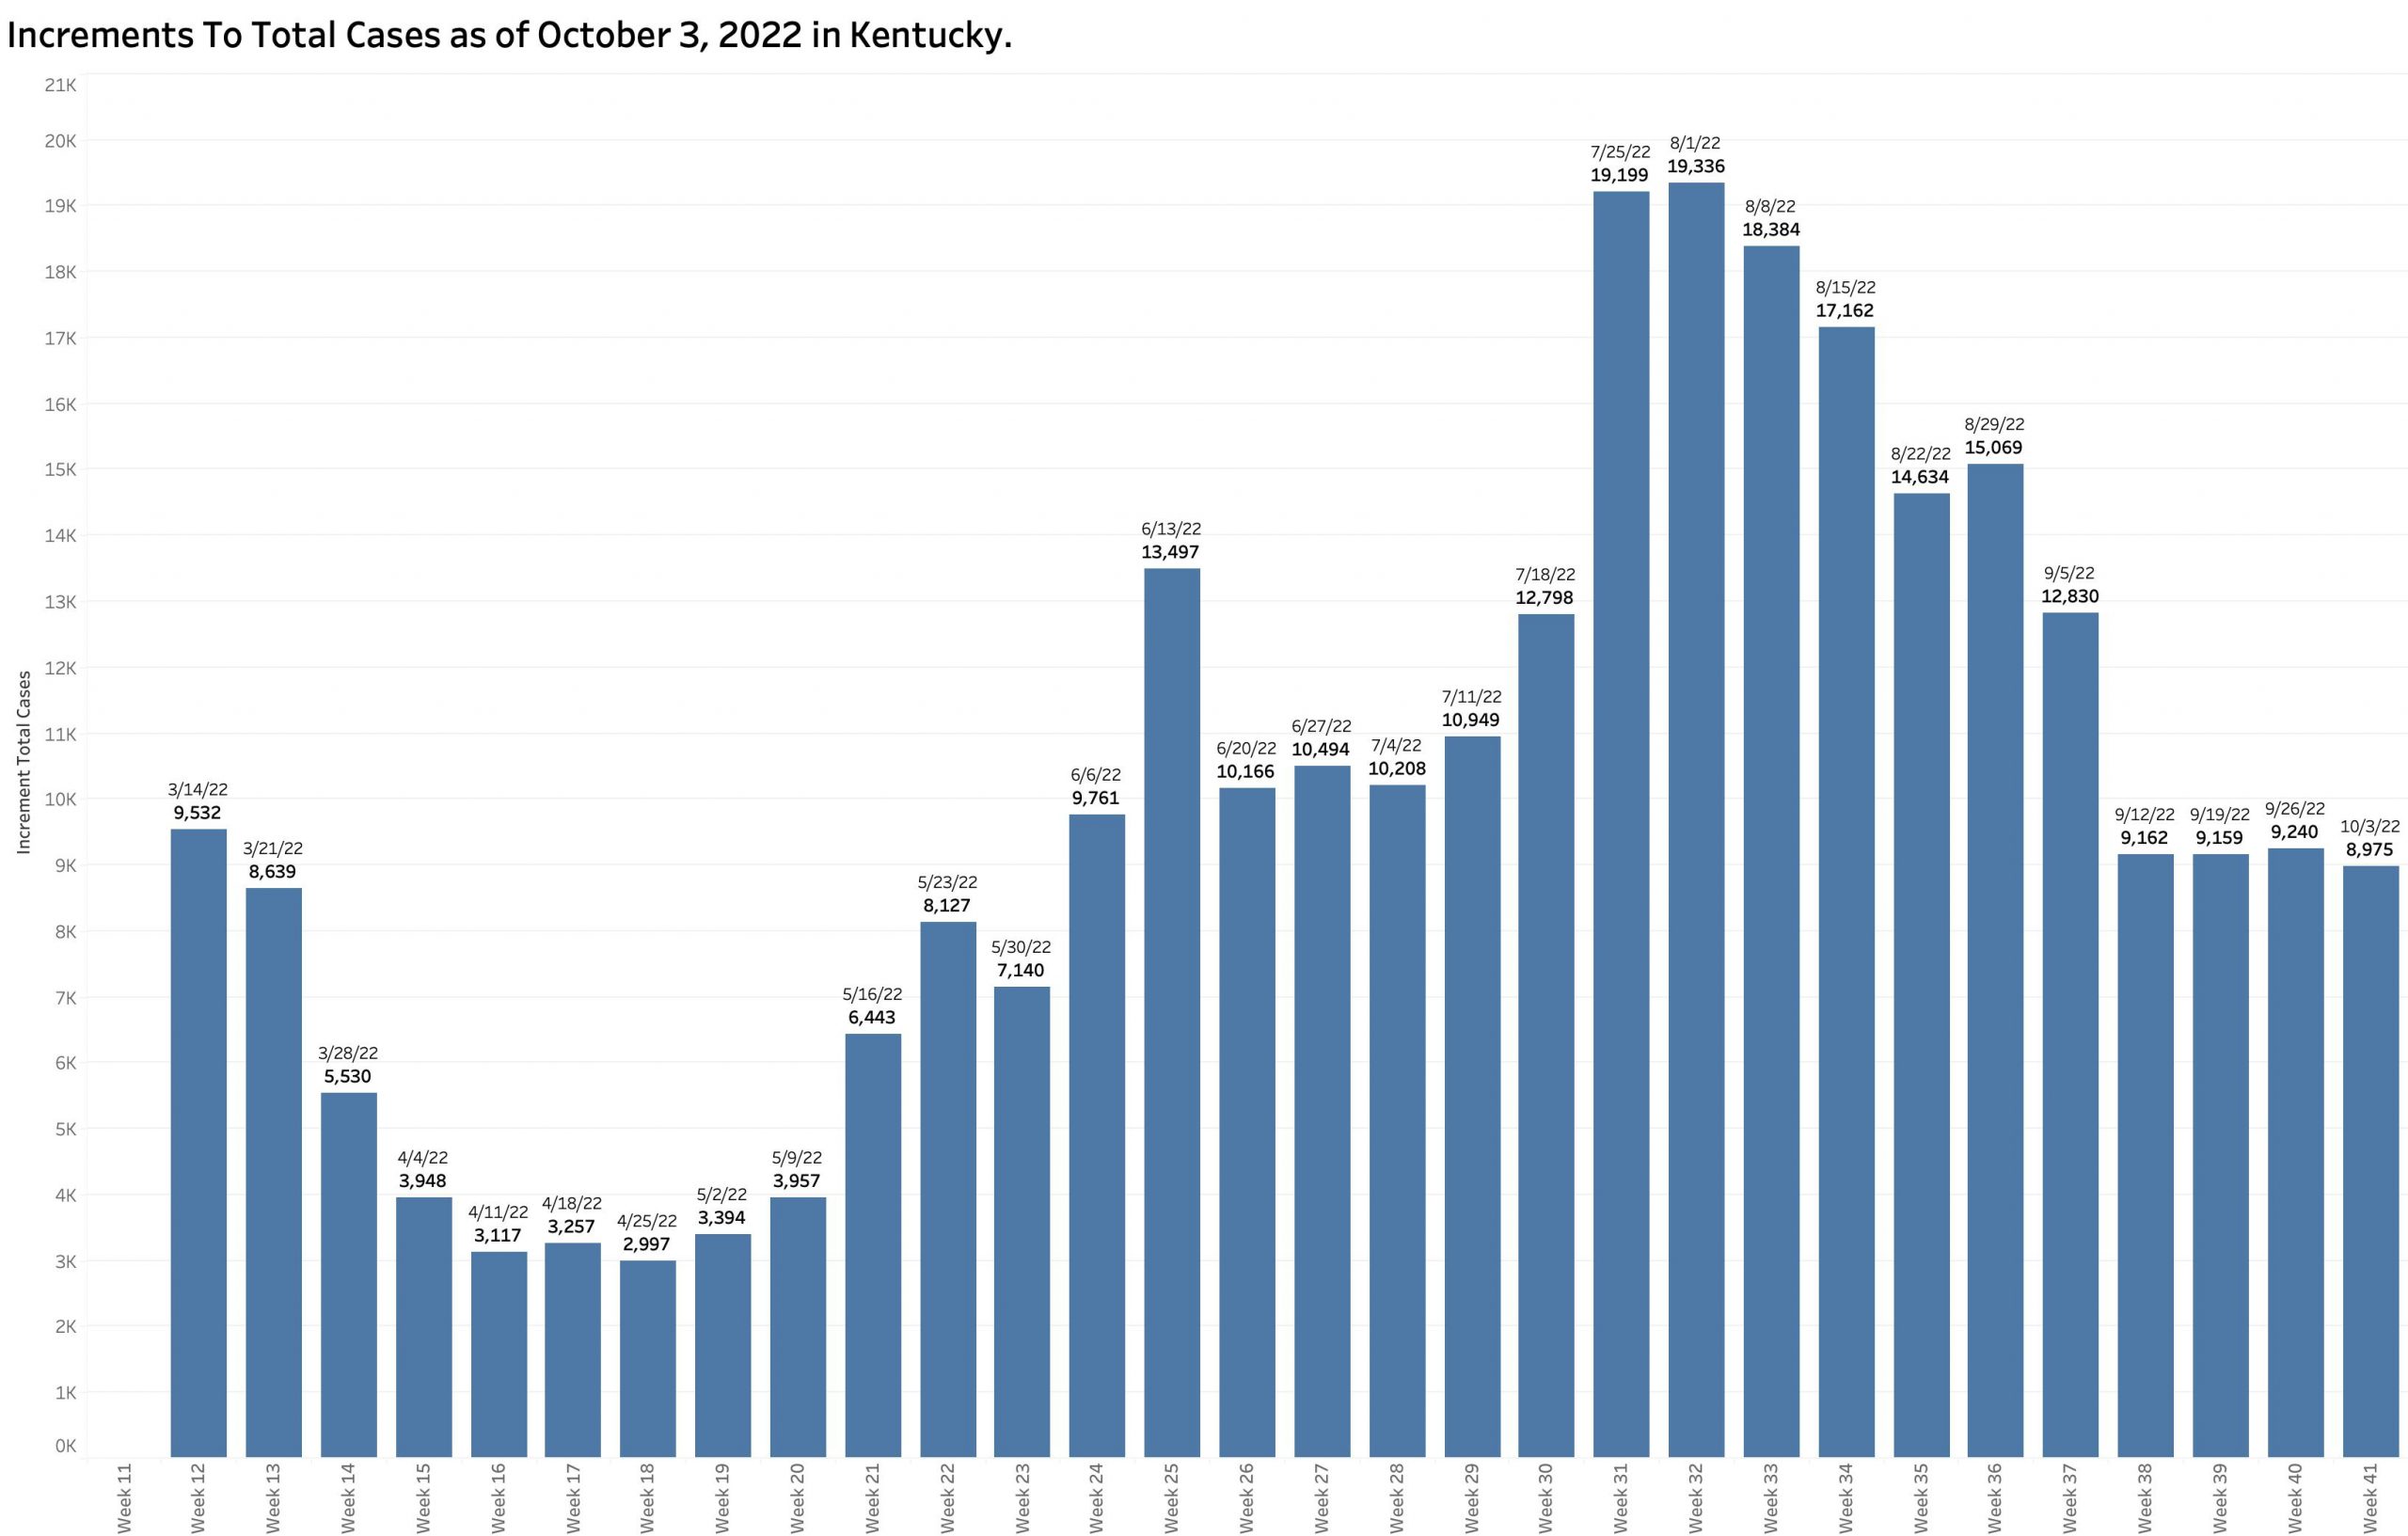
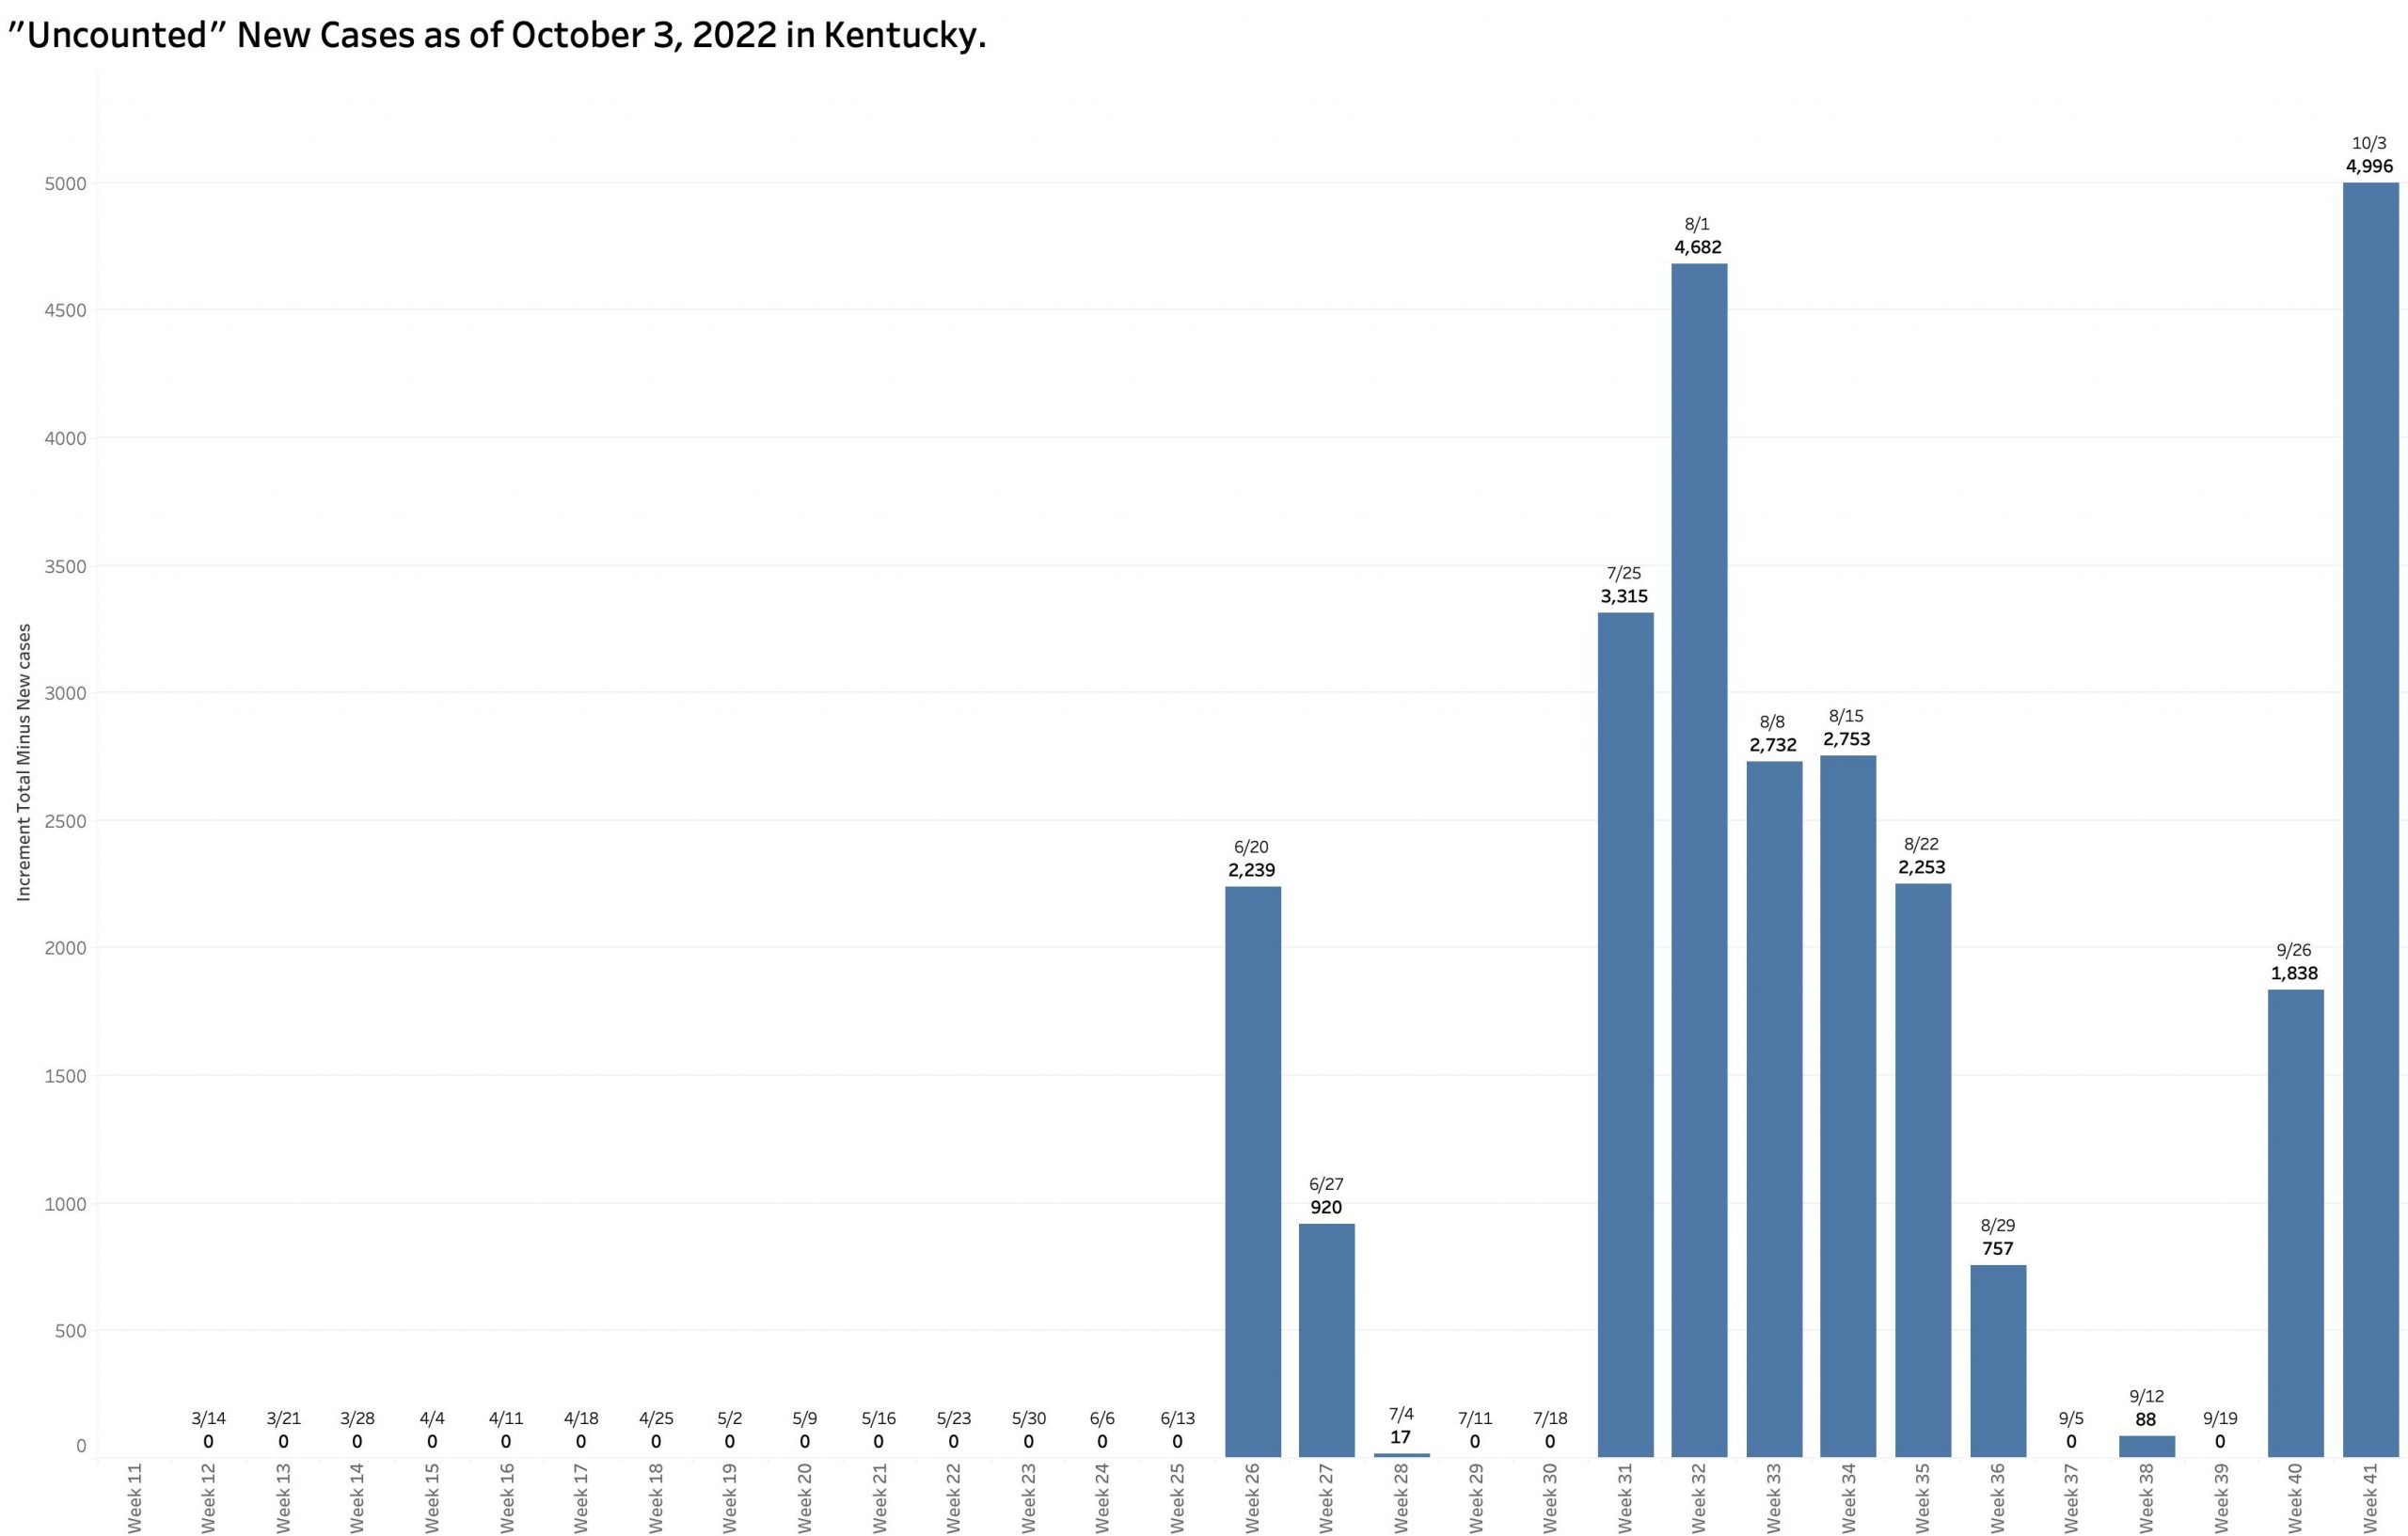
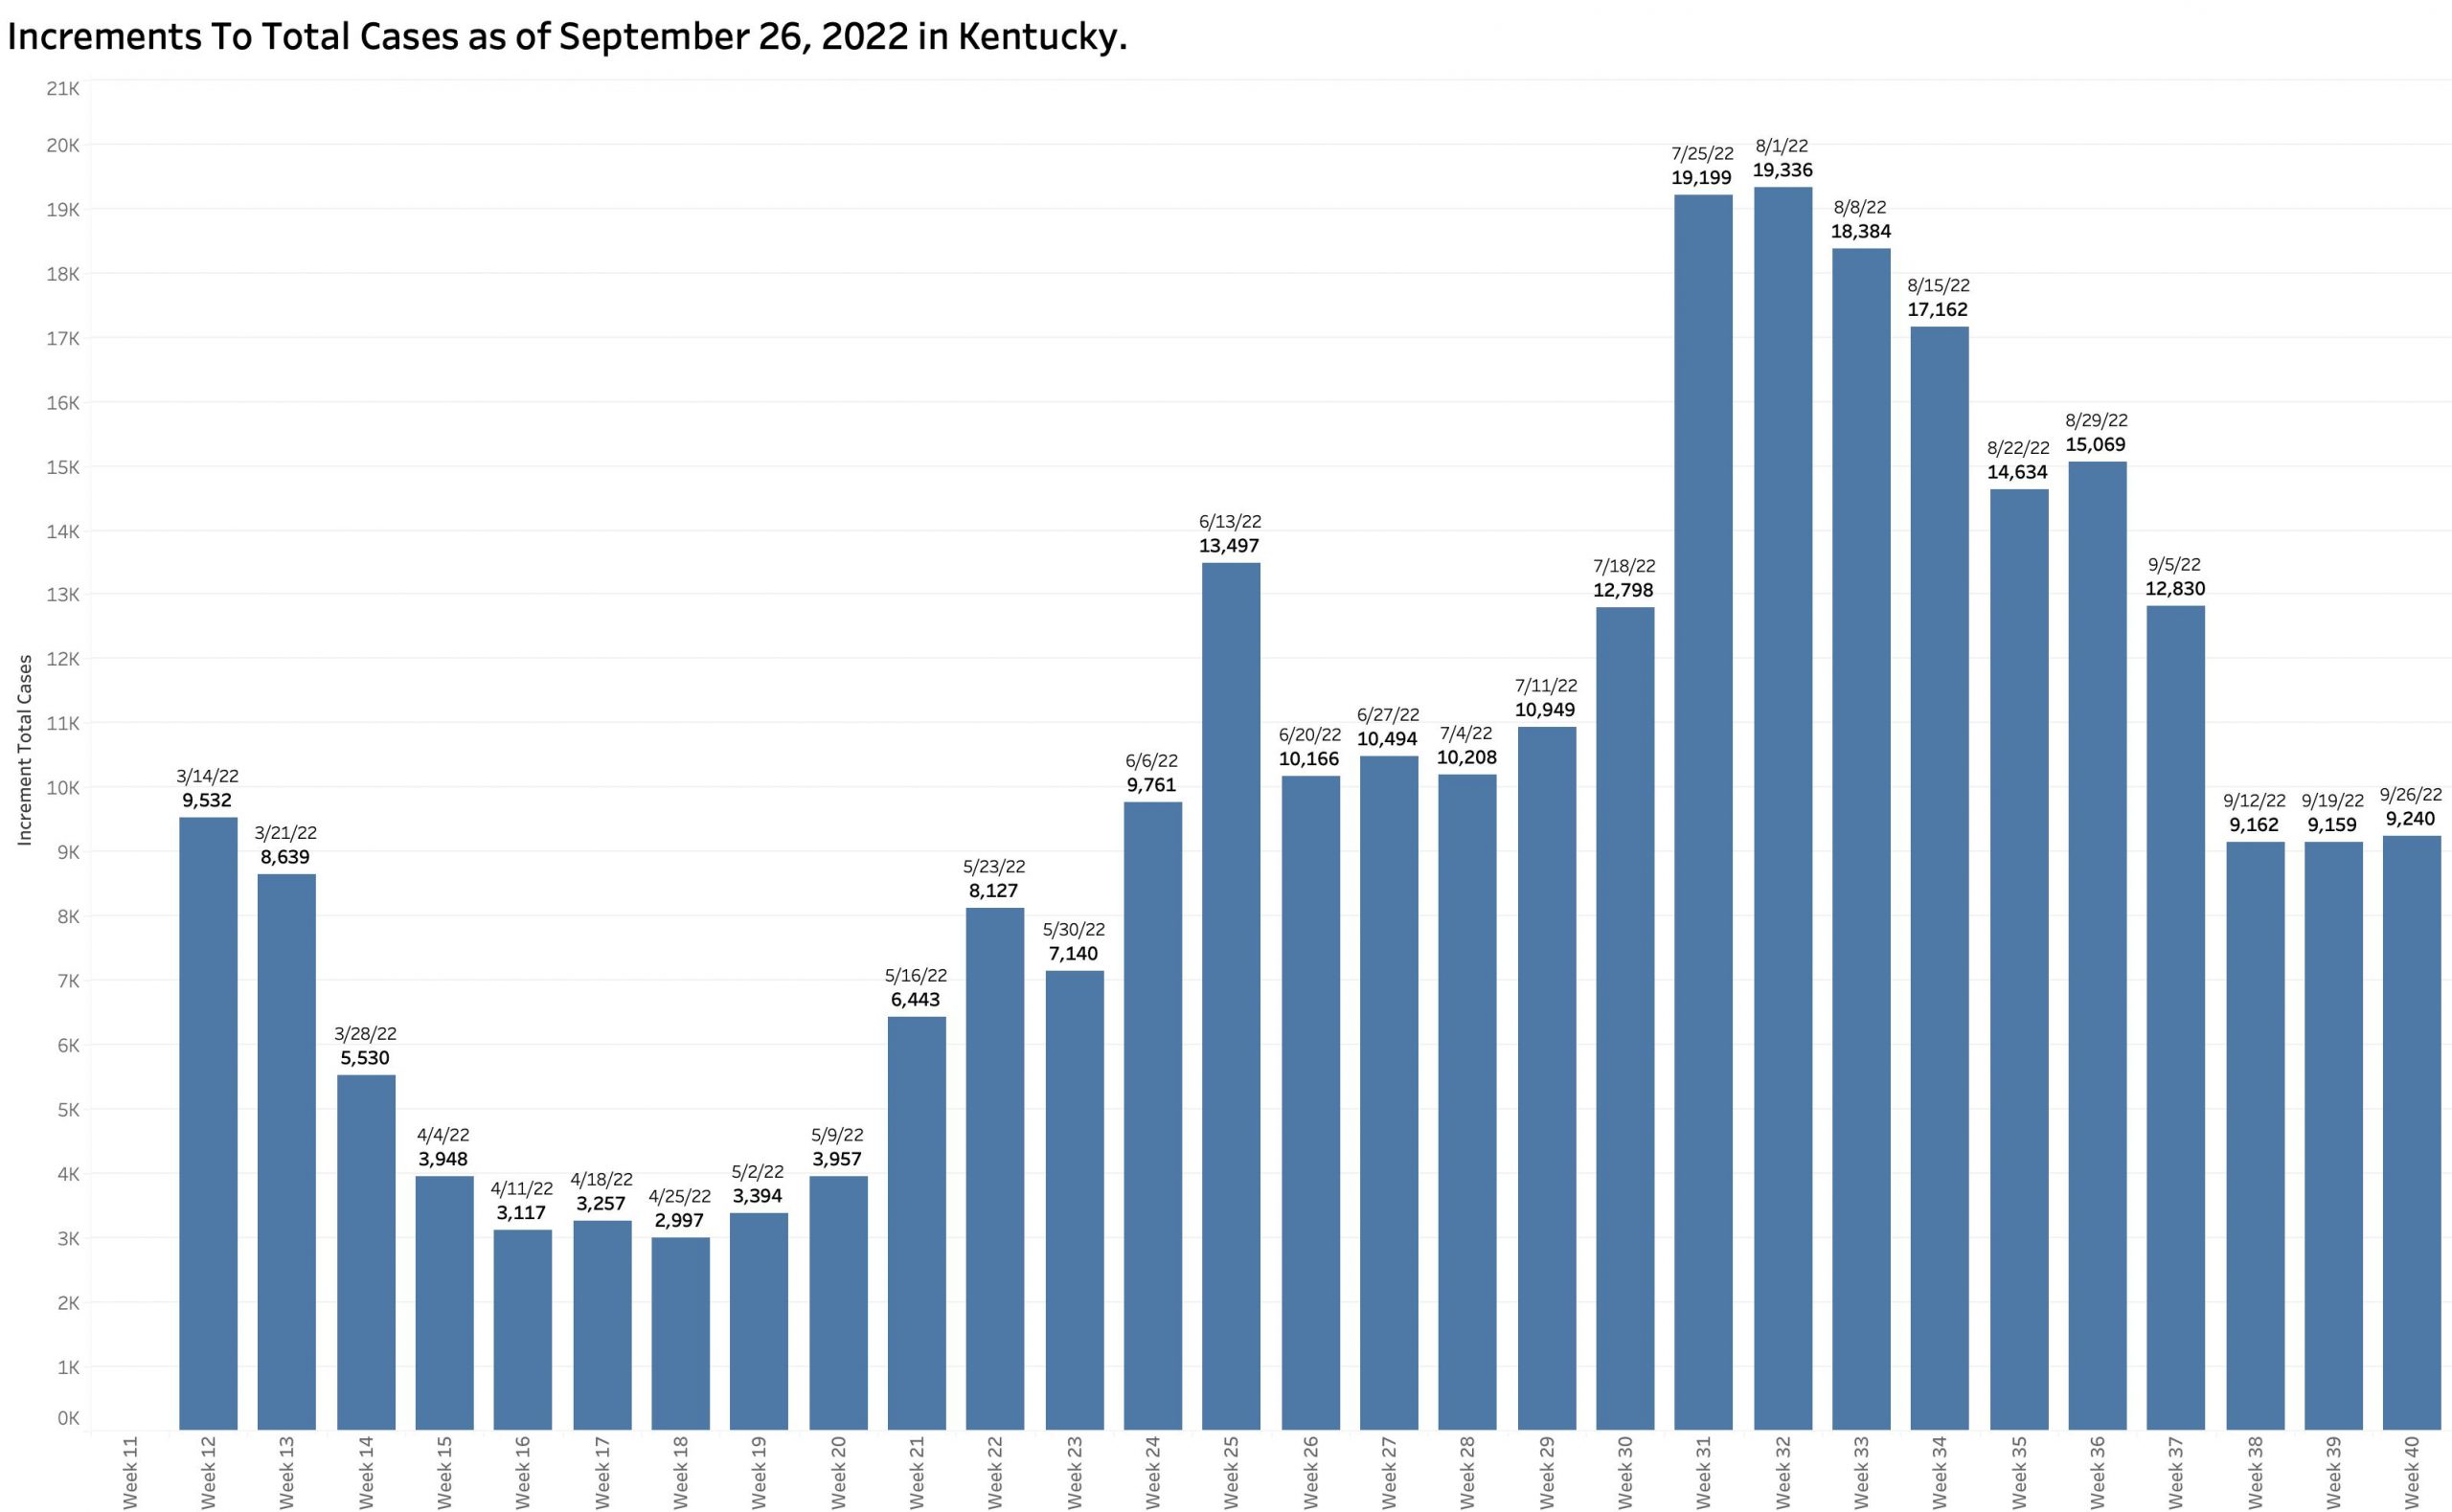
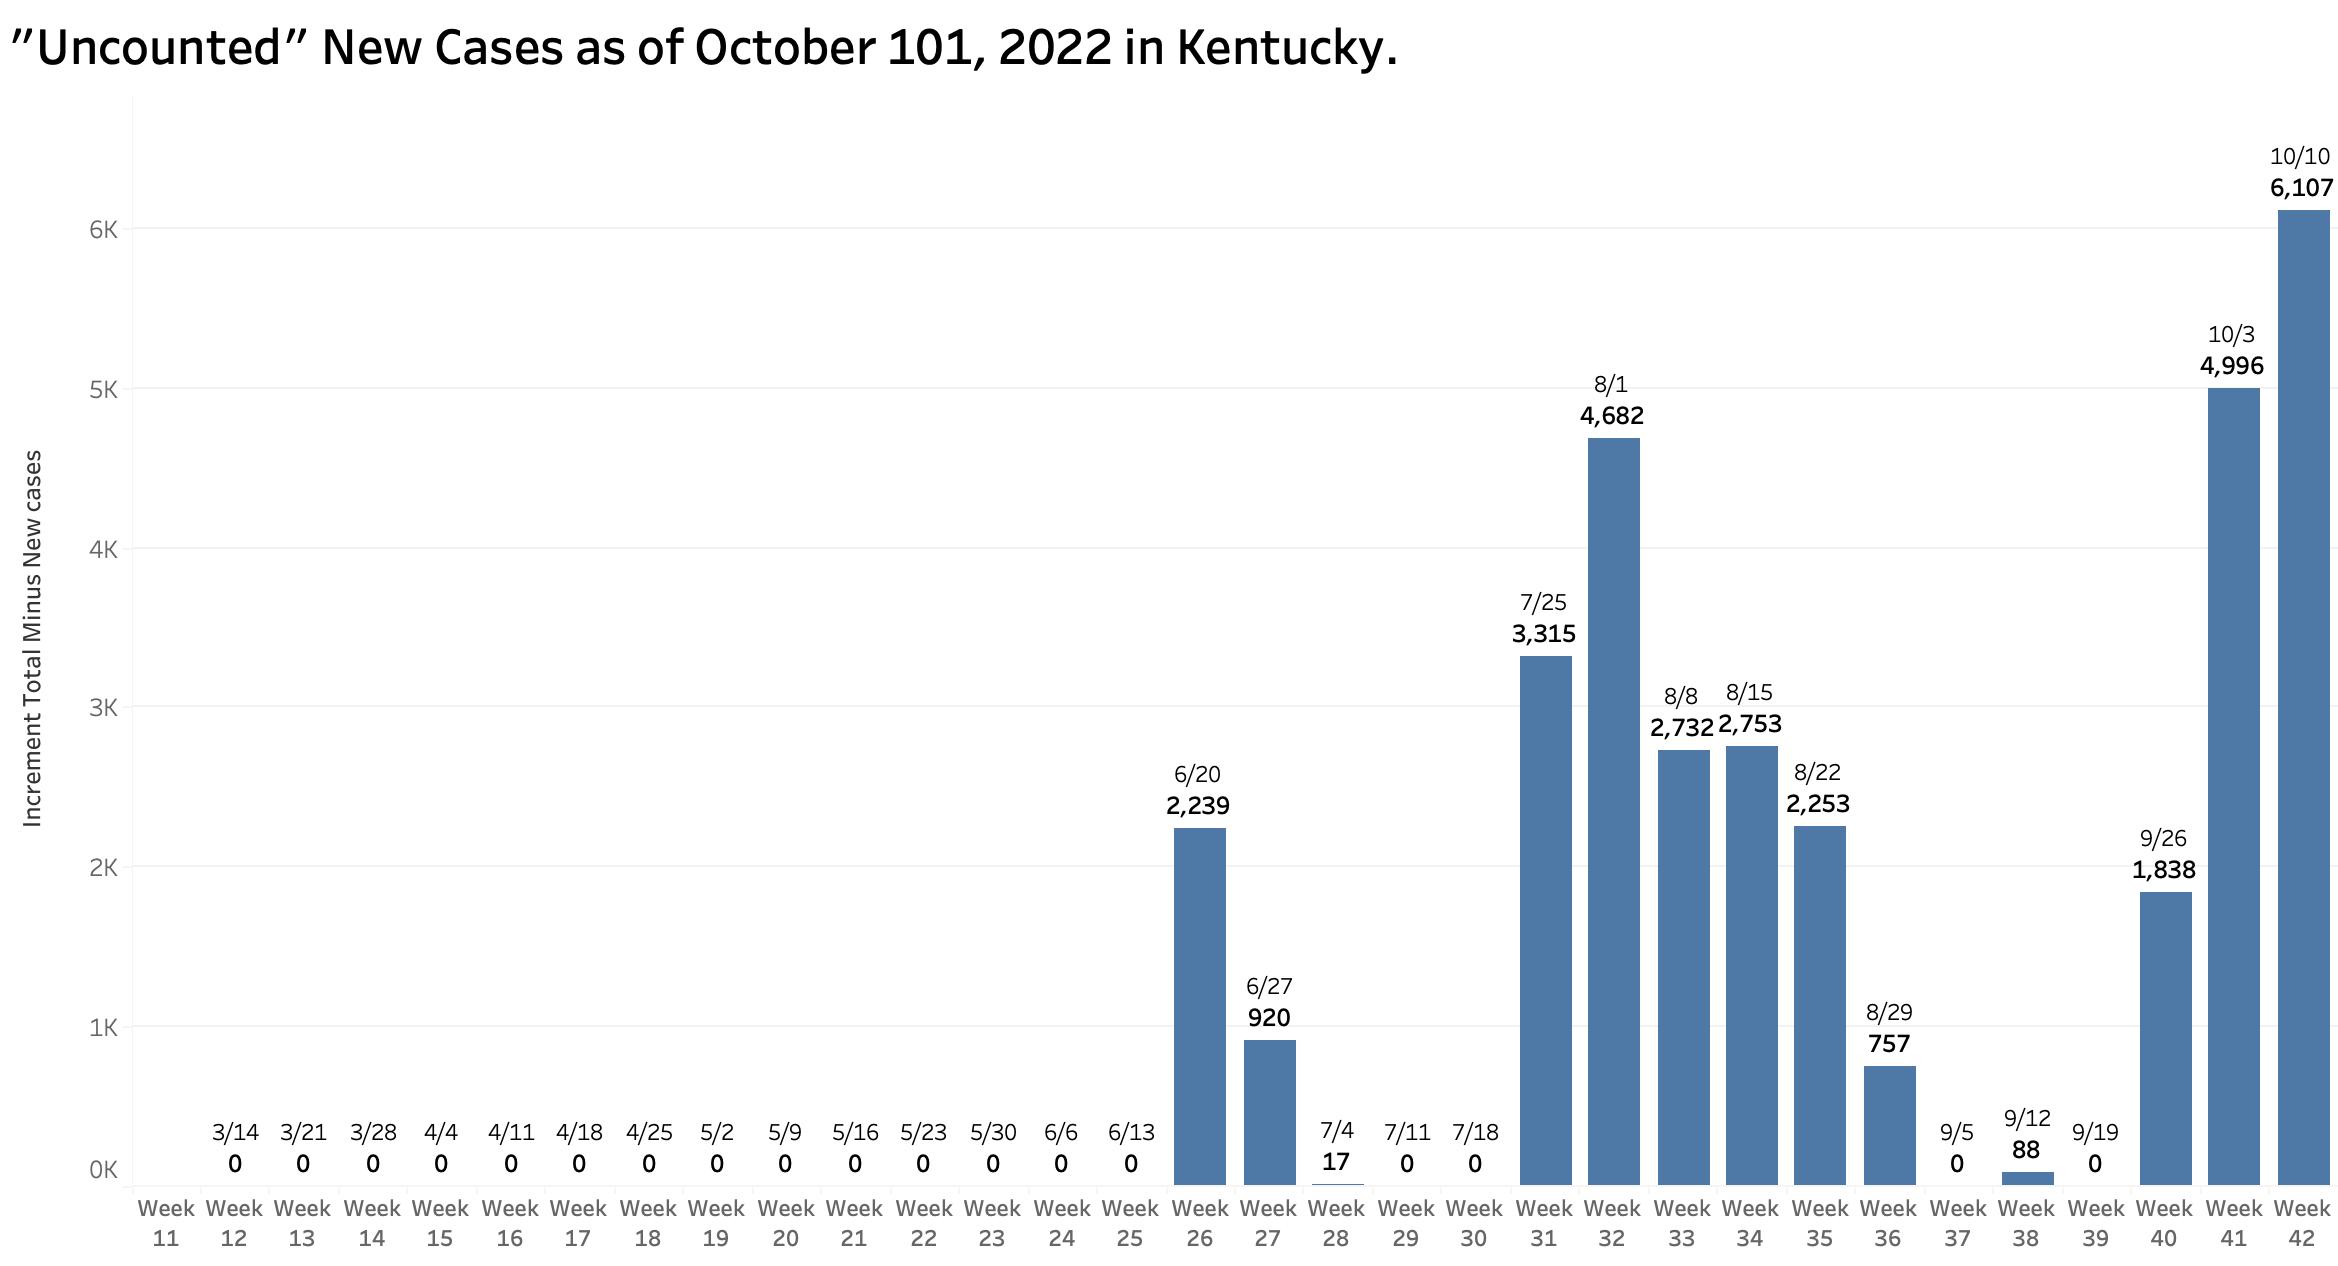
Missing new cases:
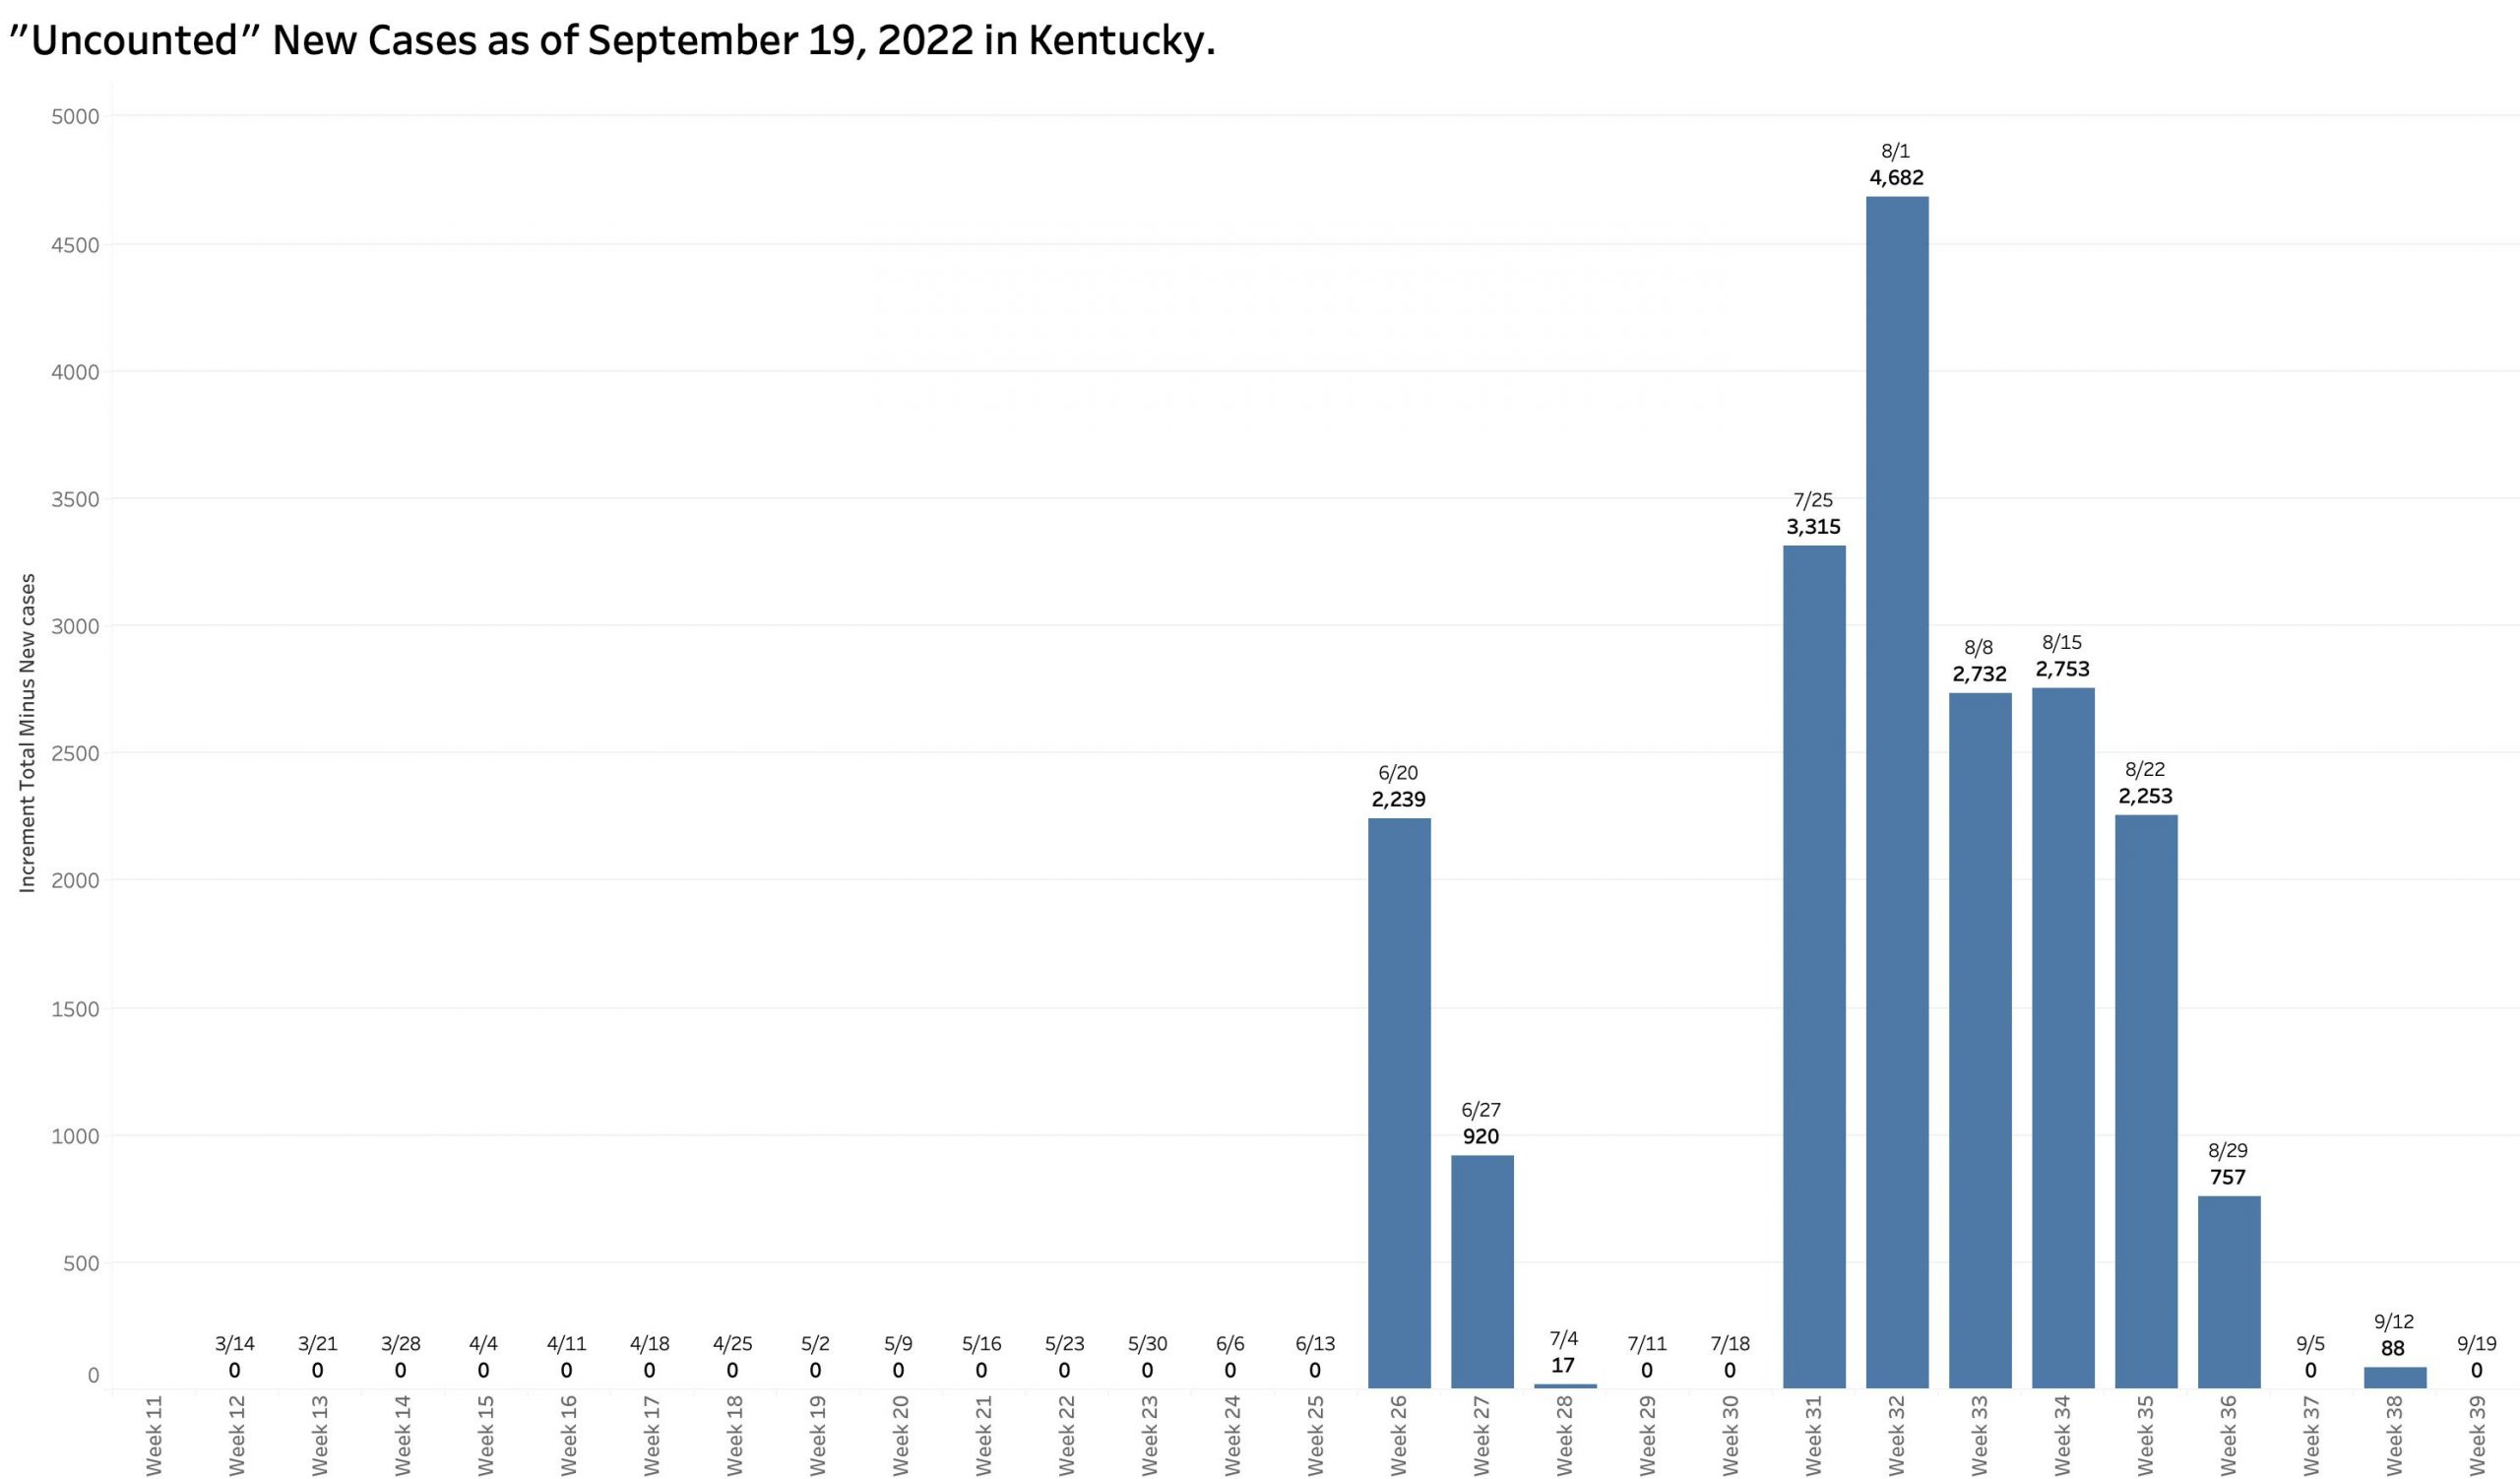
 While “new” cases as reported are declining, the additional number of previously unreported cases older than 30 days is soaring. These have been added to the aggregate total number of KY cases since at least last June but not included as “new cases” in the weekly reports. This week’s report adds a record high of 6107 previously uncounted cases to the total.  This is nearly double the number of “new” cases in the same report!   When these previously unreported cases are included in the weekly increments to total cases, there’s has been no decline in cases over the past 5 weeks. 
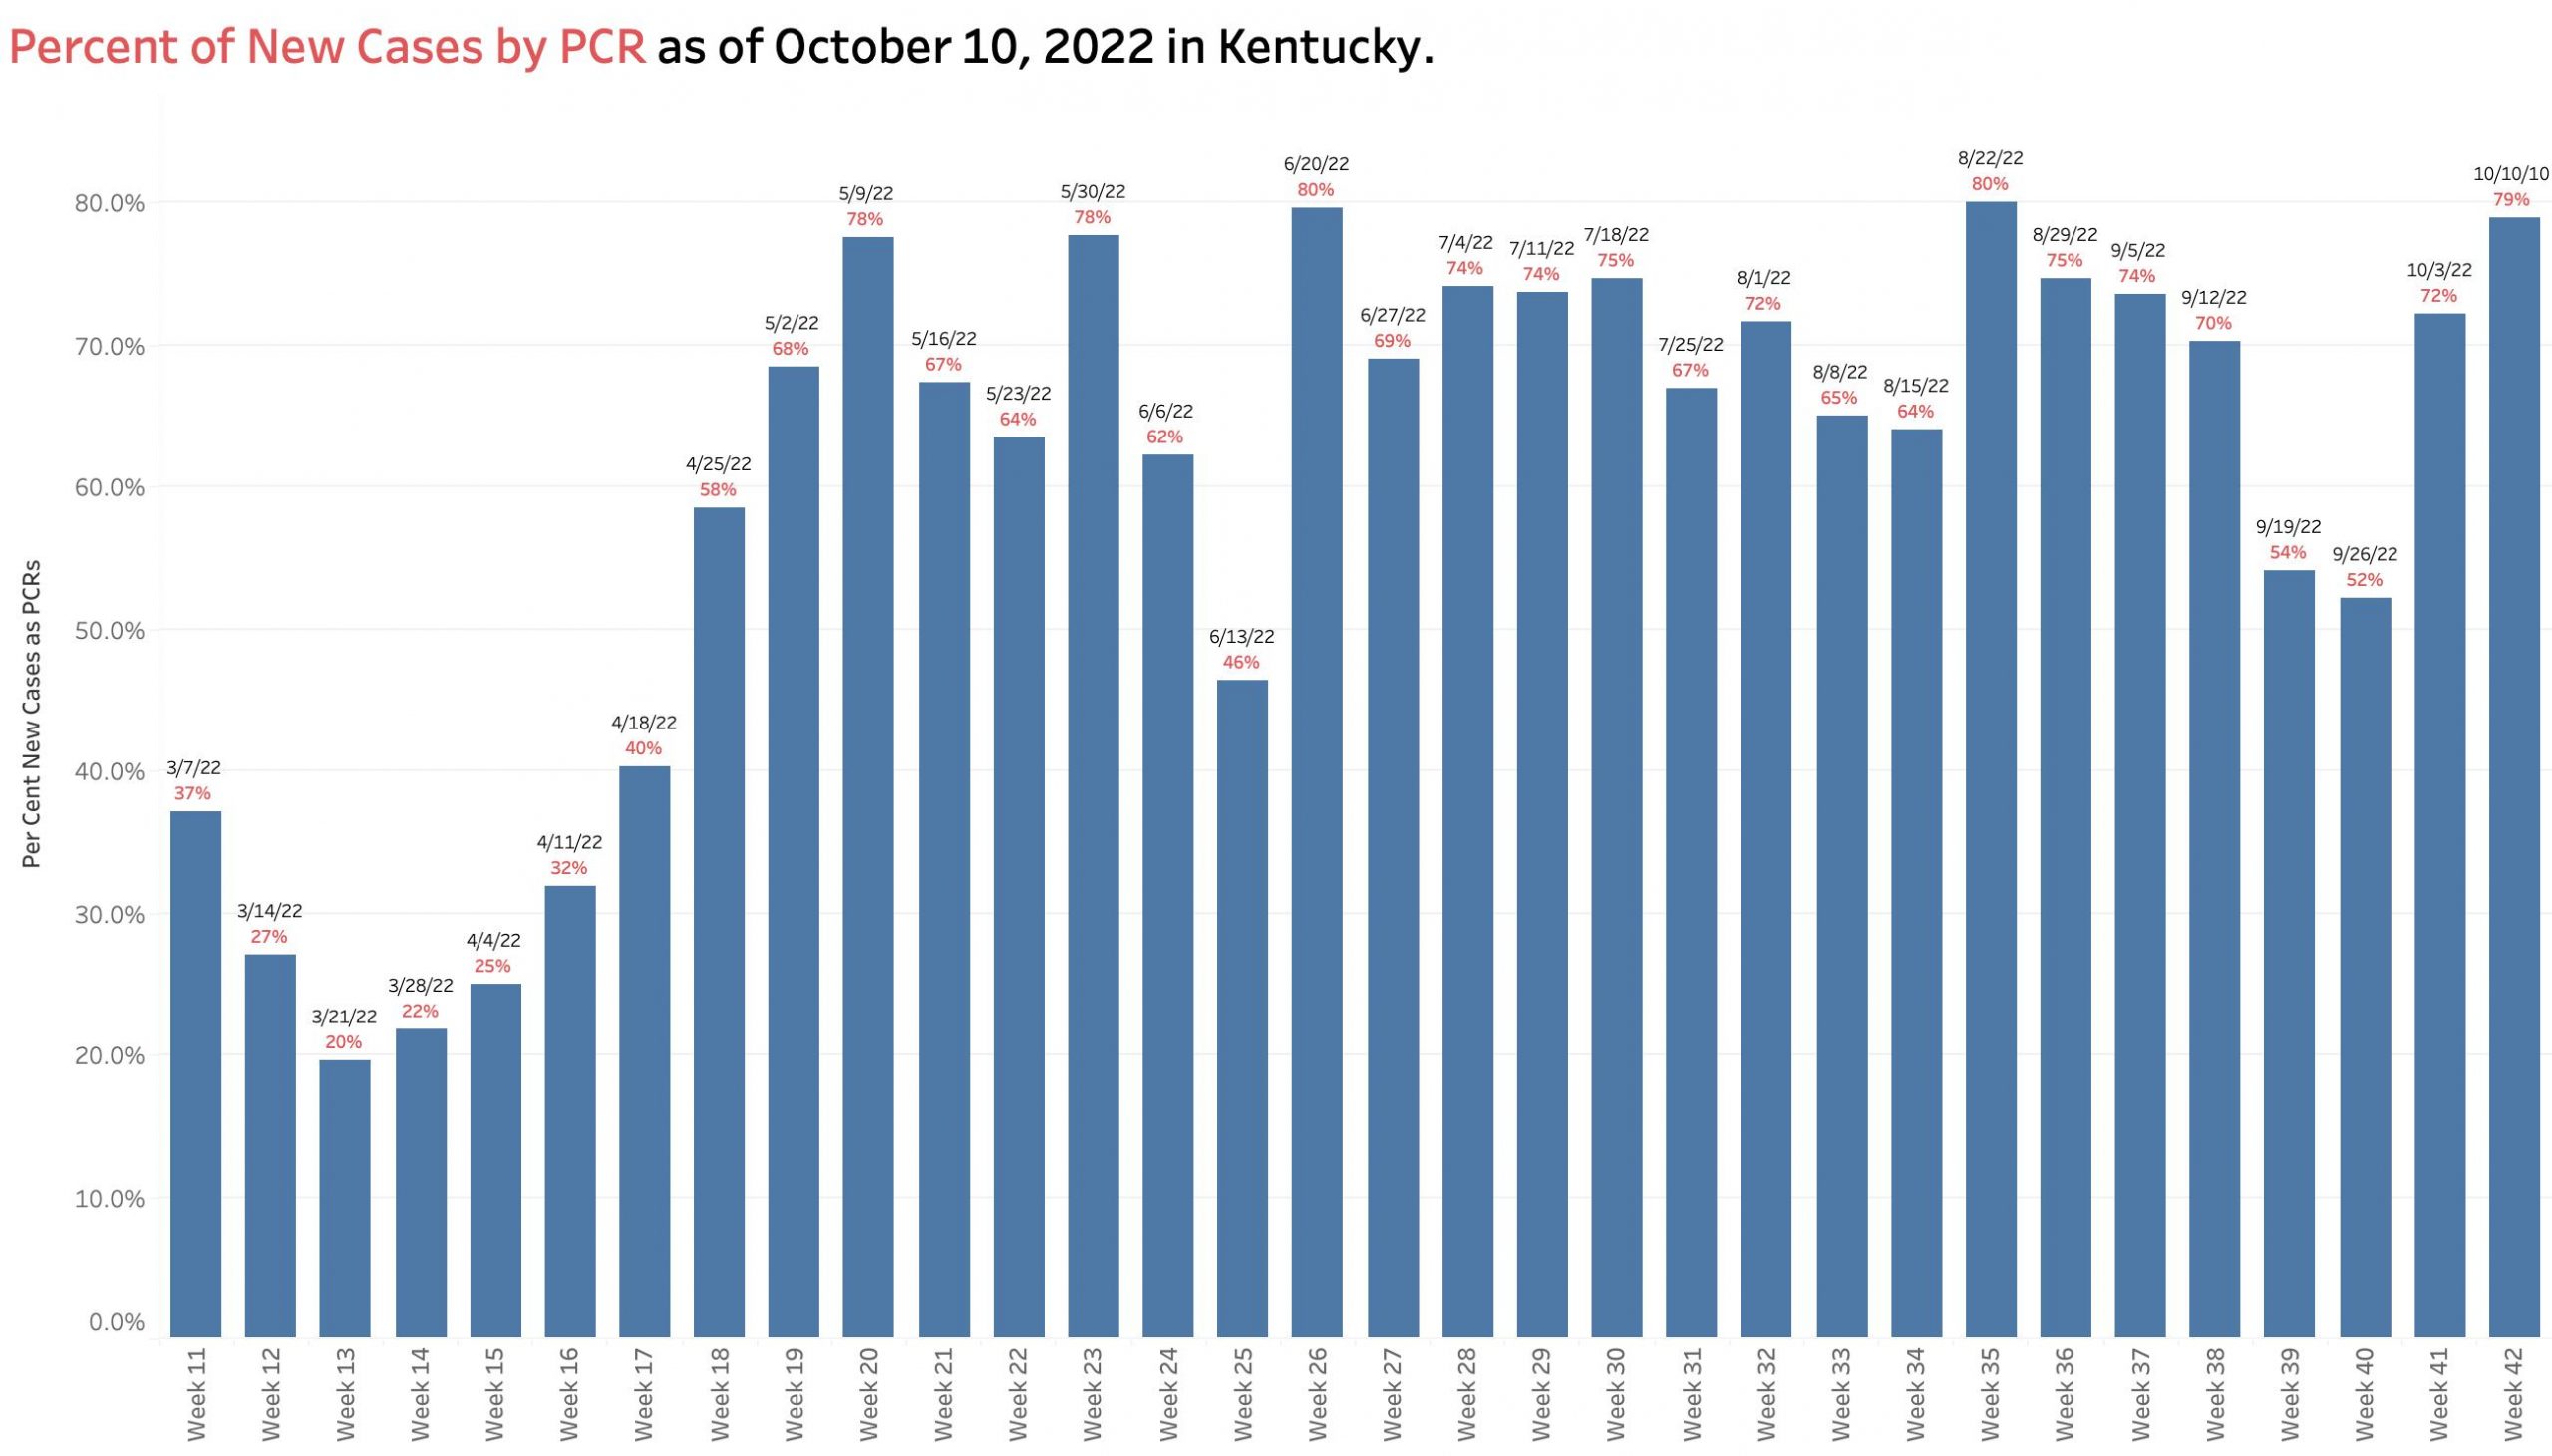
New Weekly Cases of Covid-19 listed on KYDPH report excluding unreported older cases.

Number of cases of Covid-19 added to aggregate total but not included as “new cases.”

Week over week increments of Total Cases of Covid-19.

New Cases Defined:
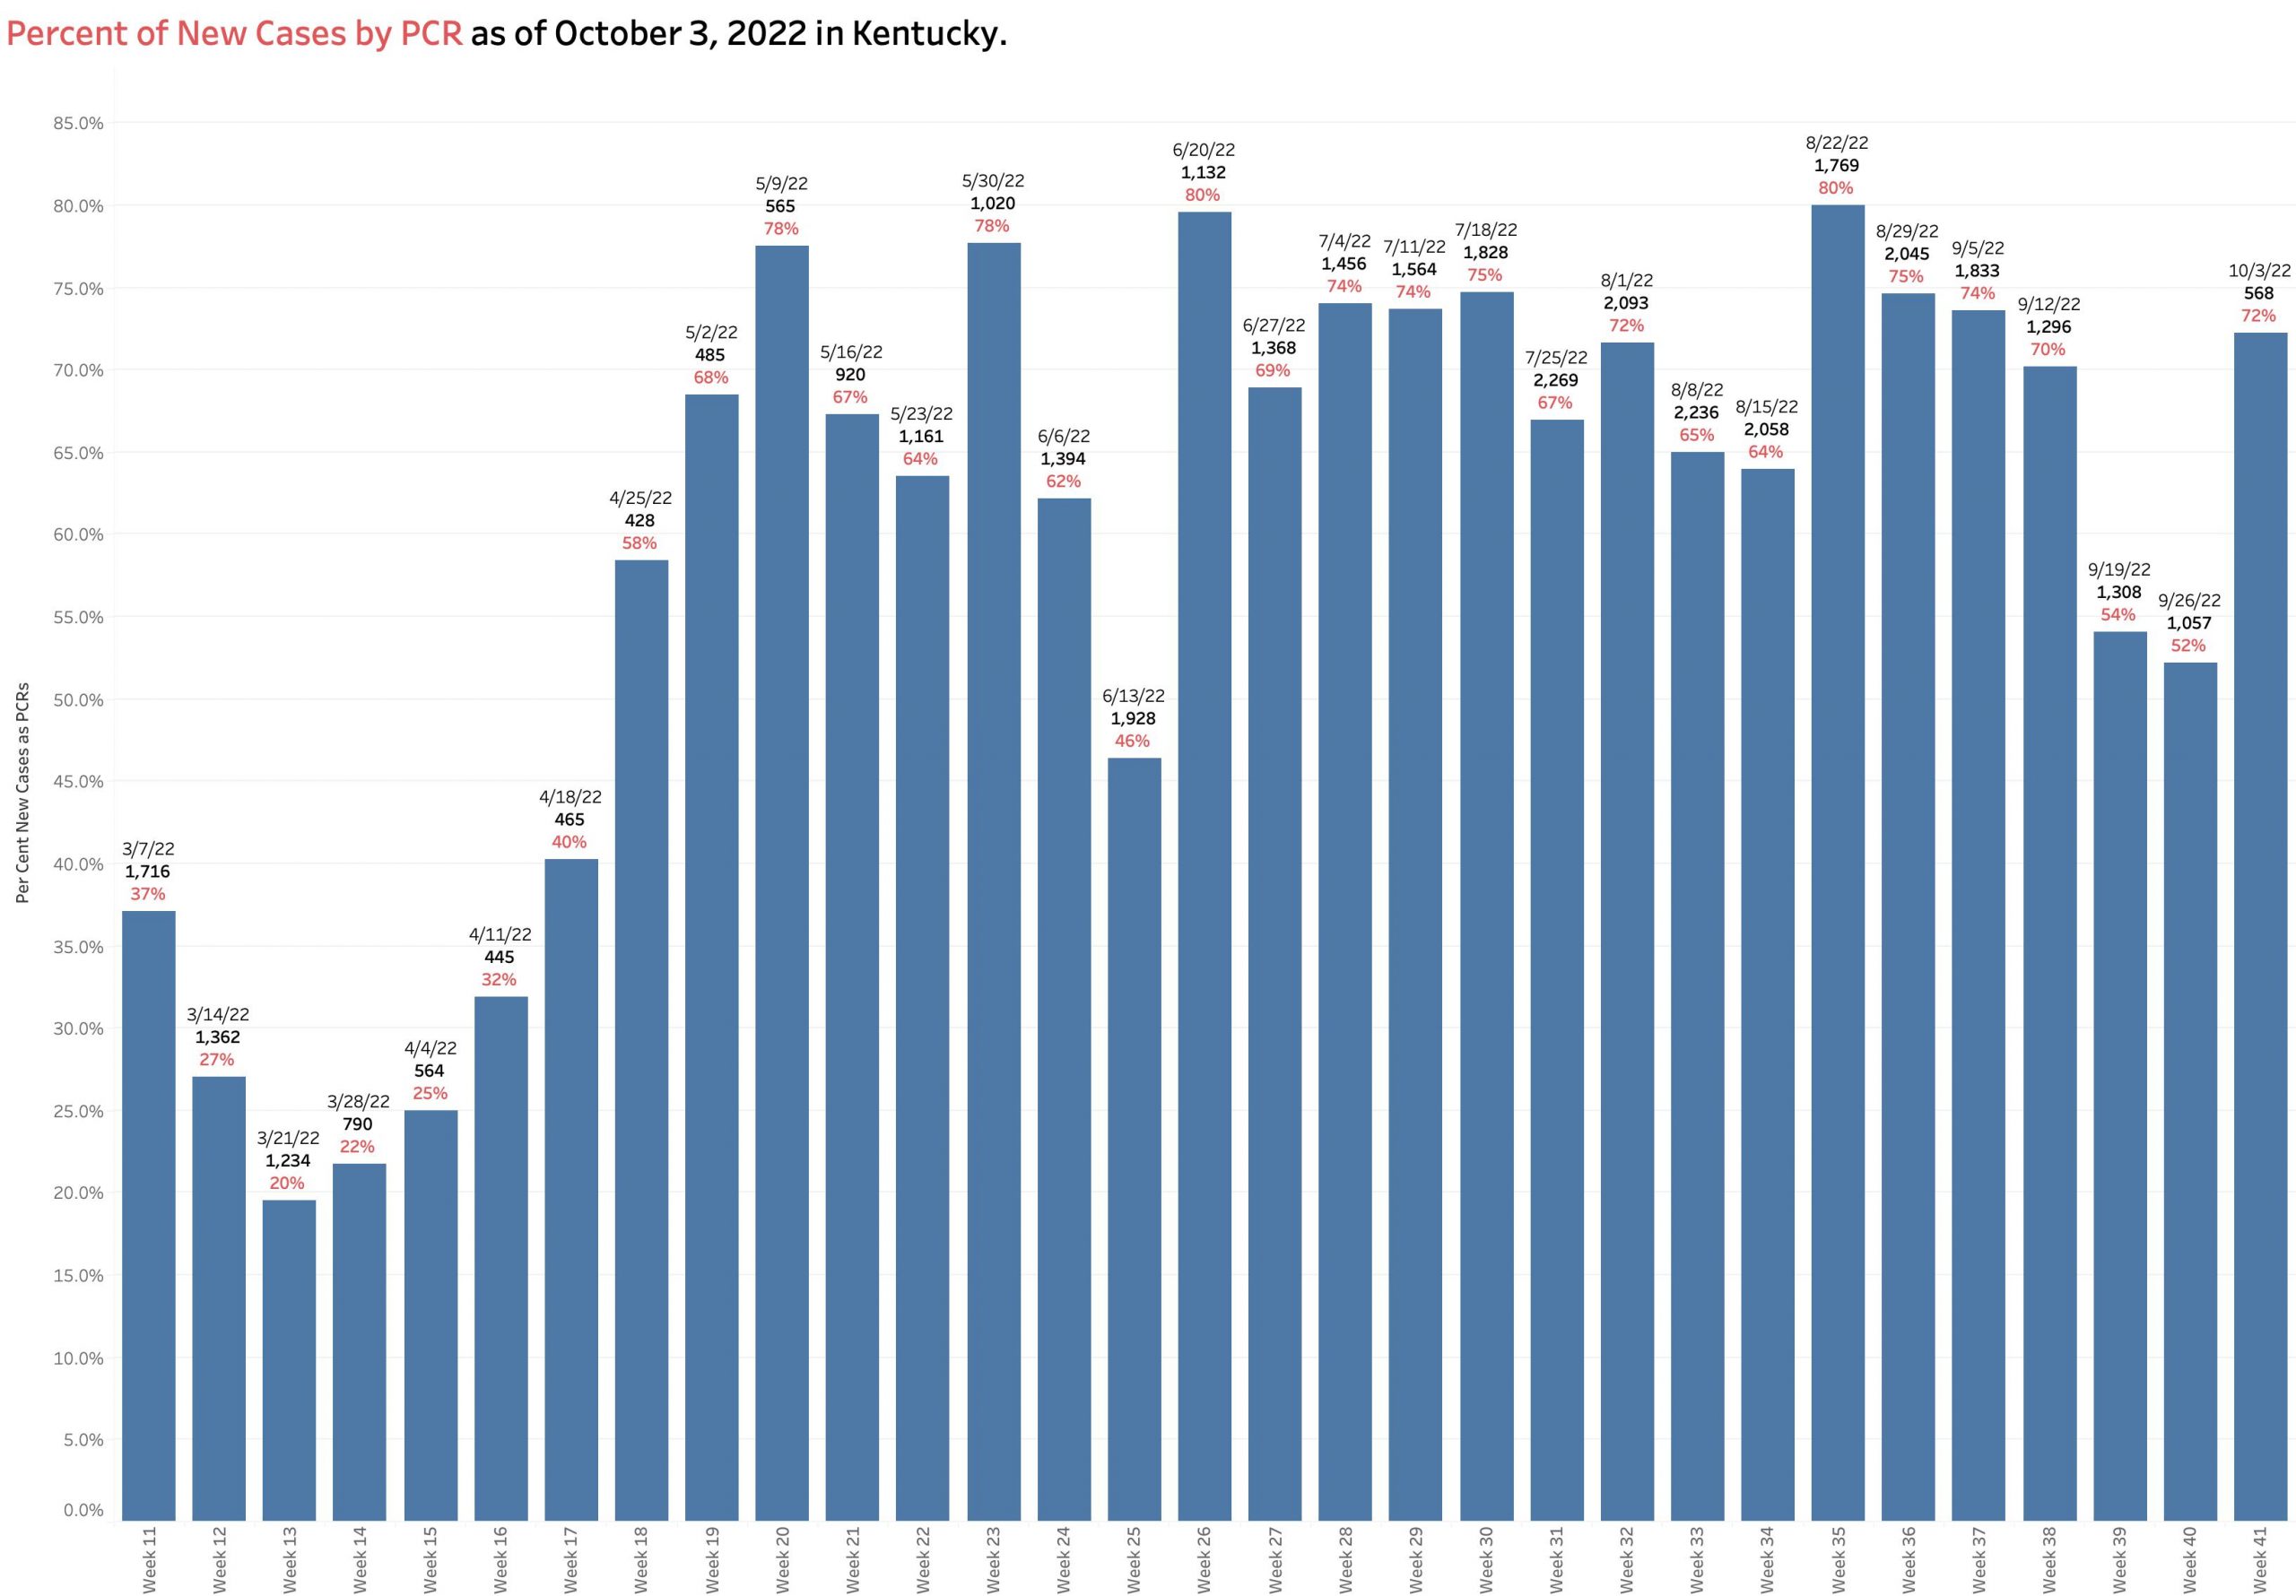
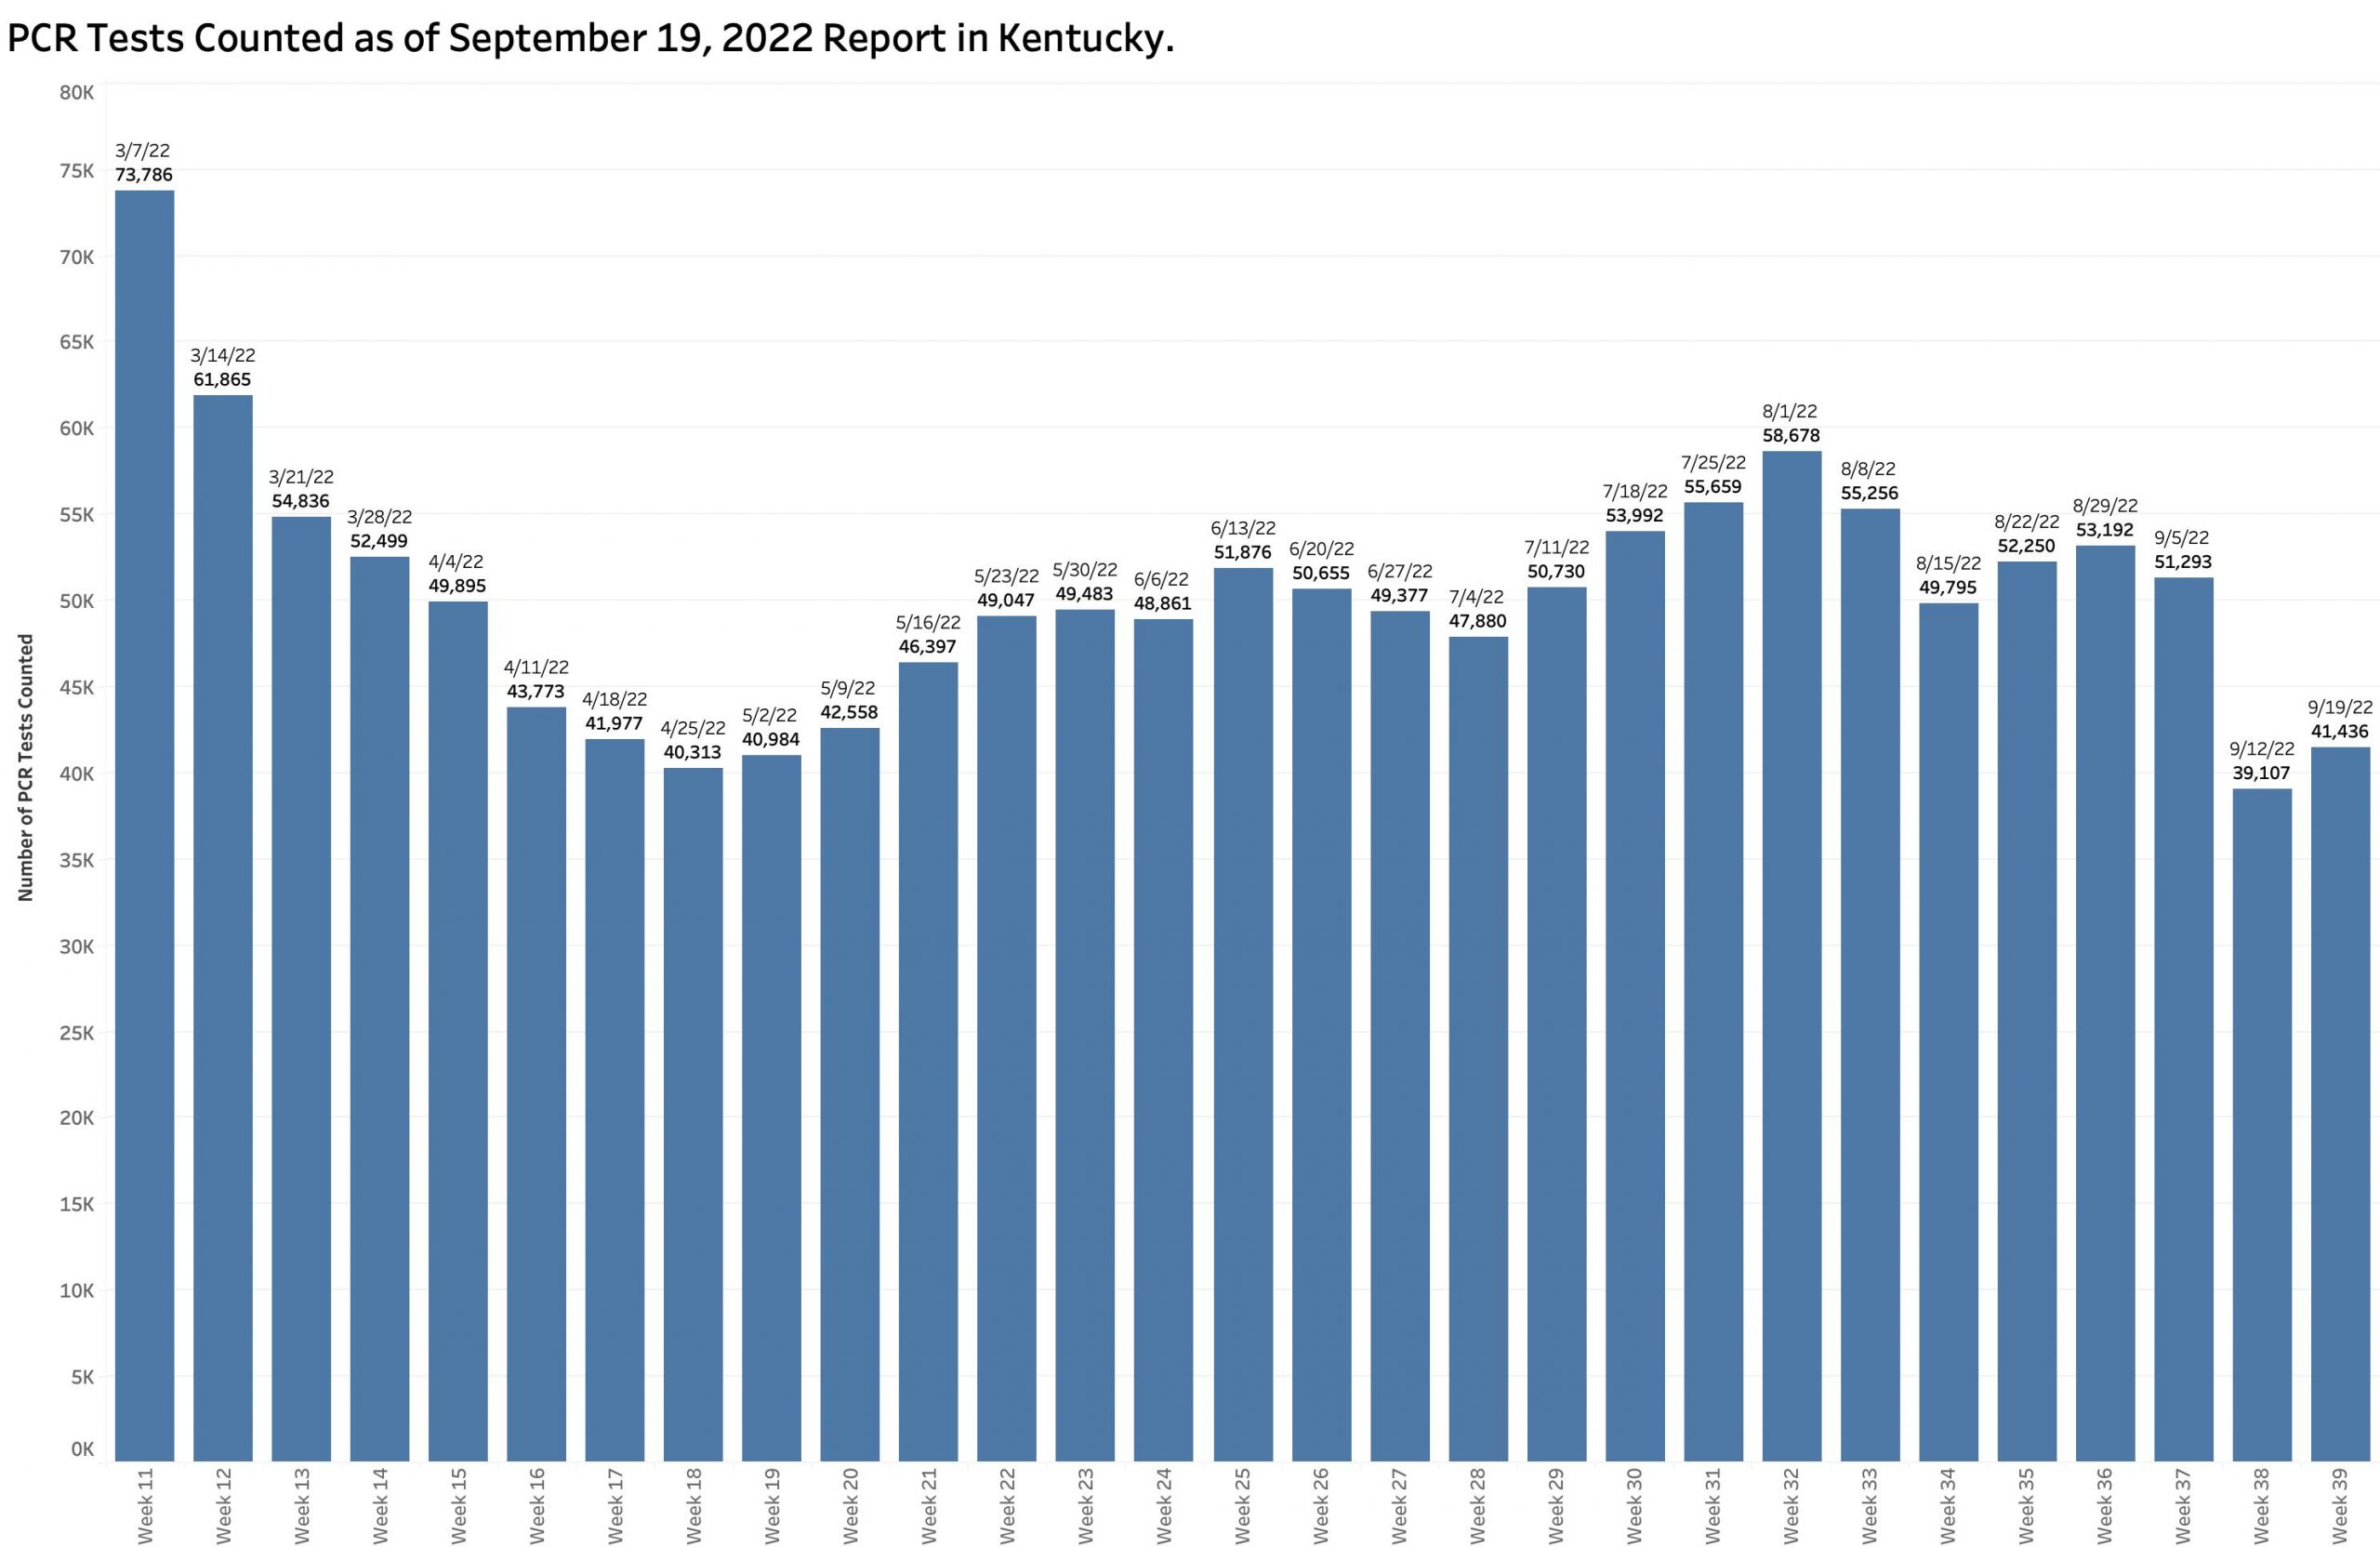
Current “new” cases are derived from a restricted small pool of Kentuckians– largely only those whose viral PCR tests are reported electronically to the state.  Antigen tests done at home, in offices, or in schools are presumably disregarded.  PCR tests not reported with approved connections, or cases diagnosed clinically are similarly not included.  For example, 79% of new cases this week were derived from the reported PCR pool.  This is as high a percentage as ever and several multiples higher than in March when weekly reporting was begun. 


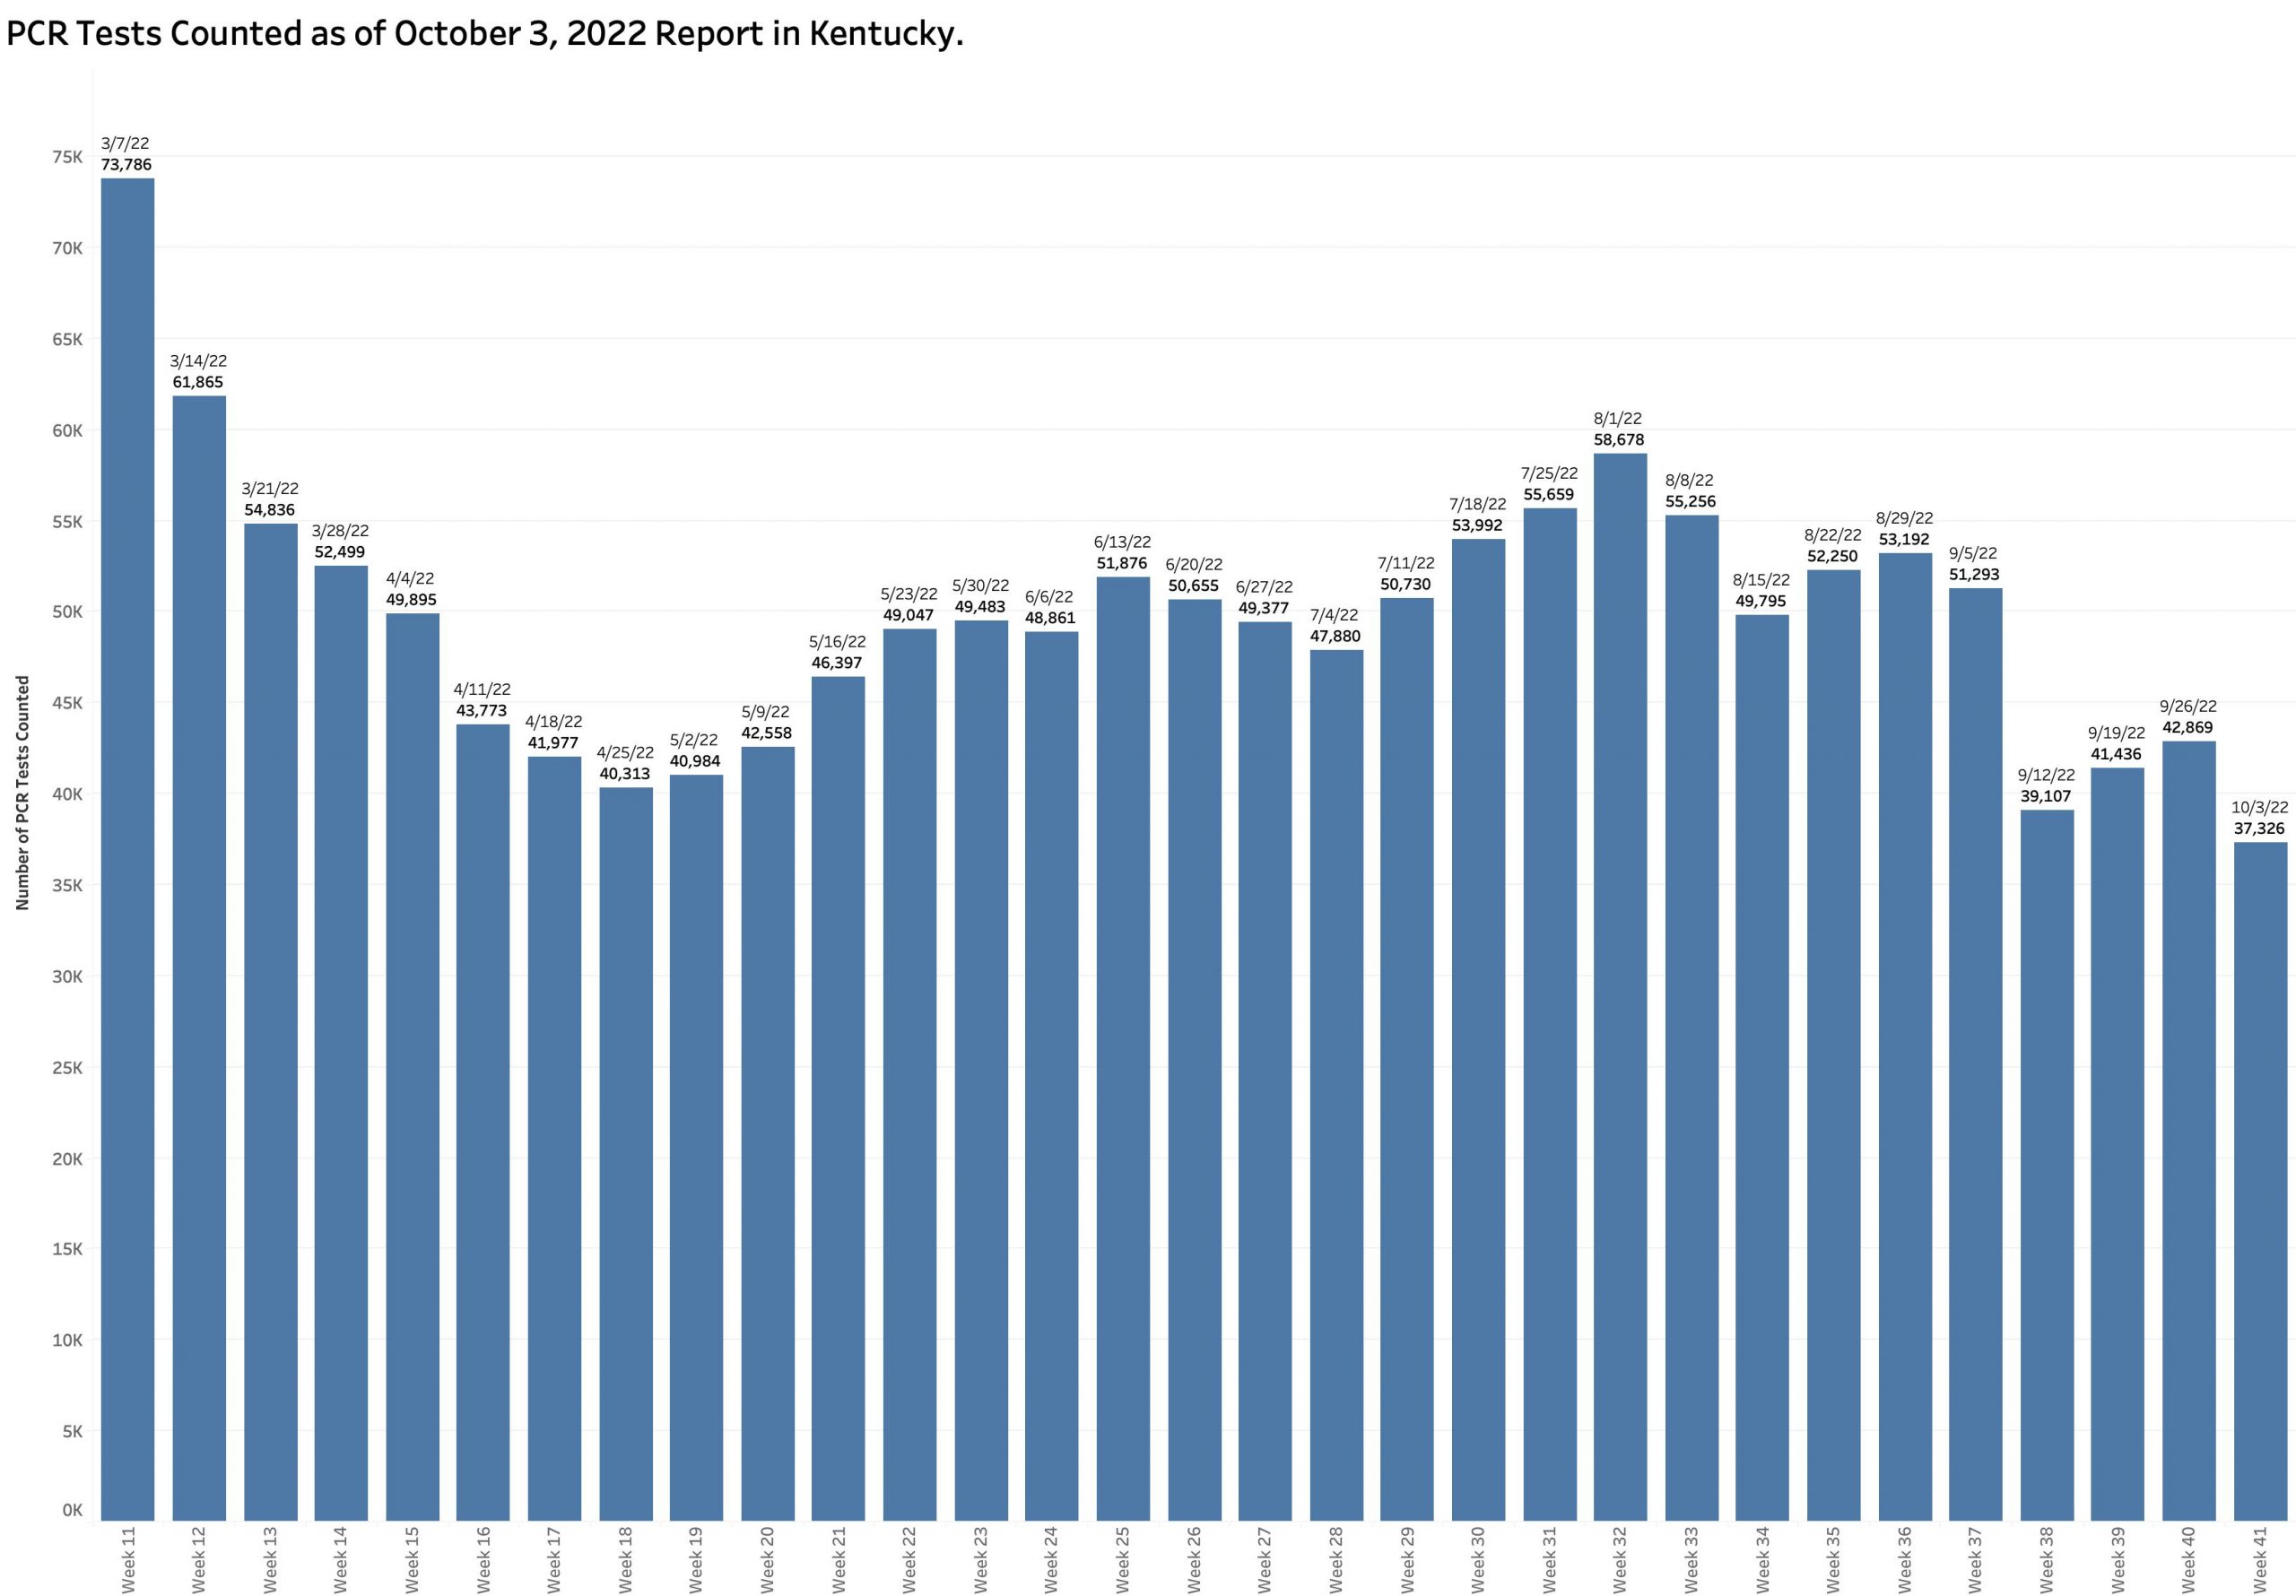
Another factor allowing a new case count to be artifactually low is that the overall number of PCR tests reported electronically is lower than at any point since May and continues to fall. The pool of individuals used as a basis for determination of disease activity is much decreased.

Number of PCR tests reported and thus as for basis of calculating Test Positivity rate.

Is Kentucky as a state doing comparatively poorly with its epidemic?
Or is there no way to make a fair comparison any more? I am forced to conclude that the numbers of cases reported directly from the KY Department of Public Health is unreliable. I do not know how the New York Times gets its numbers but their updates were better than the CDC’s for much of the early pandemic and I have always relied on them for national historical comparisons.  Yesterday’s NYT updates has KY standing out clearly as having the highest incidence rate per 100K of any state or territory.  Of all the counties in the nation, 15 of the 25 with the highest incidence rates are in Kentucky!  Something is not computing in my aging mind.  What am I missing?

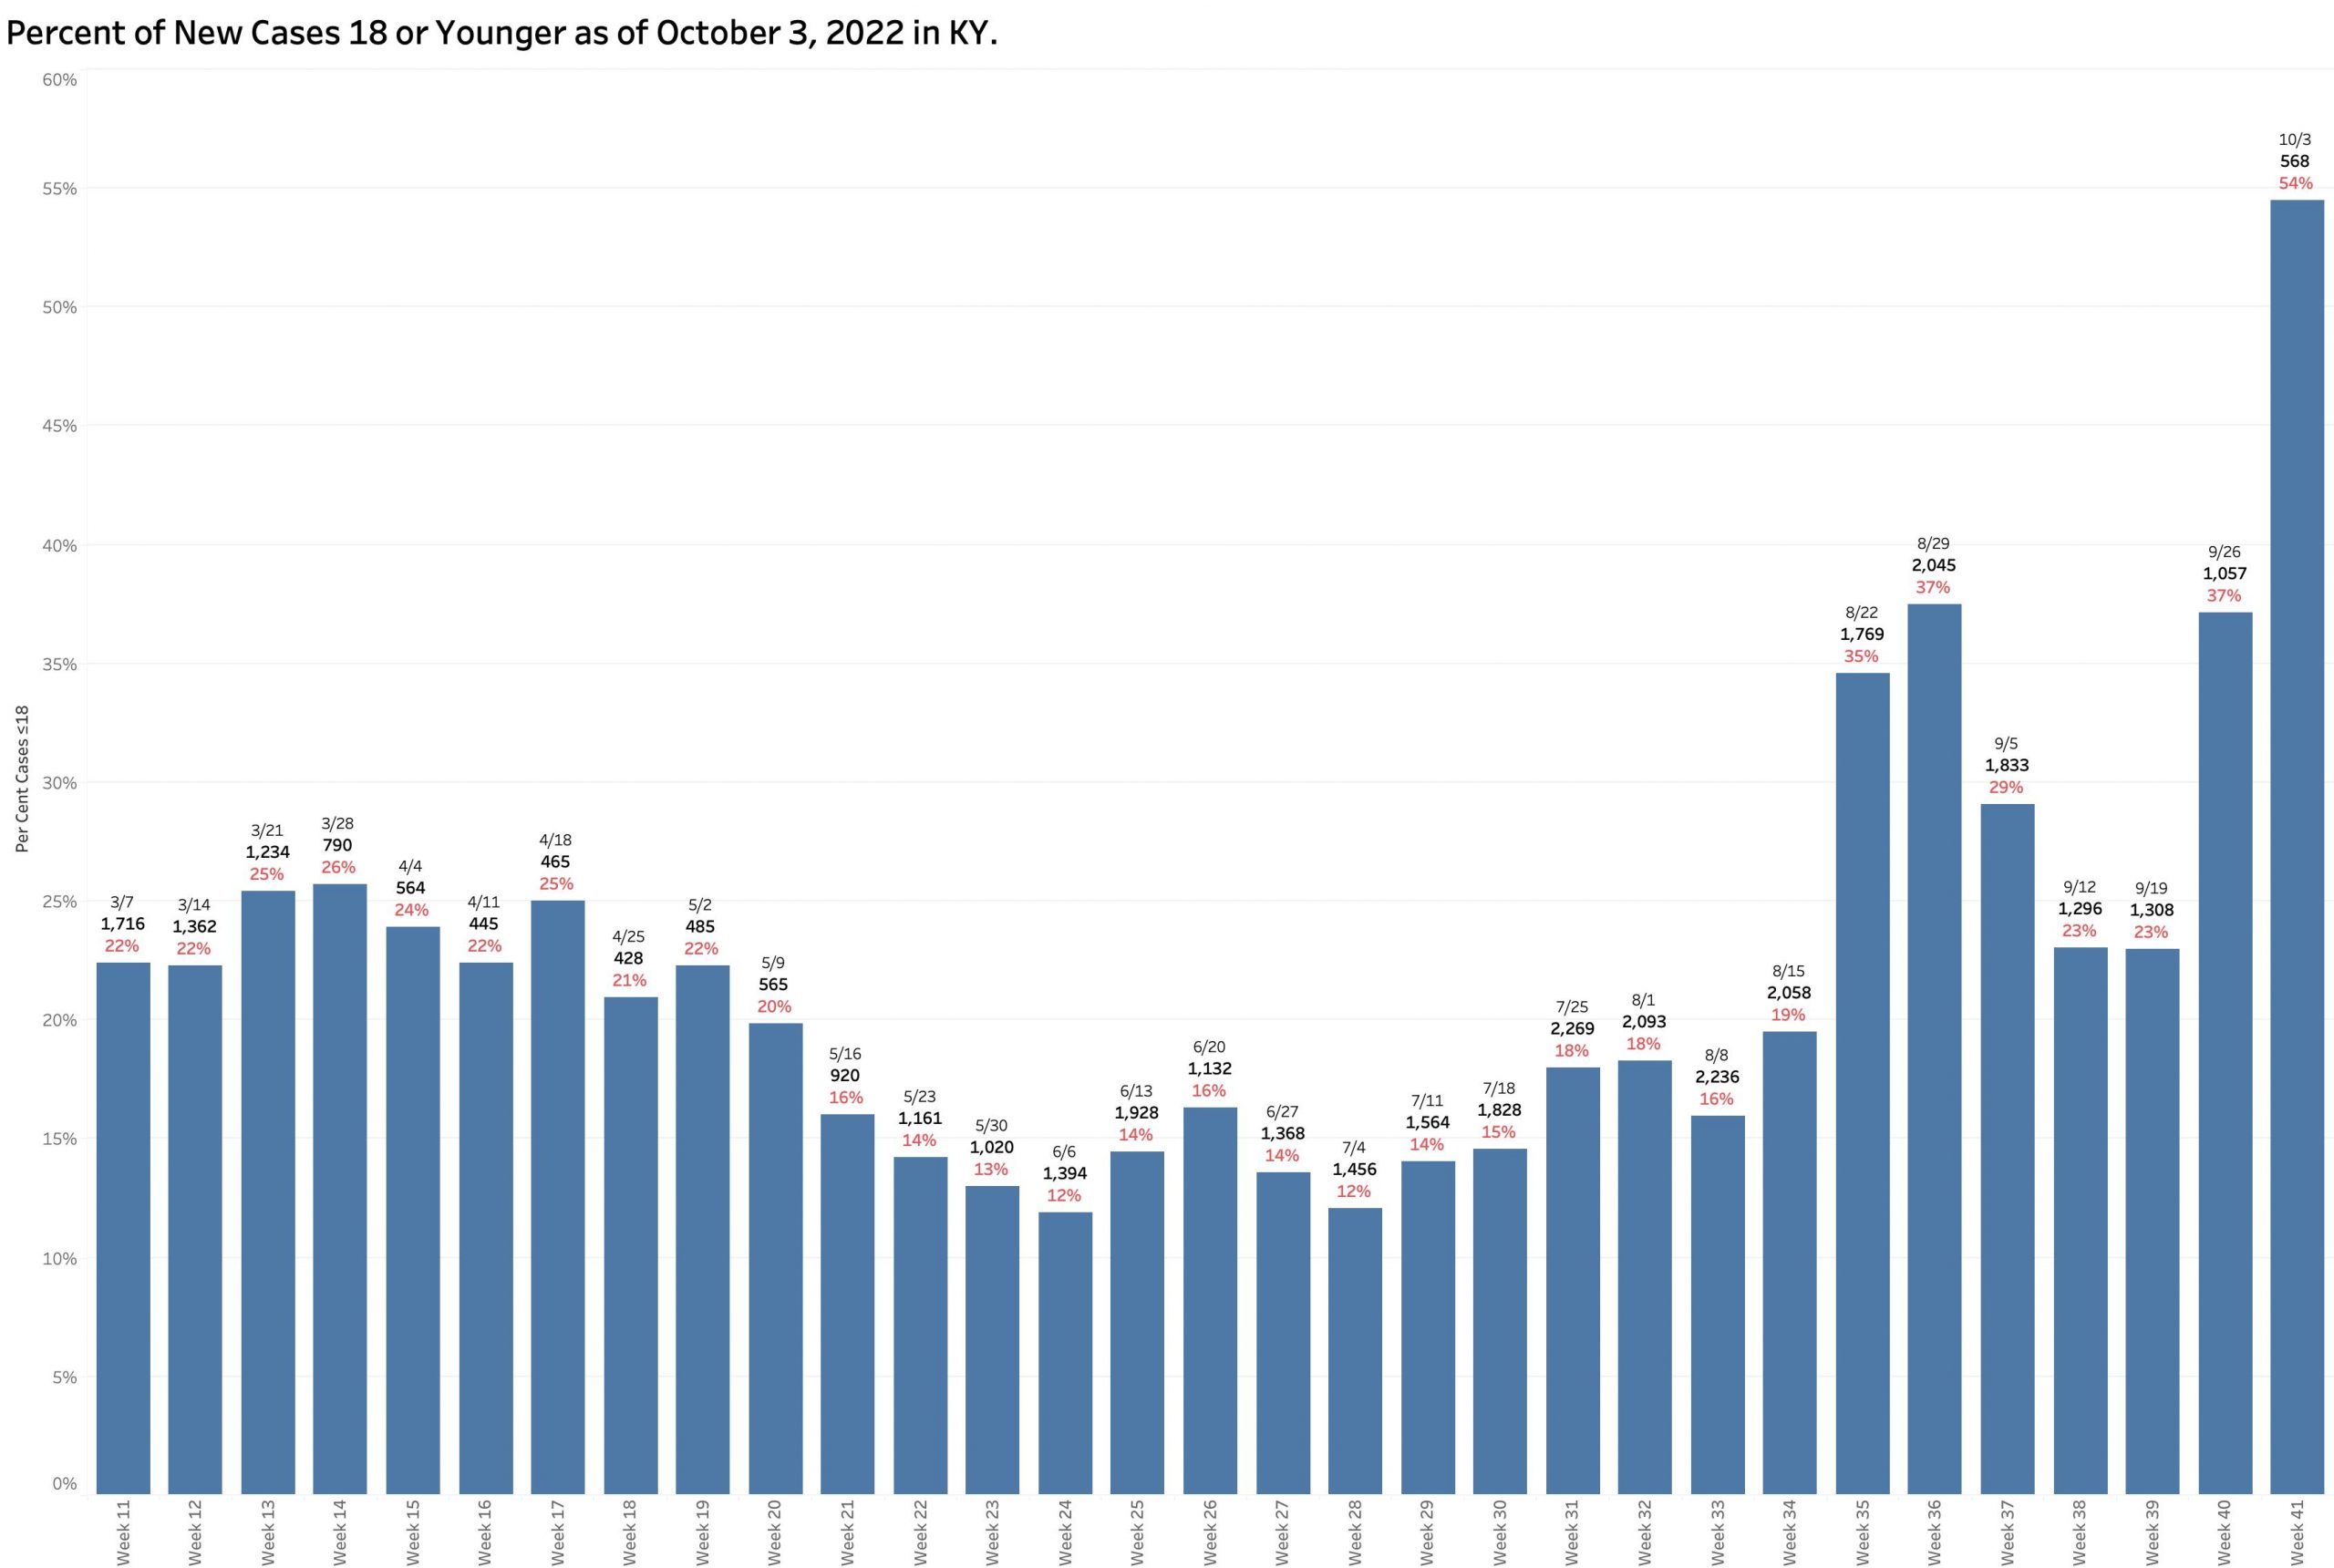
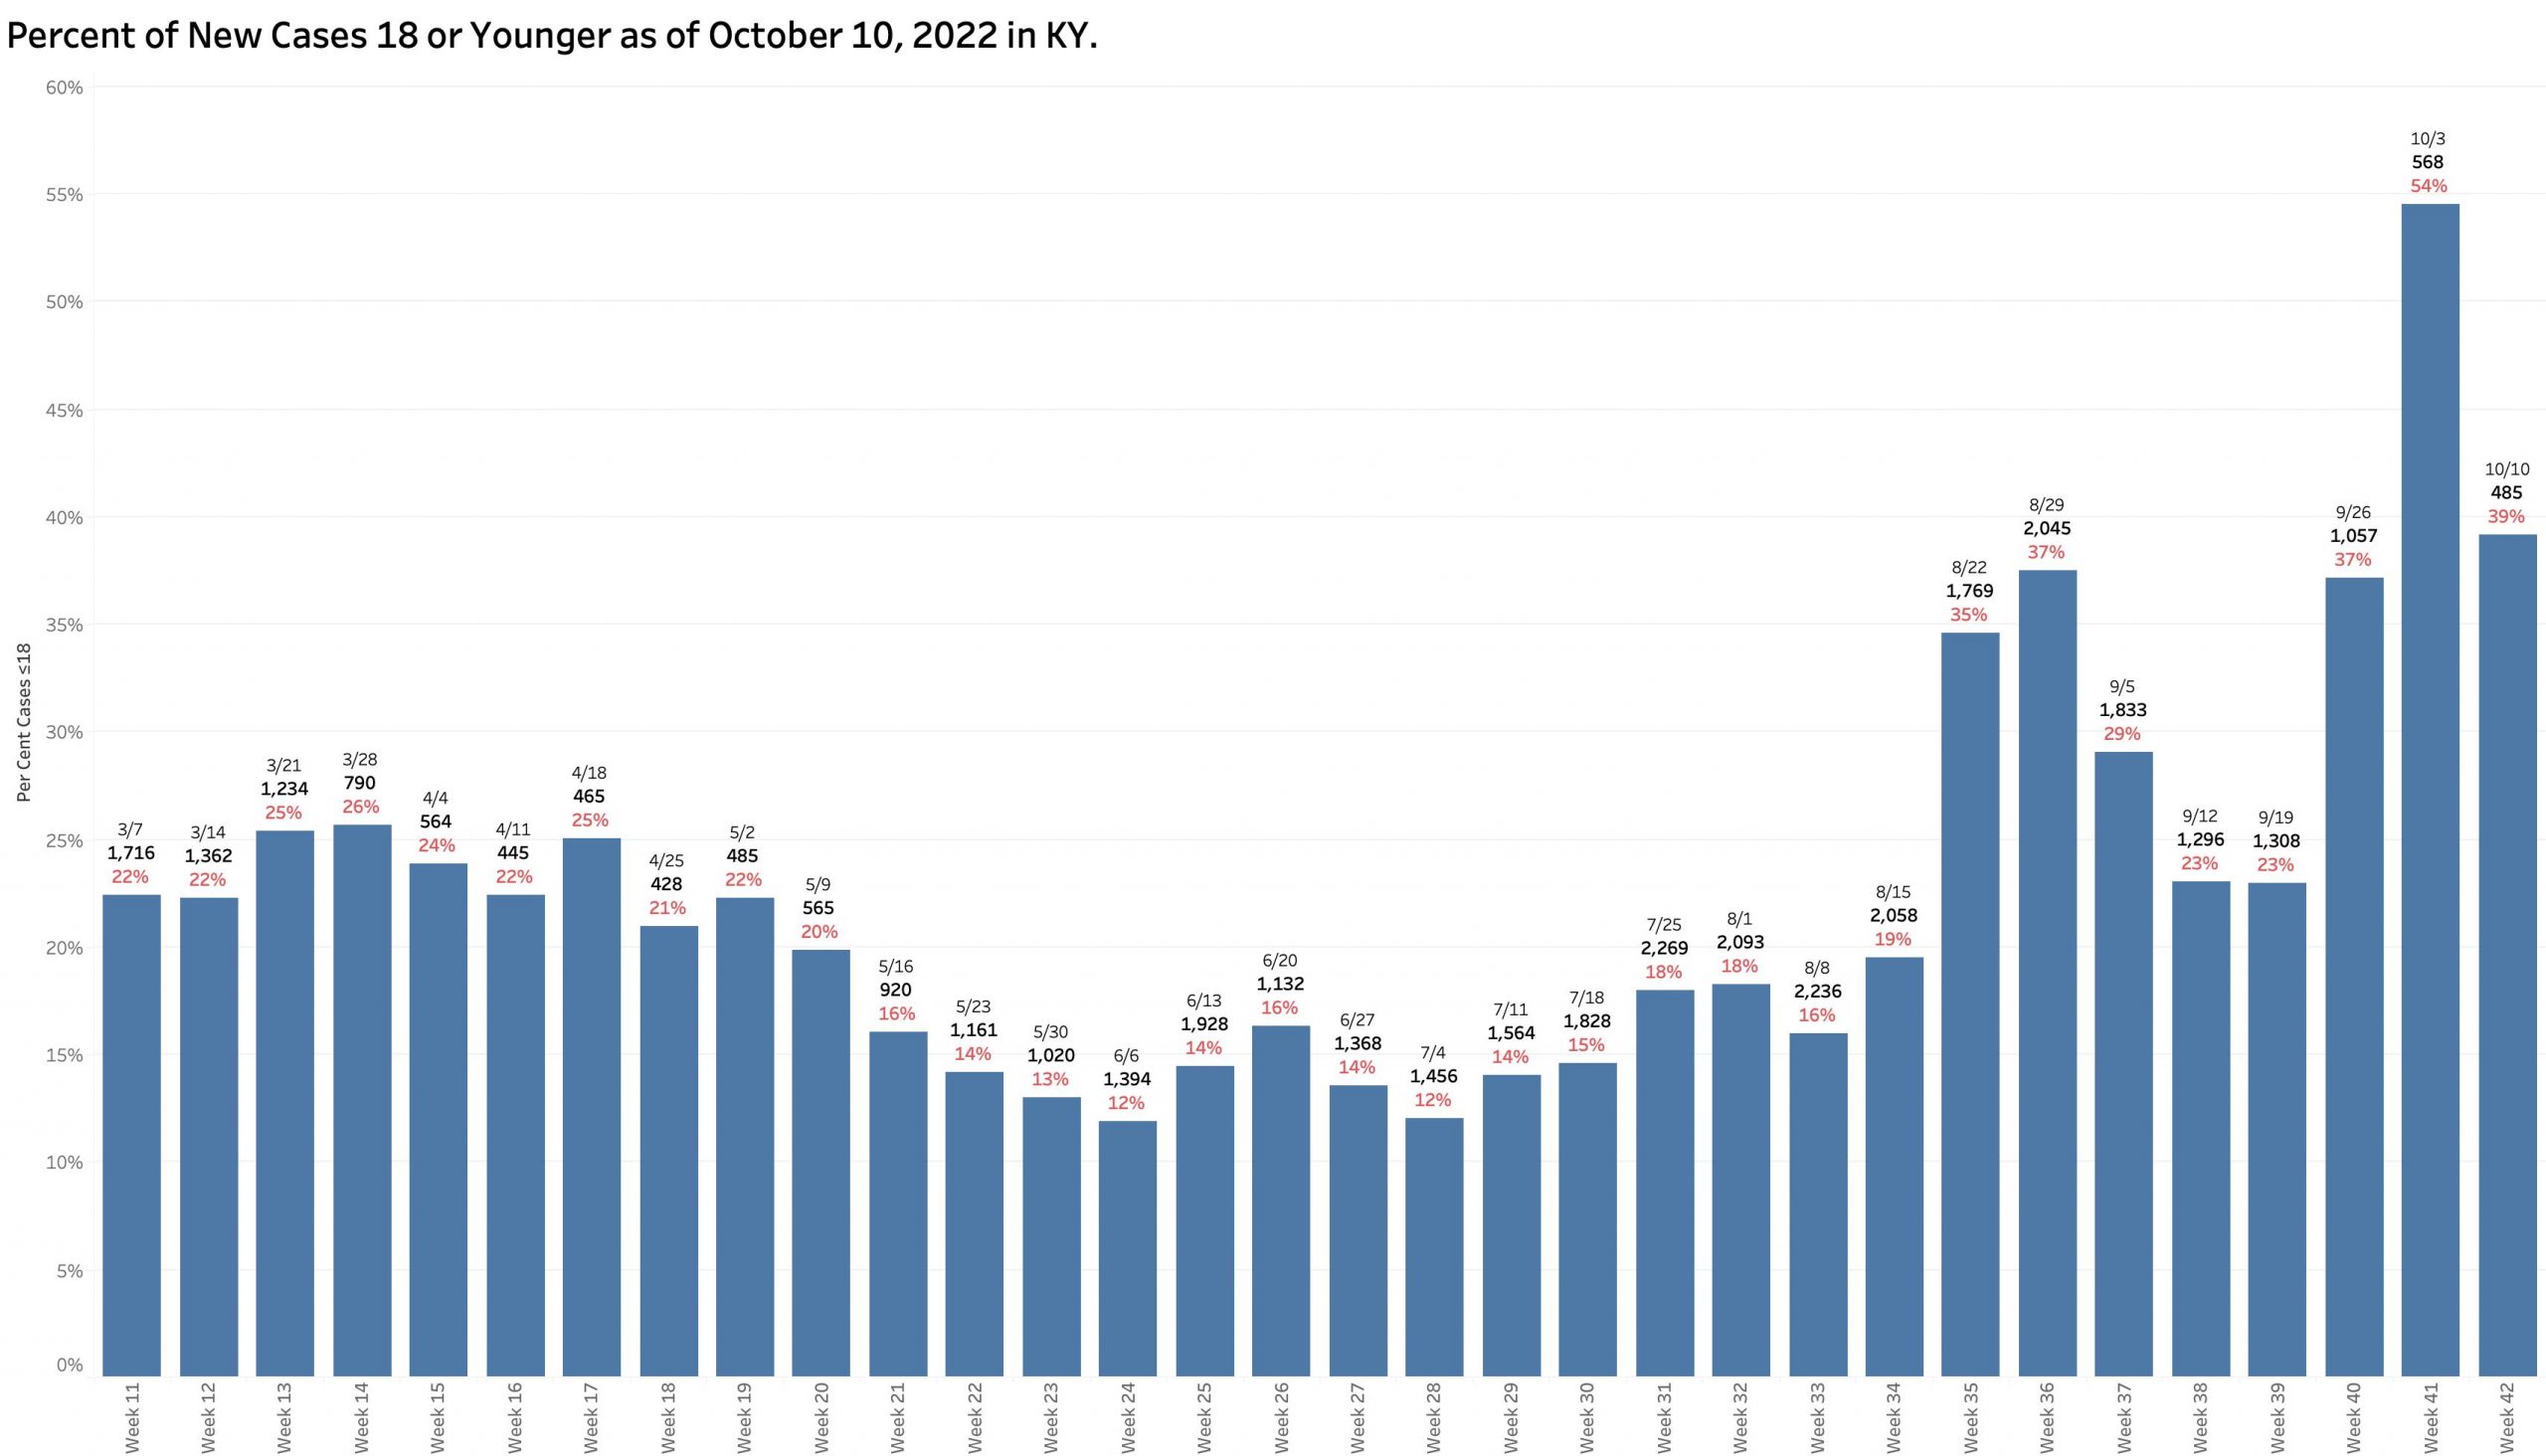
Are school-aged individuals over-represented in case counts?
Of the new cases identified by reportable PCR tests, a large proportion of infected individuals are 18 years old or younger. This week that proportion was 39%.  The previous week it was 54%.  This proportion has been rising erratically since school began in August. This seems high to me. I am unfamiliar how schools test for and report Covid-19 infections.


Viral RNA in Wastewater-  It is everywhere!
Under the direction of Dr. Ted Smith, the Center for Healthy Air Water and Soil at the Christina Lee Brown Evirome Institute at the University of Louisville has been doing important pioneering work examining the amount of Coronavirus RNA in the sewage of Jefferson County.  The virus is excreted in the feces of infected people and can be reliably measured. Wastewater SARS-CoV-2 RNA is not a substitute for accurate case counts, but this approach provides a broad overview of the amount of recently active Covid disease in the County. It also identifies the prevailing viral variant, currently Omicron BA.5.  In the comprehensive UofL Envirome Institute’s September 2022 report, it looks to me that since January 2021, the levels of viral RNA in wastewater are as high as they have ever been even as reported cases in Louisville have been decreasing.

As we enter the season of respiratory illness, I am reading that the Federal Government will no longer cover the cost of Covid vaccinations or tests. So much for the “public” part of public health. Are we really reverting to our “every-person-for themself” brand of American healthcare in the middle of an epidemic of historic significance?  If my interpretations are correct (and I hope to be very wrong), we are headed for another disastrous winter with our heads in the sand.

Respectfully and with trepidation,
Peter Hasselbacher, MD 
Emeritus Professor of Medicine, UofL
12 October 2022

Short Link:
http://www.khpi.org/blog/?p=7399

Marked Improvement In Kentucky’s Covid Epidemic – Or Plateau? How To Judge?

“There’s something happening here.
What it is ain’t exactly clear.”

Buffalo Springfield

On its face, yesterday’s Covid-19 update from the Kentucky Department of Public Health reported a continued dramatic decrease last week in the number of new cases, test positivity ratio, overall incidence rate, and the number of counties “in-the-red” with respect to new cases per 100K population.

• Number of New Cases in previous week: 3,979. (Average per day= 568)
• New Cases in individuals 18 years old or younger in prev. week: 2,168.
• Overall (KY) Average Daily Incidence rate: 11.9 cases per 100K population.
• Test Positivity Rate (as calculated): 7.7% of selected PCR tests.
• Number (Red) Counties with Incidence Rates greater than 25 per 100K= 5.

Big-league drops in selected new cases.

Incidence Rate tracks (necessarily) the number of cases chosen to report.

Test Positivity also derived from case identification.

Red counties have incidence rates greater than 25 per 100K Population. (Still have to count cases accurately.)

But…
On the other hand, there is ample evidence that the actual number of new weekly cases is vastly underreported. Furthermore, there are anomalies in the data that should raise concerns about the accuracy and timeliness of our data collection and reporting systems and therefore the degree of any putative decline in Kentucky’s epidemic activity. Reliable case counts are essential as the CDC prepares its Community Level Maps.

For example:
The actual number of new cases added to Kentucky’s running total of cases total is 8,975– little different than the total increments of the past 4 weeks and much higher than last April/May. Looking at it another way, this week’s “uncounted cases” of 4,996 is the highest is has been since the state switched over to a weekly reporting schedule last March. Surely this considerable delay in reporting compromises the basis of policy changes of the past month that led to the dropping broadly of non-medicinal public health measures. Since the calculation of disease incidence rates relies on the accuracy of new case counts, I doubt that only 5 counties are in the red!

“New Cases” plus catch-up reporting of cases. Decline or plateau?

Cases added to aggregate total of cases but not reported as “new.”

Test Positivity Rates:
The percent of “new cases” identified by reported PCR viral RNA testing jumped up to 72% from the low 50s of the previous 2 weeks. I am unaware of any systematic or structural changes last week that would alter this ratio so greatly. Additionally, the total number of PCR tests reported from which the positivity rate is calculated dropped to its lowest level since March. That there has been a major perturbation in our testing and reporting structure is evident in the percent of new cases in individuals. Last week the percent of new cases in school-age individuals rocketed up to 54%– the highest by far since the beginning of Kentucky’s Covid-19 epidemic when that number remained below 30%. With apologies to Buffalo Springfield, “There’s something happening here. What it is ain’t exactly clear.”

Percent of reported New Cases accounted for by the positive PCR tests among those used to calculate Test Positivity Ratios.

Percent of reported New Cases in people aged 18 or less. More than half in recent report were school-age!

Number of PCR tests reported electronically to KYDPH. Very much fewer than in earlier pandemic. (One best finds what one looking for.)

Jefferson County remains in the “Substantial” incidence rate category! How is it that the county is depicted as Green “Low Level” in the current CDC Community Levels map?

What are other Covid data aggregators saying?
I am having difficulty reconciling our home-grown Kentucky reports with those of other organizations respected for their reporting of the epidemic (or even the CDC for that matter). The New York Times (that had to sue the federal government to obtain county specific data early in the pandemic) ranks Kentucky as having the highest overall disease incidence rate of any of the 51 states and DC at 27 per 100,000 based on an average daily case number of 1196. Eleven of the top 20 counties ranked nationally by Disease Incidence Rate are in Kentucky– including the top 3. Eastern Kentucky is still a prominent national hot sport of disease activity. A large measure of the differences among reports by other agencies lies in the operational definitions and analytic processes that are intrinsic to the assembly of databases. I have touched on some of these in earlier articles.


I am willing to agree that we in Kentucky and the nation is currently in one of a series of descending’s limbs of the Coronavirus epidemic. I cannot agree at present that we in Kentucky are in as rosy a position as we all want to be. I am willing to hear the arguments that we are not more-or-less on a “plateau” of epidemic activity, or that we can safely let our guard down as the fall and winter seasons progress.

Peter Hasselbacher, MD
Emeritus Professor of Medicine, UofL
Kentucky Health Policy Institute
4 October 2022

Kentucky’s Covid-19 Epidemic Is On The Wane. How Low Will It Go Before Winter?

New cases reported each Monday have on average been declining but not nearly as rapidly as overall state incidence rates or test positivity rates. Indeed, these latter two metrics have been decreasing exponentially for the past 4 weeks. “Catch-up” counts of cases older than 30 days diminish the predictability of where we are headed. We are not improving as rapidly as other states. Whether we are approaching a to a still-too-high plateau or an “acceptable” endemic status of disease activity remains to be seen. The very real challenge of winter is ahead of us. Nonetheless, this week’s news is favorable and can be taken as evidence that we have been doing at least something right!

The decline in new case numbers in the state as a whole is reflected in a marked progressive decrease in the number of “Red” counties in the weekly Current Incidence Rate in Kentucky, from a total of 97 at the beginning of September to only 18 in this week’s report! Unfortunately all but three of the current red counties (with an incidence rate of ?25 per 100K) are clustered in the far east part of the state, especially in the counties recently devastated by floods. It is a historical truism that disease is often a fellow traveler following disaster.


Still over 1000 new cases identified statewide per day with many times more unrecognized or unreported.!

The nation needs a more timely and complete uniform data reporting system badly.

Test Positivity Rate falling exponentially.


Case loads in eastern KY have generally been higher than elsewhere but surged in recent weeks to highest incidence rates in the nation.

Other Metrics of Disease:
Deaths are not yet falling at 67 last week. Hospitalization census numbers looks like they are going in the right direction. The number of PCR (viral RNA) tests performed has increased a little and account for only 52% of all new cases identified– still a much lower rate than in past months that I do not understand. Noteworthy is another surge in new cases in school-age individuals ?18 years old. As long as the virus is free to churn away in our schools and colleges, we are unlikely to arrive at incidence rate we can more comfortably live with this winter. Too bad that the issue of masks and testing in schools became so politicized.

Individuals 198 and younger making up a record high of 37% since March.

Wherever we are headed, we will do so together.

Peter Hasselbacher, MD
Emeritus Professor of Medicine, UofL
Kentucky Health Policy Institute
27 September, 2022

Kentucky’s Part Of The Pandemic May Be Waning But As With The Rest Of Nation Is Not Yet Over.

Kentucky’s homegrown Covid update published last Monday evening, September 19, might be interpreted as demonstrating an easing of the Commonwealth’s share of the pandemic. There was only a very small uptick in new weekly cases with more marked decreases in the Test Positivity Ratio and the Overall Case Incidence Rate. Nonetheless, a lack of concordance of these three interconnected metrics highlights the sorry state of data collection that is badly needed both nationally and in Kentucky. We are most assuredly behind the timeline in assessment of disease activity.

Number of “New Cases” of Covid-19 in week reported 9–19-22. Small increase noted.

I recently expressed the widely observed concern that delayed case and hospital reporting following a major long weekend holiday would be followed by compensating catchup numbers. This has been the case earlier in Kentucky. Monday’s report of 9159 new cases was in fact higher than the previous week’s, but only by 85 cases– a 6.6% increase. I was therefore surprised to see the Test Positivity Rate fall by 26.6% from 16.3 to 12.0%. In the same direction, the Overall Incidence Rate across the state continued its dramatic 4 week fall from the high of 47.0 cases per 100K population in the report of August 29. In the past week alone the Incidence rate fell a further 25.6% from 27.0 to 20.1 per 100K. In my head, this does not yet compute because the formulas used to calculate both the later two metrics are based on new case counts.

Test Positivity Rate (TPR).
According the Kentucky Department of Public Health (KDPH), “Positivity rate is calculated using electronically submitted PCRs from the past seven days.”
It has been calculated this way for well over a year and has the advantage of simplicity, timeliness, and consistency. It is a simple ratio of the number of Covid-positive results to the number of PCR tests performed. However, not all tests are included in the calculation– only PCR (viral RNA) tests performed by laboratories that report their results to the state electronically. This means that vast numbers of positive tests such as from non-electronically-reporting labs, antigen testing at home or elsewhere, or clinically diagnosed cases are left out of the calculation. The TPR calculated in this way has correlated very well with the number of new cases over the past 2 years. In recent months, this version of TPR identified an average of 60% or more of the number of cases categorized weekly as “new.” Over the previous 4 weeks 70 to 80% were identified in this way but dropped dramatically this week to 54%! The total number of PCR tests performed (both negative and positive) increased very slightly in this current reporting week from 39,107 to 41,436 but this number remains substantially lower than the counts of the proceeding 3 or 4 months (See figure below.) The combination of a low number of selected PCR tests being reported and a lower Test Positivity Rate should have led to a lower number of new cases from this source. Where did the other 4205 “new” cases come from?

Test Positivity Rate as specifically calculated dropping 26.6% in past week!

Per cent of new cases identified by electronically reported PCR tests. A noteworthy drop in past week.

Number of PCR Tests reported electronically by labs: Both positive and negative.

“Uncounted” New Cases.
In 10 of the previous 13 weekly reports, the increment in the number of [aggregate] Total Cases increased by amounts larger than the number of New Cases reported for that week. I referred previously to such cases as “uncounted.” I assumed that in part these included “catch-up” cases whose onset of disease occurred well before the cutoff date of each weekly report. In fact, my assumption was confirmed by an annotation by KDPH attached to its reports: “Cases reported more than 30 days after occurrence are included in cumulative totals only.” The delay in reporting is an obvious example of the archaic public health systems we work with nationally and in Kentucky. (A similar phenomenon occurs with deaths as large boluses of numbers work their way through the belly of the python that is our complex death-reporting system.) In this most recent week’s report, the increment in total cases matches exactly the number of new cases. We must assume there have been more new infections than we know about at this time.

Difference in weekly reports between “New Cases” and increment to Total Cases.

“Incidence Rates are defined with slightly different different language by KDPH on its reports and maps. For the table of “Incidence Rates By County,” it is the “Average daily new cases per 100,000 population based on previous seven days.” For the weekly “Covid-19 Current Incidence Rate in Kentucky” published Monday evenings is a fuller description: The seven-day incidence is calculated by taking the total number of unique cases in each county over the past seven days, divided by seven to get a daily average, divided by the U.S. census bureau county population and multiplied by 100,000 to get the incidence per 100,000 people. The cases counted each day are based on the date an investigation was opened in the National Electronic Disease Surveillance System. Duplicate cases are removed before the calculation, so each positive case is included only once.”
The Overall Current Incidence Rates printed on the table and the map are identical. This week’s reported rate is 11.73% per 100K, down 25% from the previous week of 26.97 and by nearly 50% from the 39.72% per 100K in the report of September 5!

Overall Incidence Rate per 100K population as defined by KDPH.

The published Overall Incidence Rate has indeed dropped dramatically. So has the number of counties “in the red” (defined as those with a county incidence rate greater than 25 per 100K). The number of red counties tracks closely with overall incidence rates. The number of “high” red counties in the last 4 reports has decreased sequentially: 104, 97, 65, to the current 41. Interestingly, the number of red counties in the most recent “Community Levels by County” map of the CDC was 45. In both maps the large majority of counties with these higher incidence rates are in eastern Kentucky– some very high. The current New York Times analysis of the states assigns Kentucky a 7-day average case incidence rate of 28 per 100K in a three-way tie for highest in the nation with West Virginia and North Carolina.

Number of Red Counties in Incidence Rate Maps with corresponding Overall Incidence Rates.


Absent the historical raw data by county and any daily numbers at all, I do not at present understand an apparent discordance between the number of cases, test positivity, and incidence rates. For example, with respect to incidence rates, the number of new cases this last week hardly changed at all from the week before and the population of the state is essentially unchanged but the incidence rate dropped bigtime. The answer probably lies somewhere in the weeds of how terms are defined and the day-to-day mechanics of how cases come to the attention of the public health departments, how long it takes for local agencies to report centrally, how long it takes to enter the data into the state’s and the CDC’s analytic systems, and how long it takes to publish the results. To my eye it is clear the path is tortuous, loses much information, and takes too long to be as helpful as it needs to be.

Other Metrics in the Current Report:
Current hospital census is nominally down from 584 to 456, as is ICU and ventilator utilization. How many of these actual human beings are in the hospital because of Covid or admitted for other reasons with an incidental positive test is unknown. The death count is back up to 80 per week, slowly rising since July, but much lower than the nearly 300 to 150 or so in March through early May.

To conclude this interim analysis, I want to take the optimistic position that Kentucky’s part of the pandemic is on average throughout the state simmering down, but when it started, how fast it is changing, and where it is going is not yet as predictable as I would like before we abandon all the simple things we can do to mitigate the ongoing significant damage to our collective physical persons and pocketbooks. It is obvious that in some parts of the Commonwealth that the Coronavirus is still having its way with us. We are as a whole no safer or healthier than the sickest in our midst. That is the principal that underlies the whole concept of public health. What happens in one county does not stay there.

Peter Hasselbacher, MD
Emeritus Professor of Medicine, UofL
22 September 2022