
“There’s something happening here.
Buffalo Springfield
What it is ain’t exactly clear.”
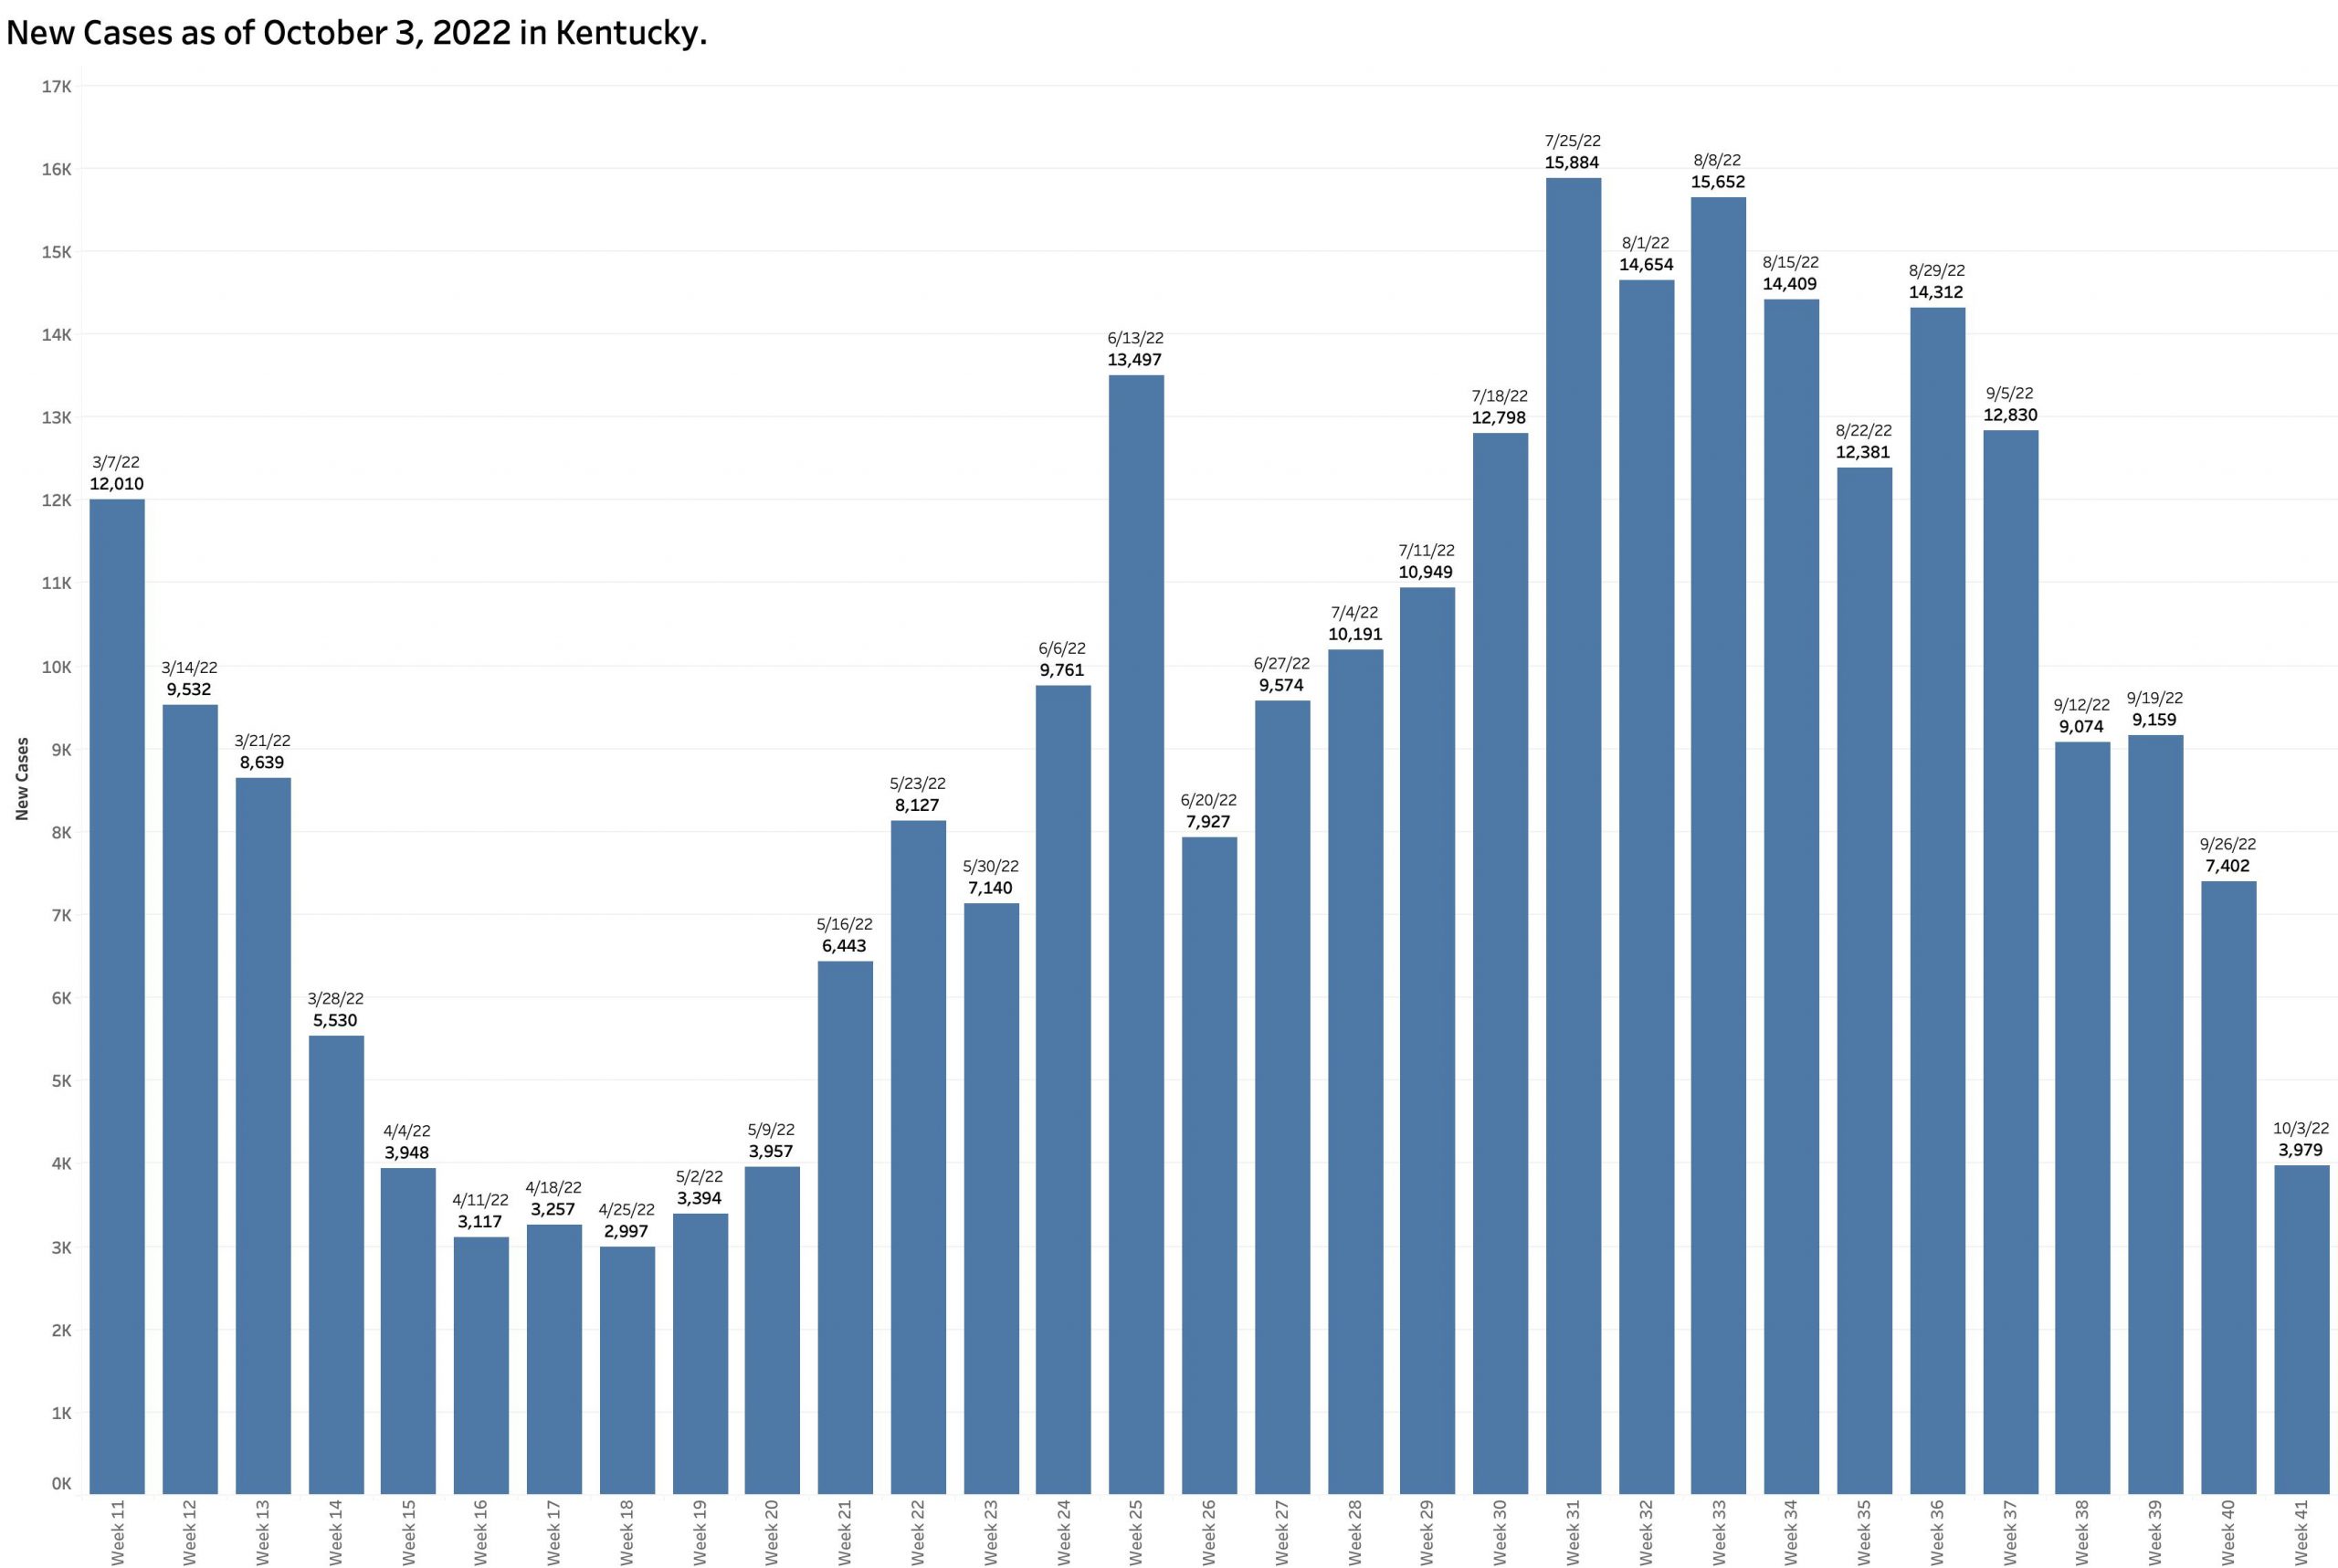
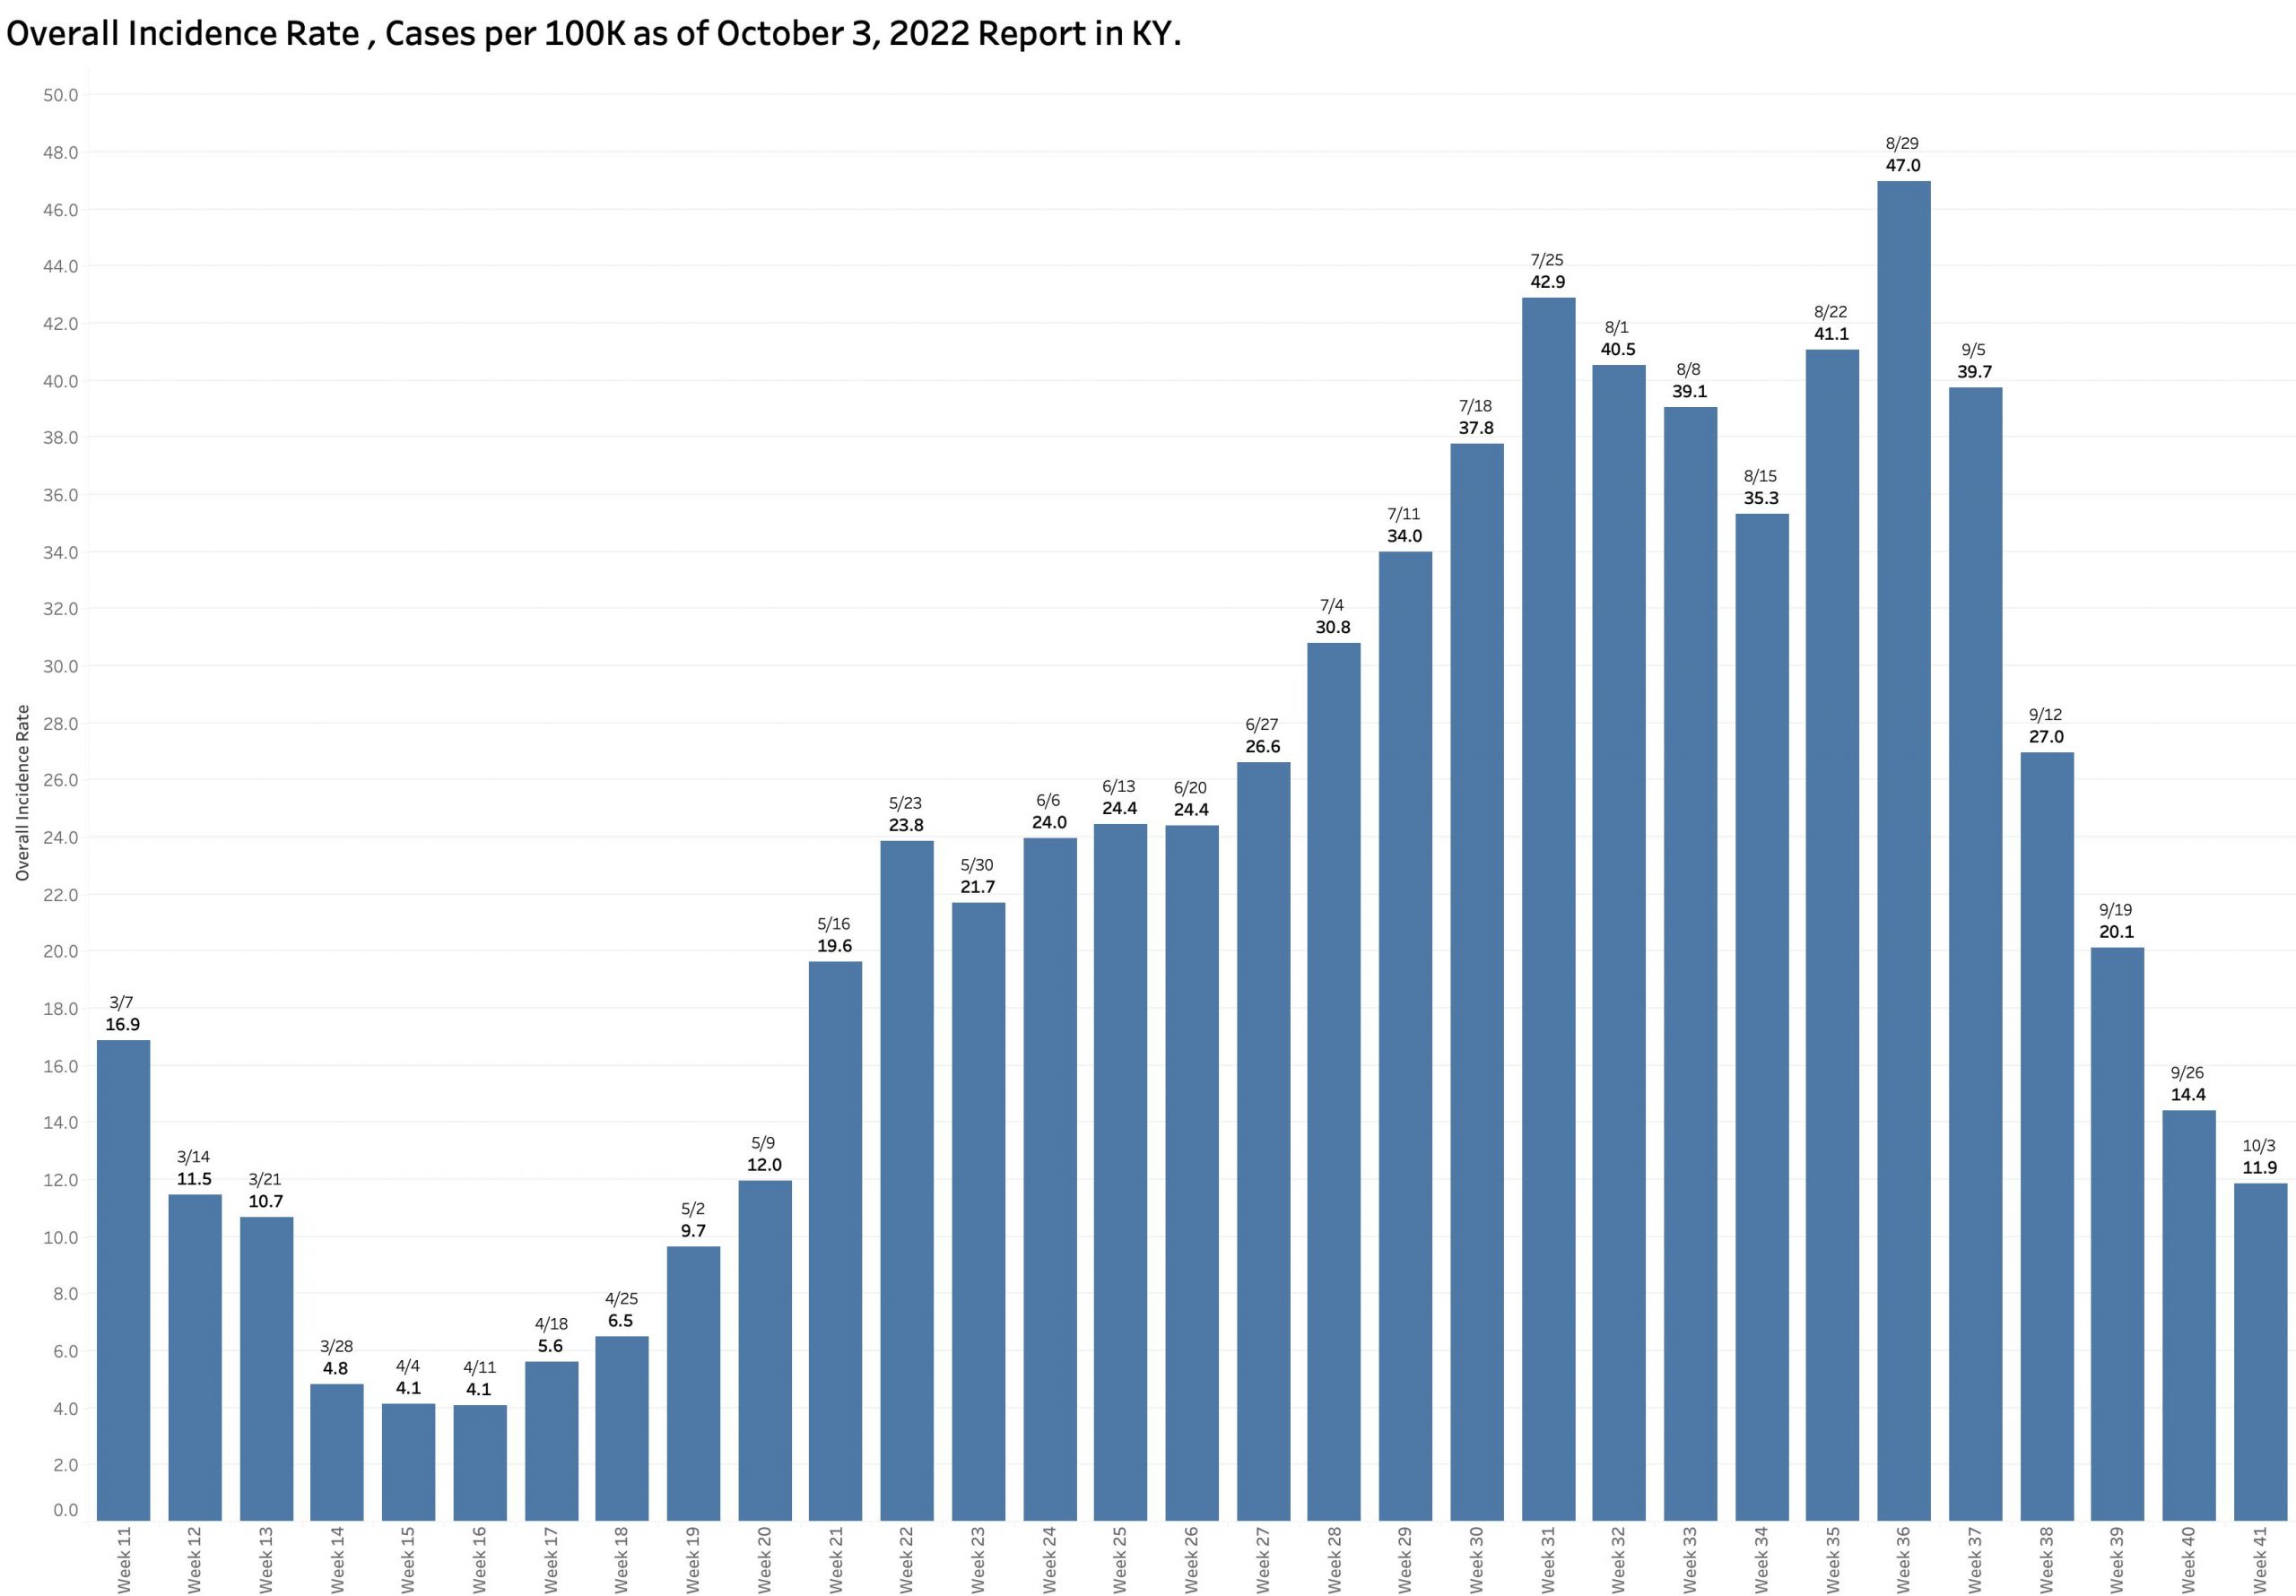
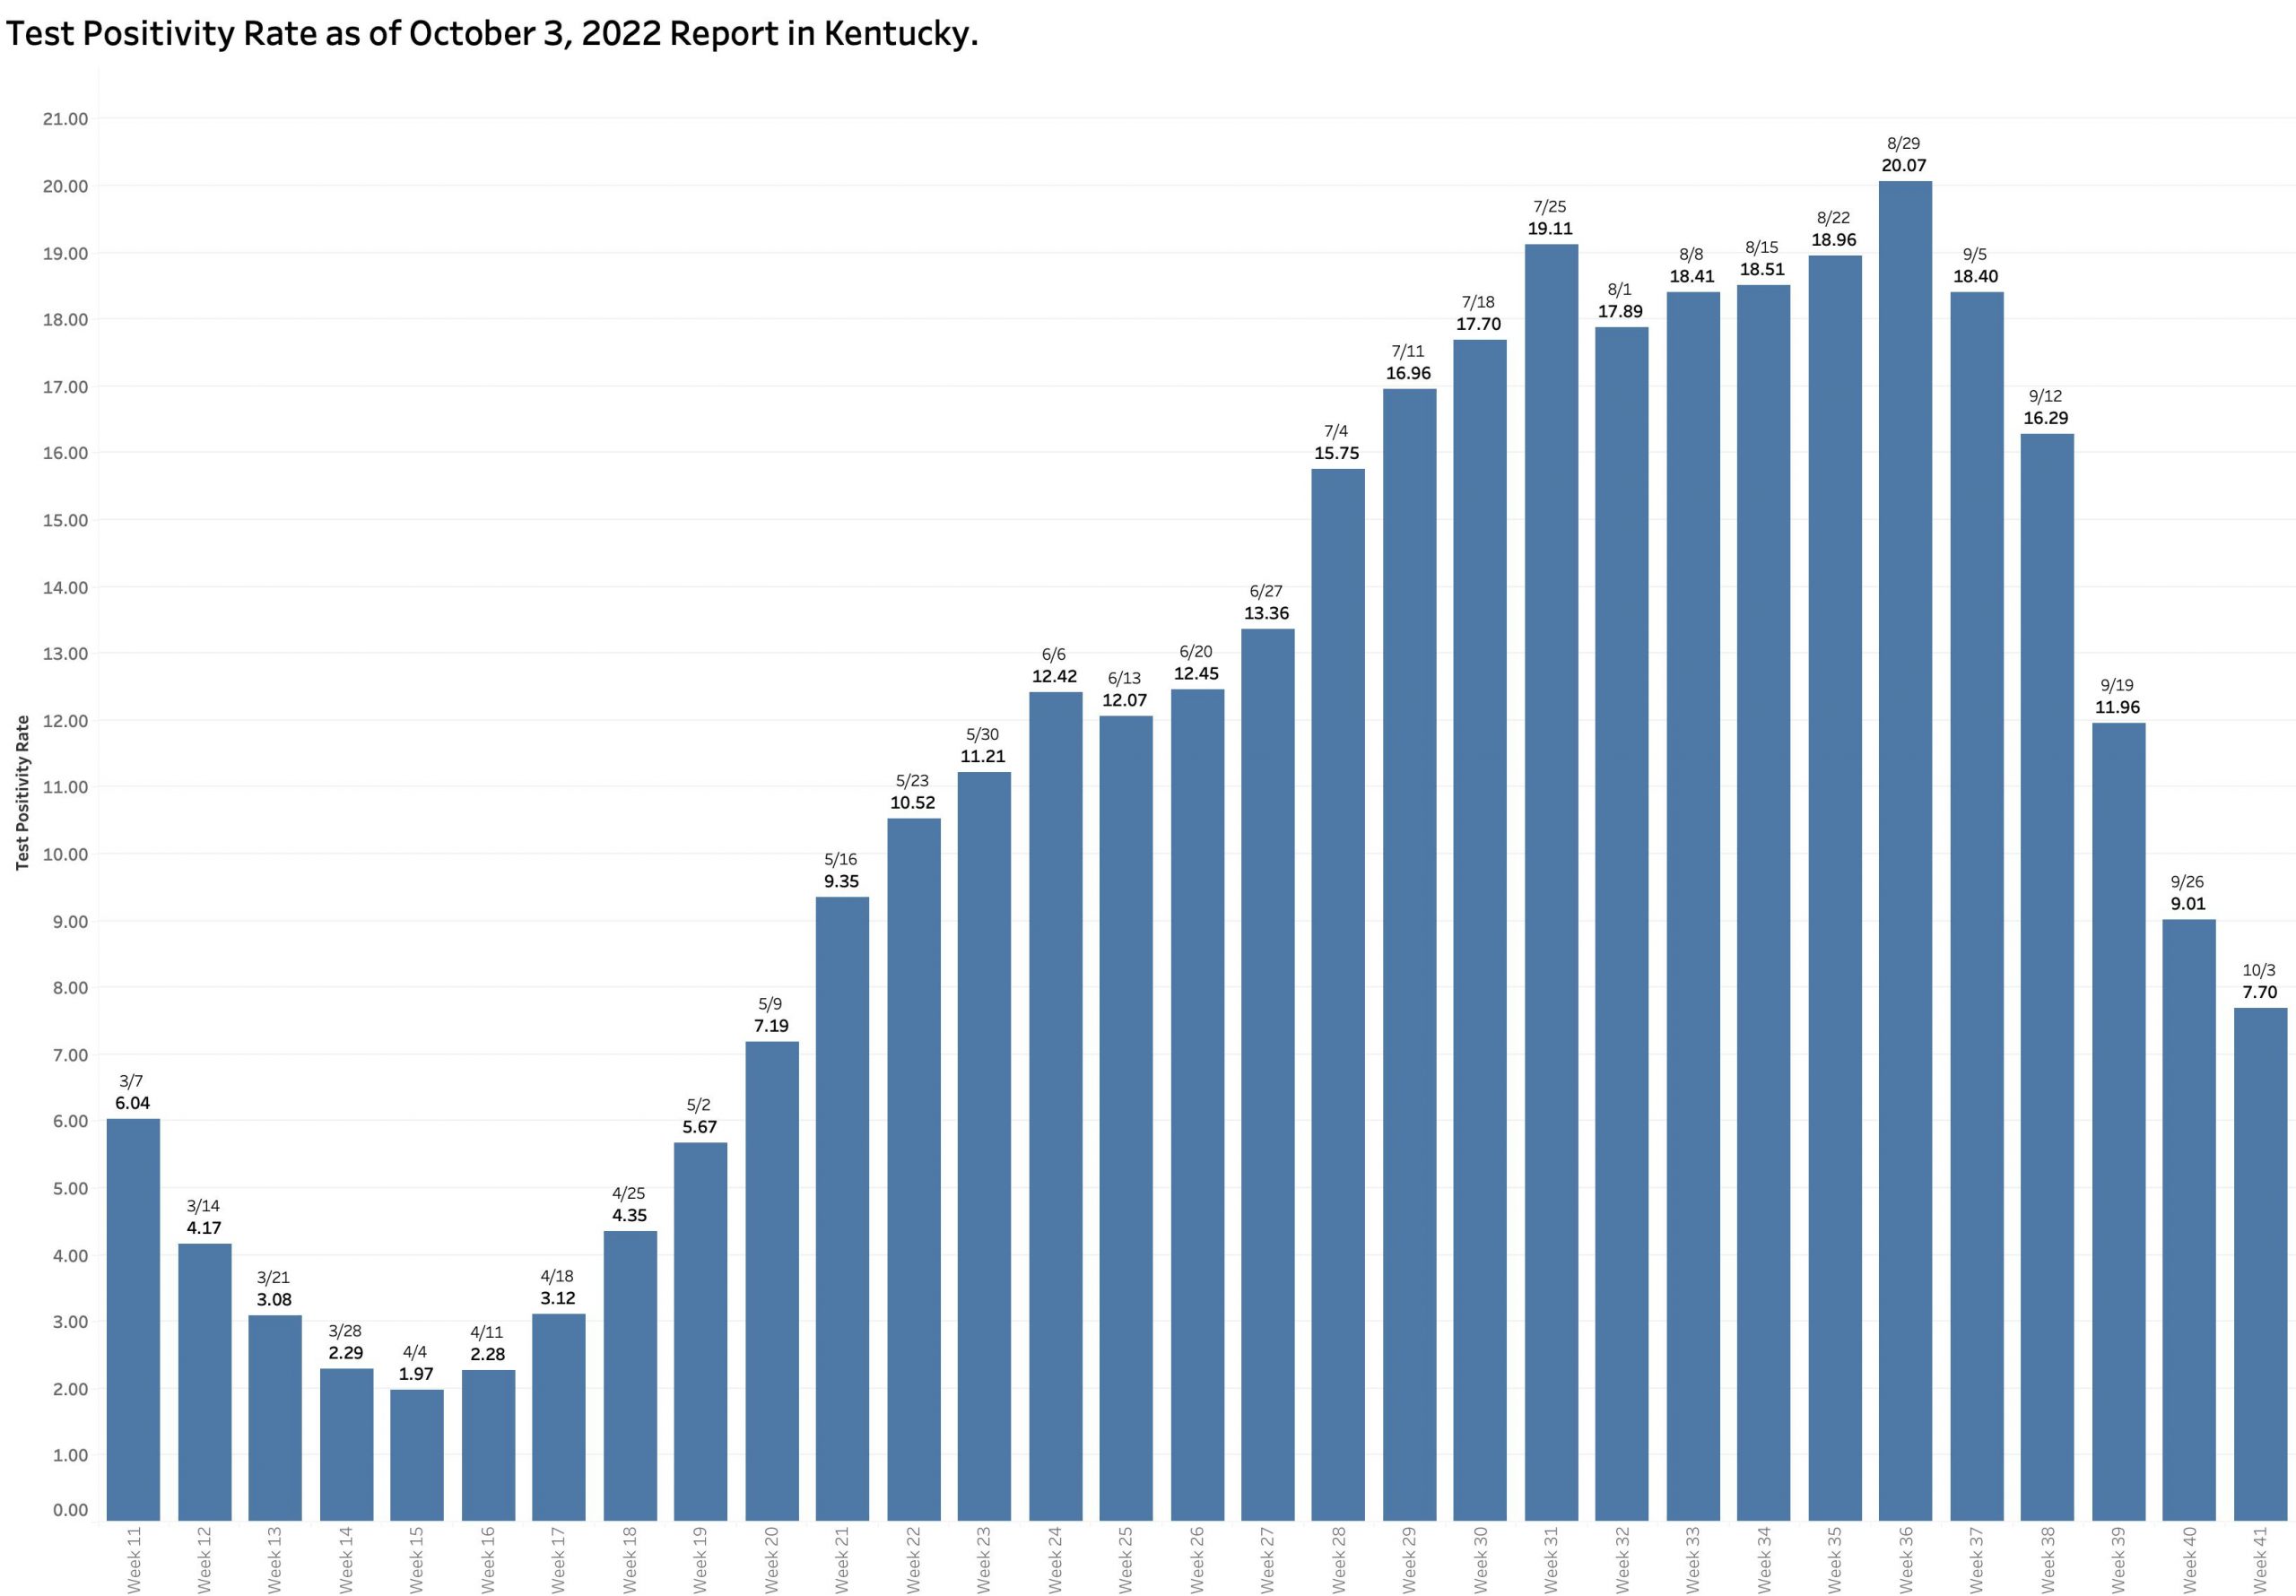
On its face, yesterday’s Covid-19 update from the Kentucky Department of Public Health reported a continued dramatic decrease last week in the number of new cases, test positivity ratio, overall incidence rate, and the number of counties “in-the-red” with respect to new cases per 100K population.
• Number of New Cases in previous week: 3,979. (Average per day= 568)
• New Cases in individuals 18 years old or younger in prev. week: 2,168.
• Overall (KY) Average Daily Incidence rate: 11.9 cases per 100K population.
• Test Positivity Rate (as calculated): 7.7% of selected PCR tests.
• Number (Red) Counties with Incidence Rates greater than 25 per 100K= 5.

But…
On the other hand, there is ample evidence that the actual number of new weekly cases is vastly underreported. Furthermore, there are anomalies in the data that should raise concerns about the accuracy and timeliness of our data collection and reporting systems and therefore the degree of any putative decline in Kentucky’s epidemic activity. Reliable case counts are essential as the CDC prepares its Community Level Maps.
For example:
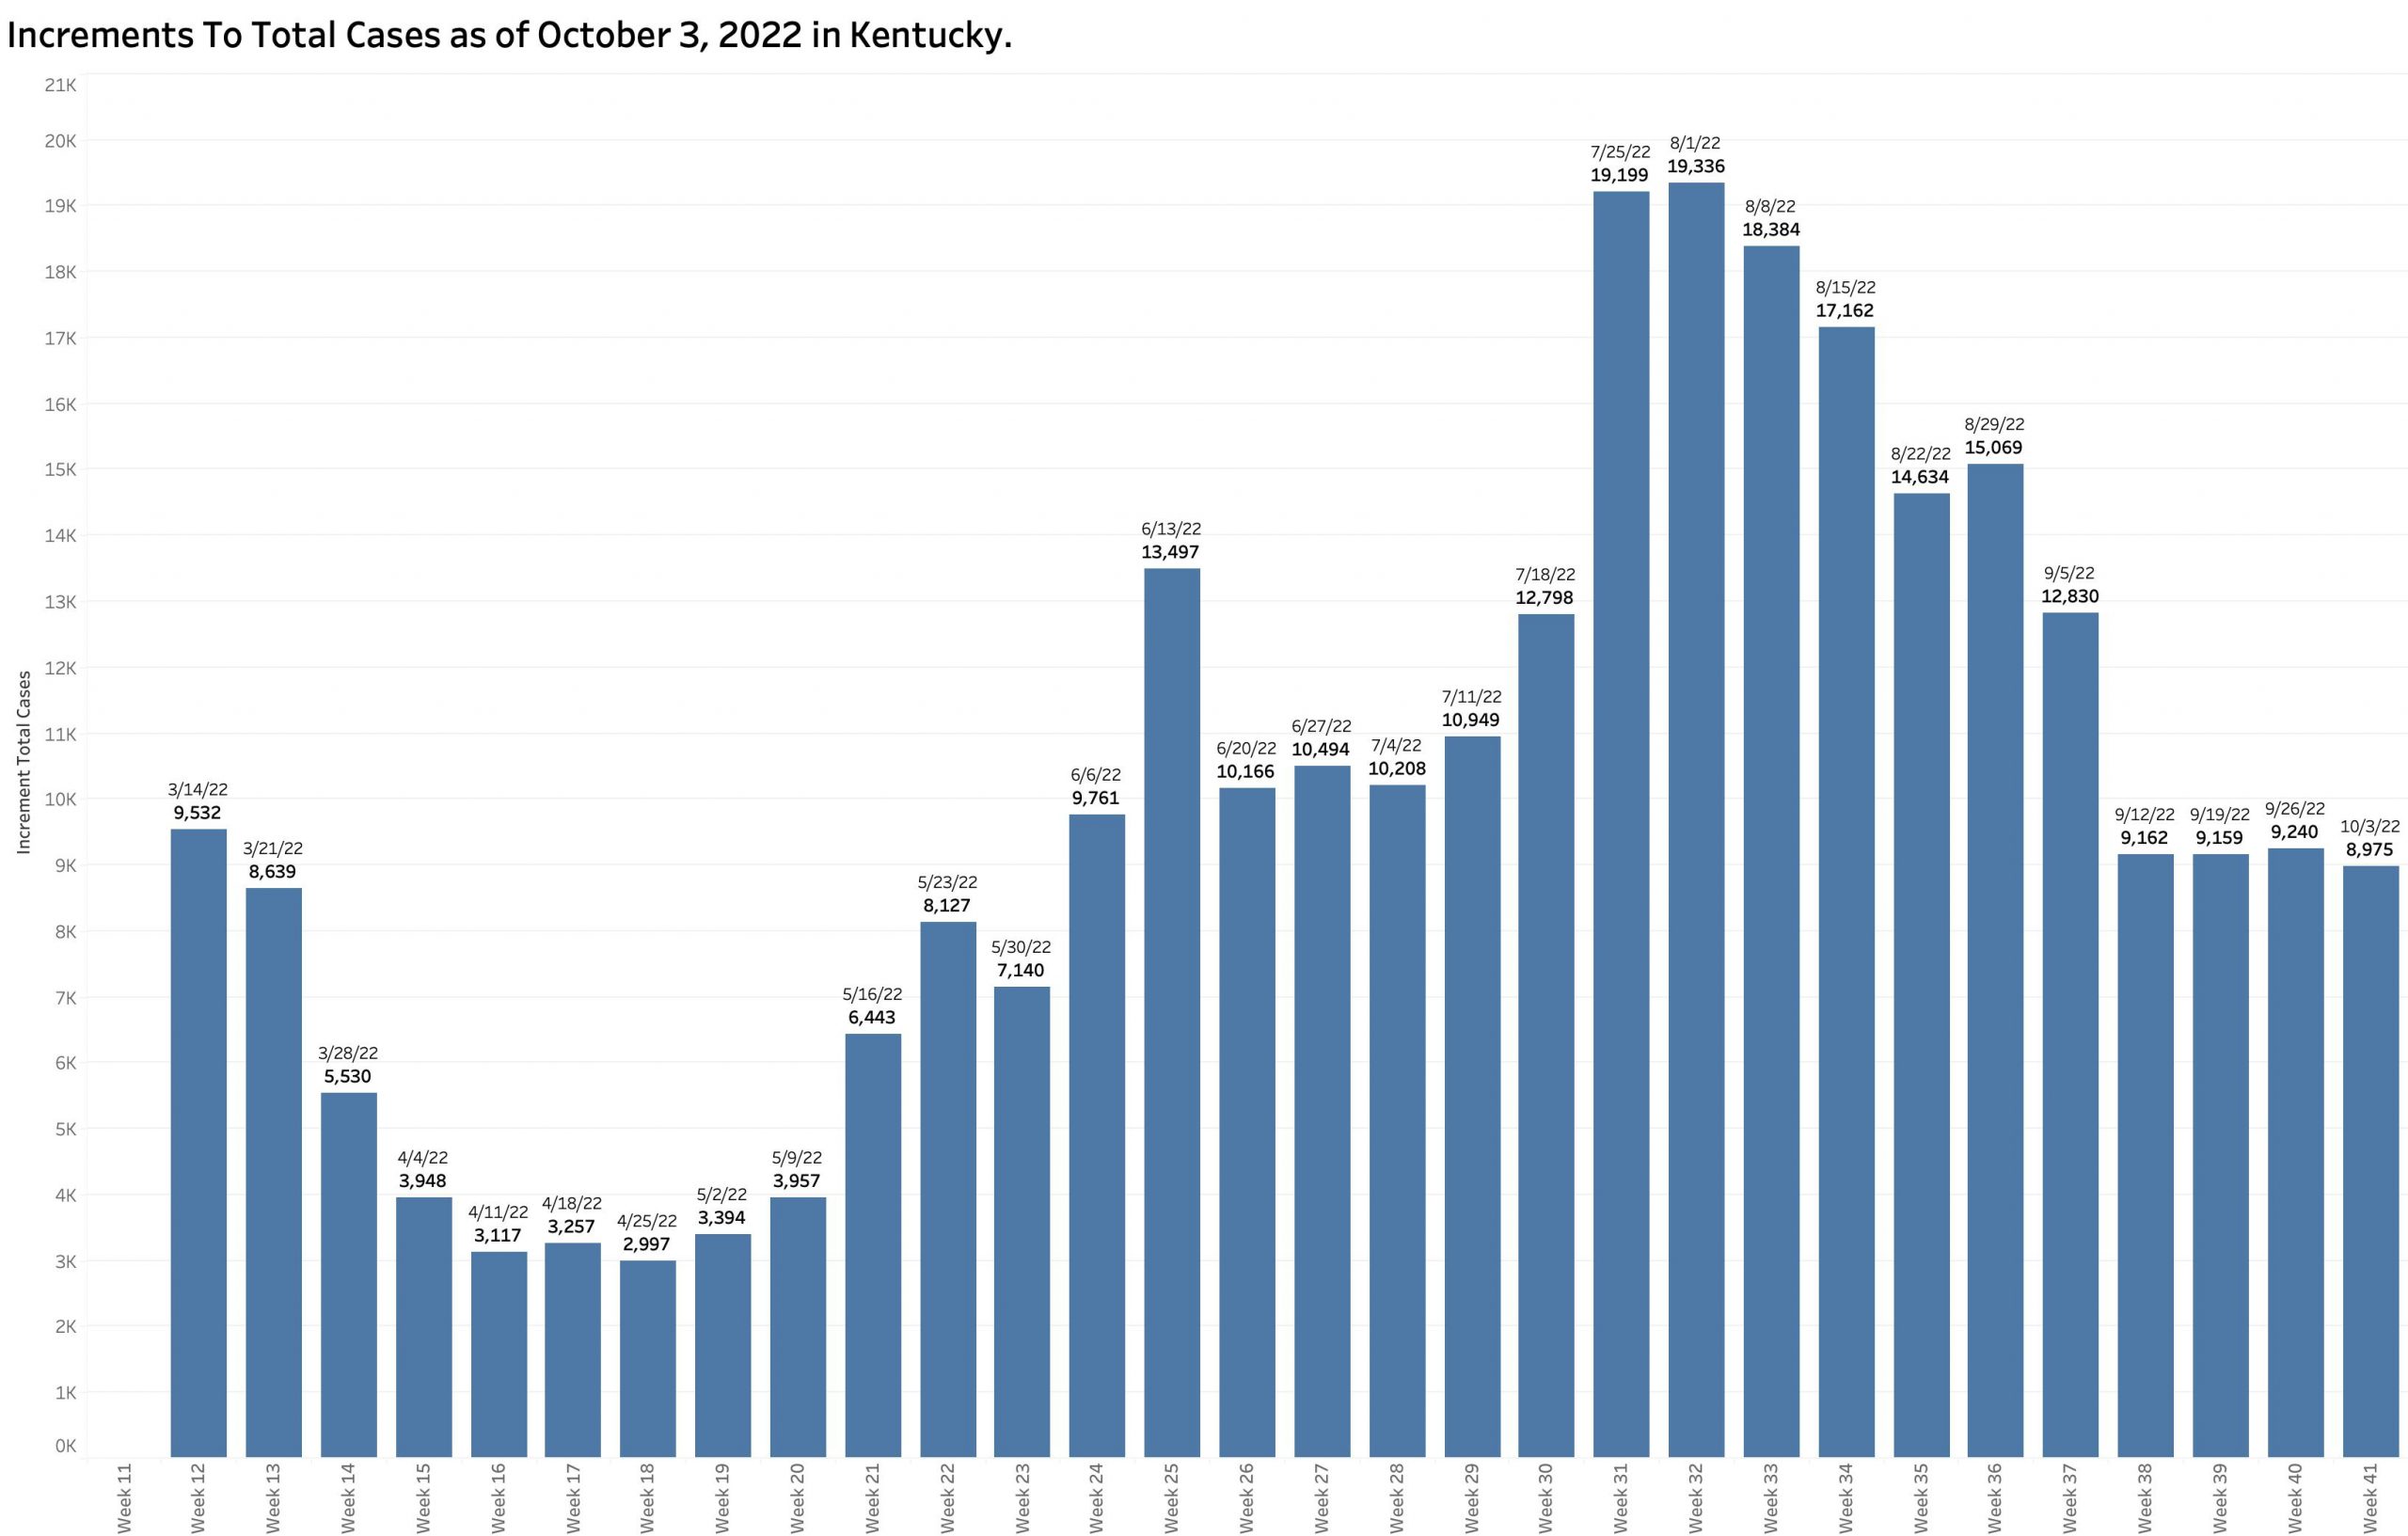
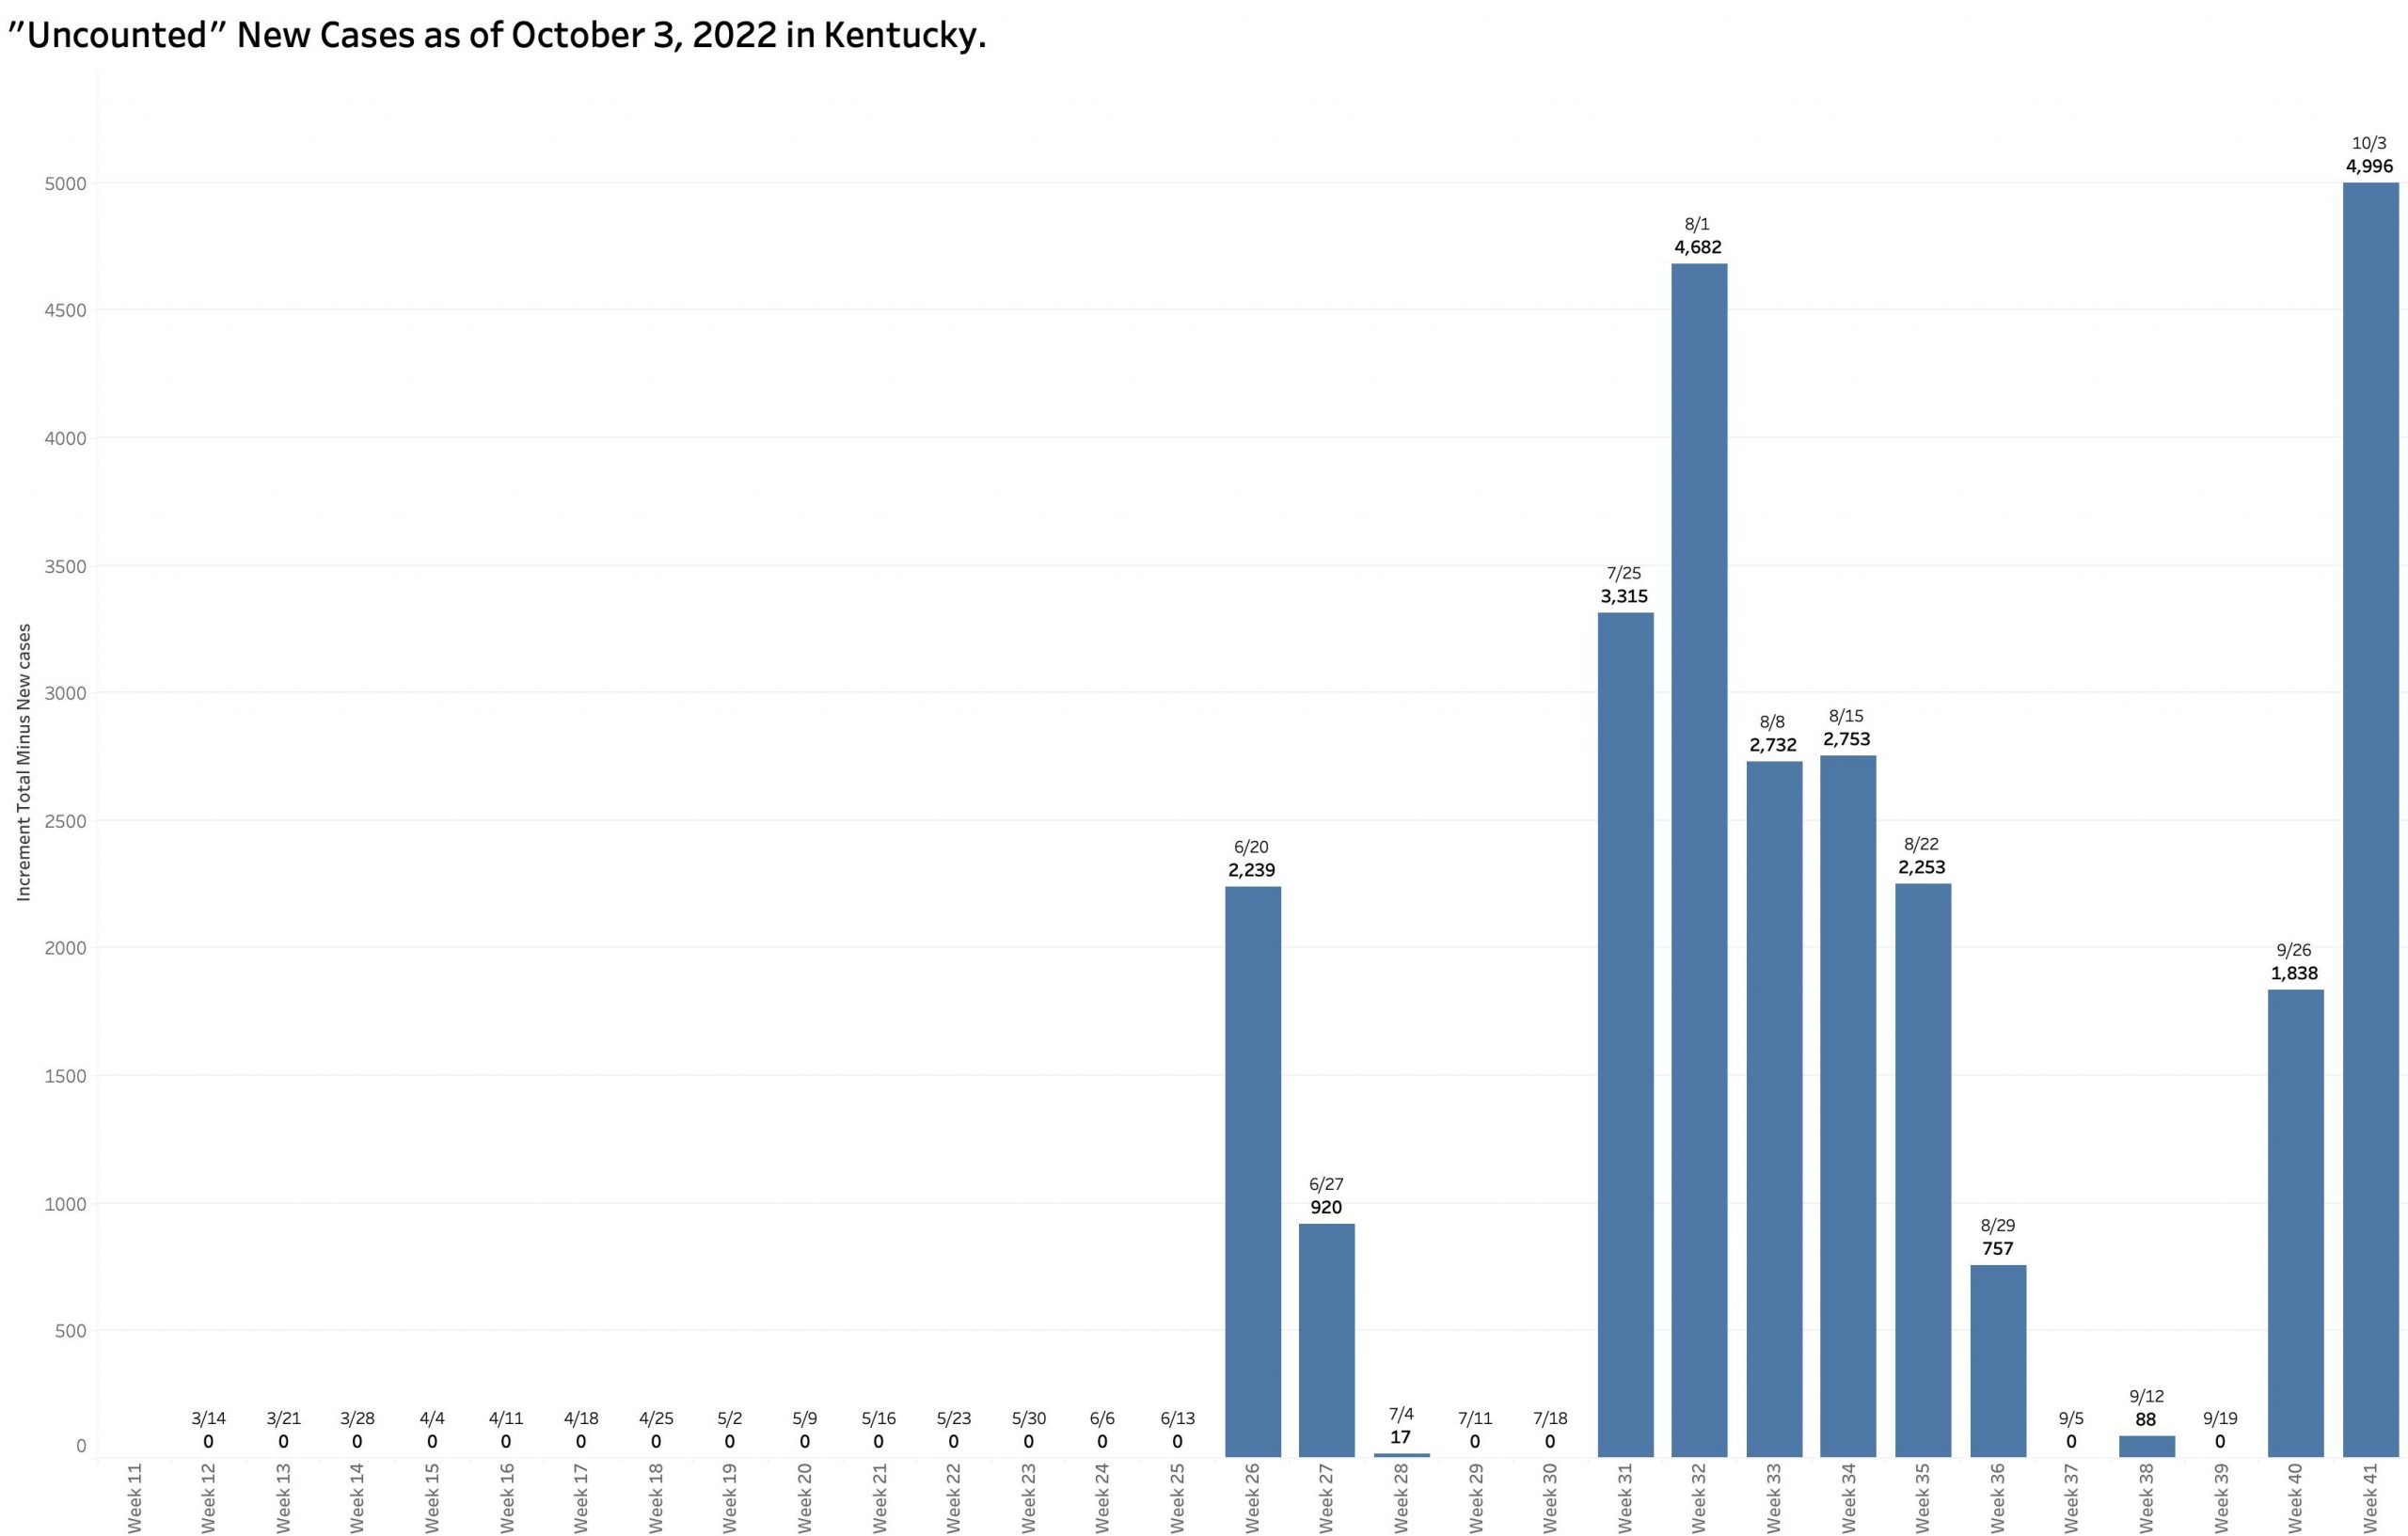
The actual number of new cases added to Kentucky’s running total of cases total is 8,975– little different than the total increments of the past 4 weeks and much higher than last April/May. Looking at it another way, this week’s “uncounted cases” of 4,996 is the highest is has been since the state switched over to a weekly reporting schedule last March. Surely this considerable delay in reporting compromises the basis of policy changes of the past month that led to the dropping broadly of non-medicinal public health measures. Since the calculation of disease incidence rates relies on the accuracy of new case counts, I doubt that only 5 counties are in the red!
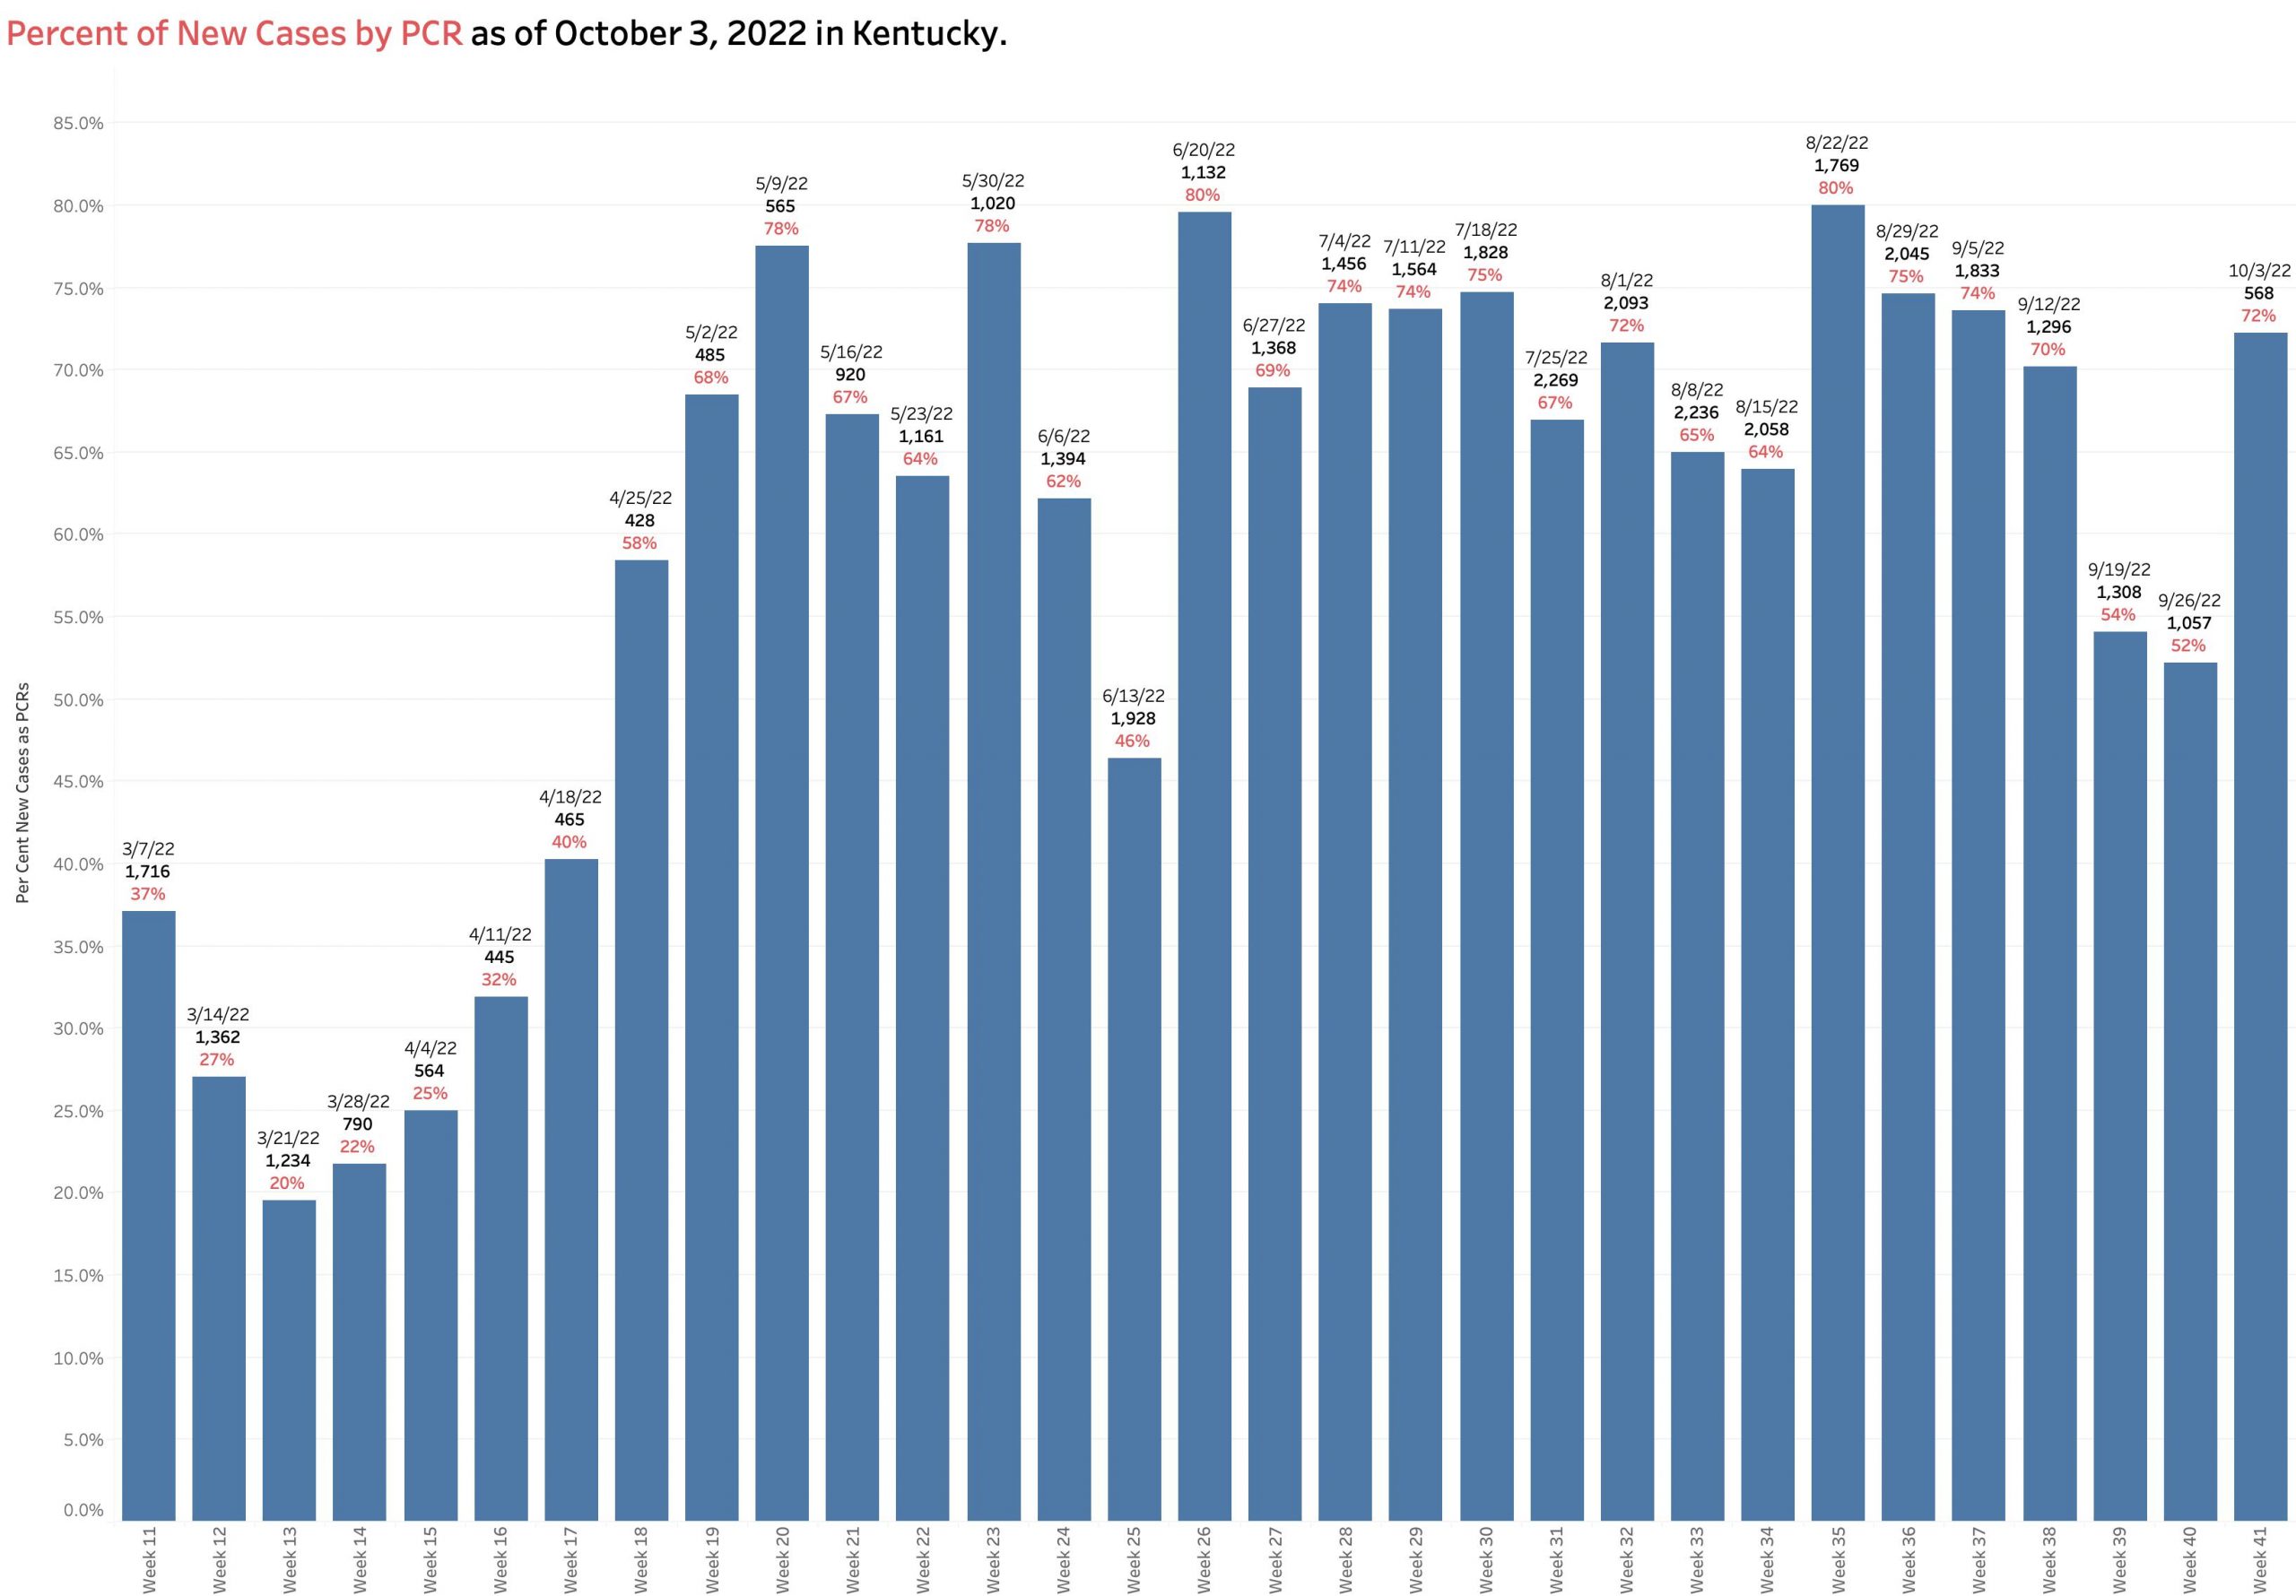
Test Positivity Rates:
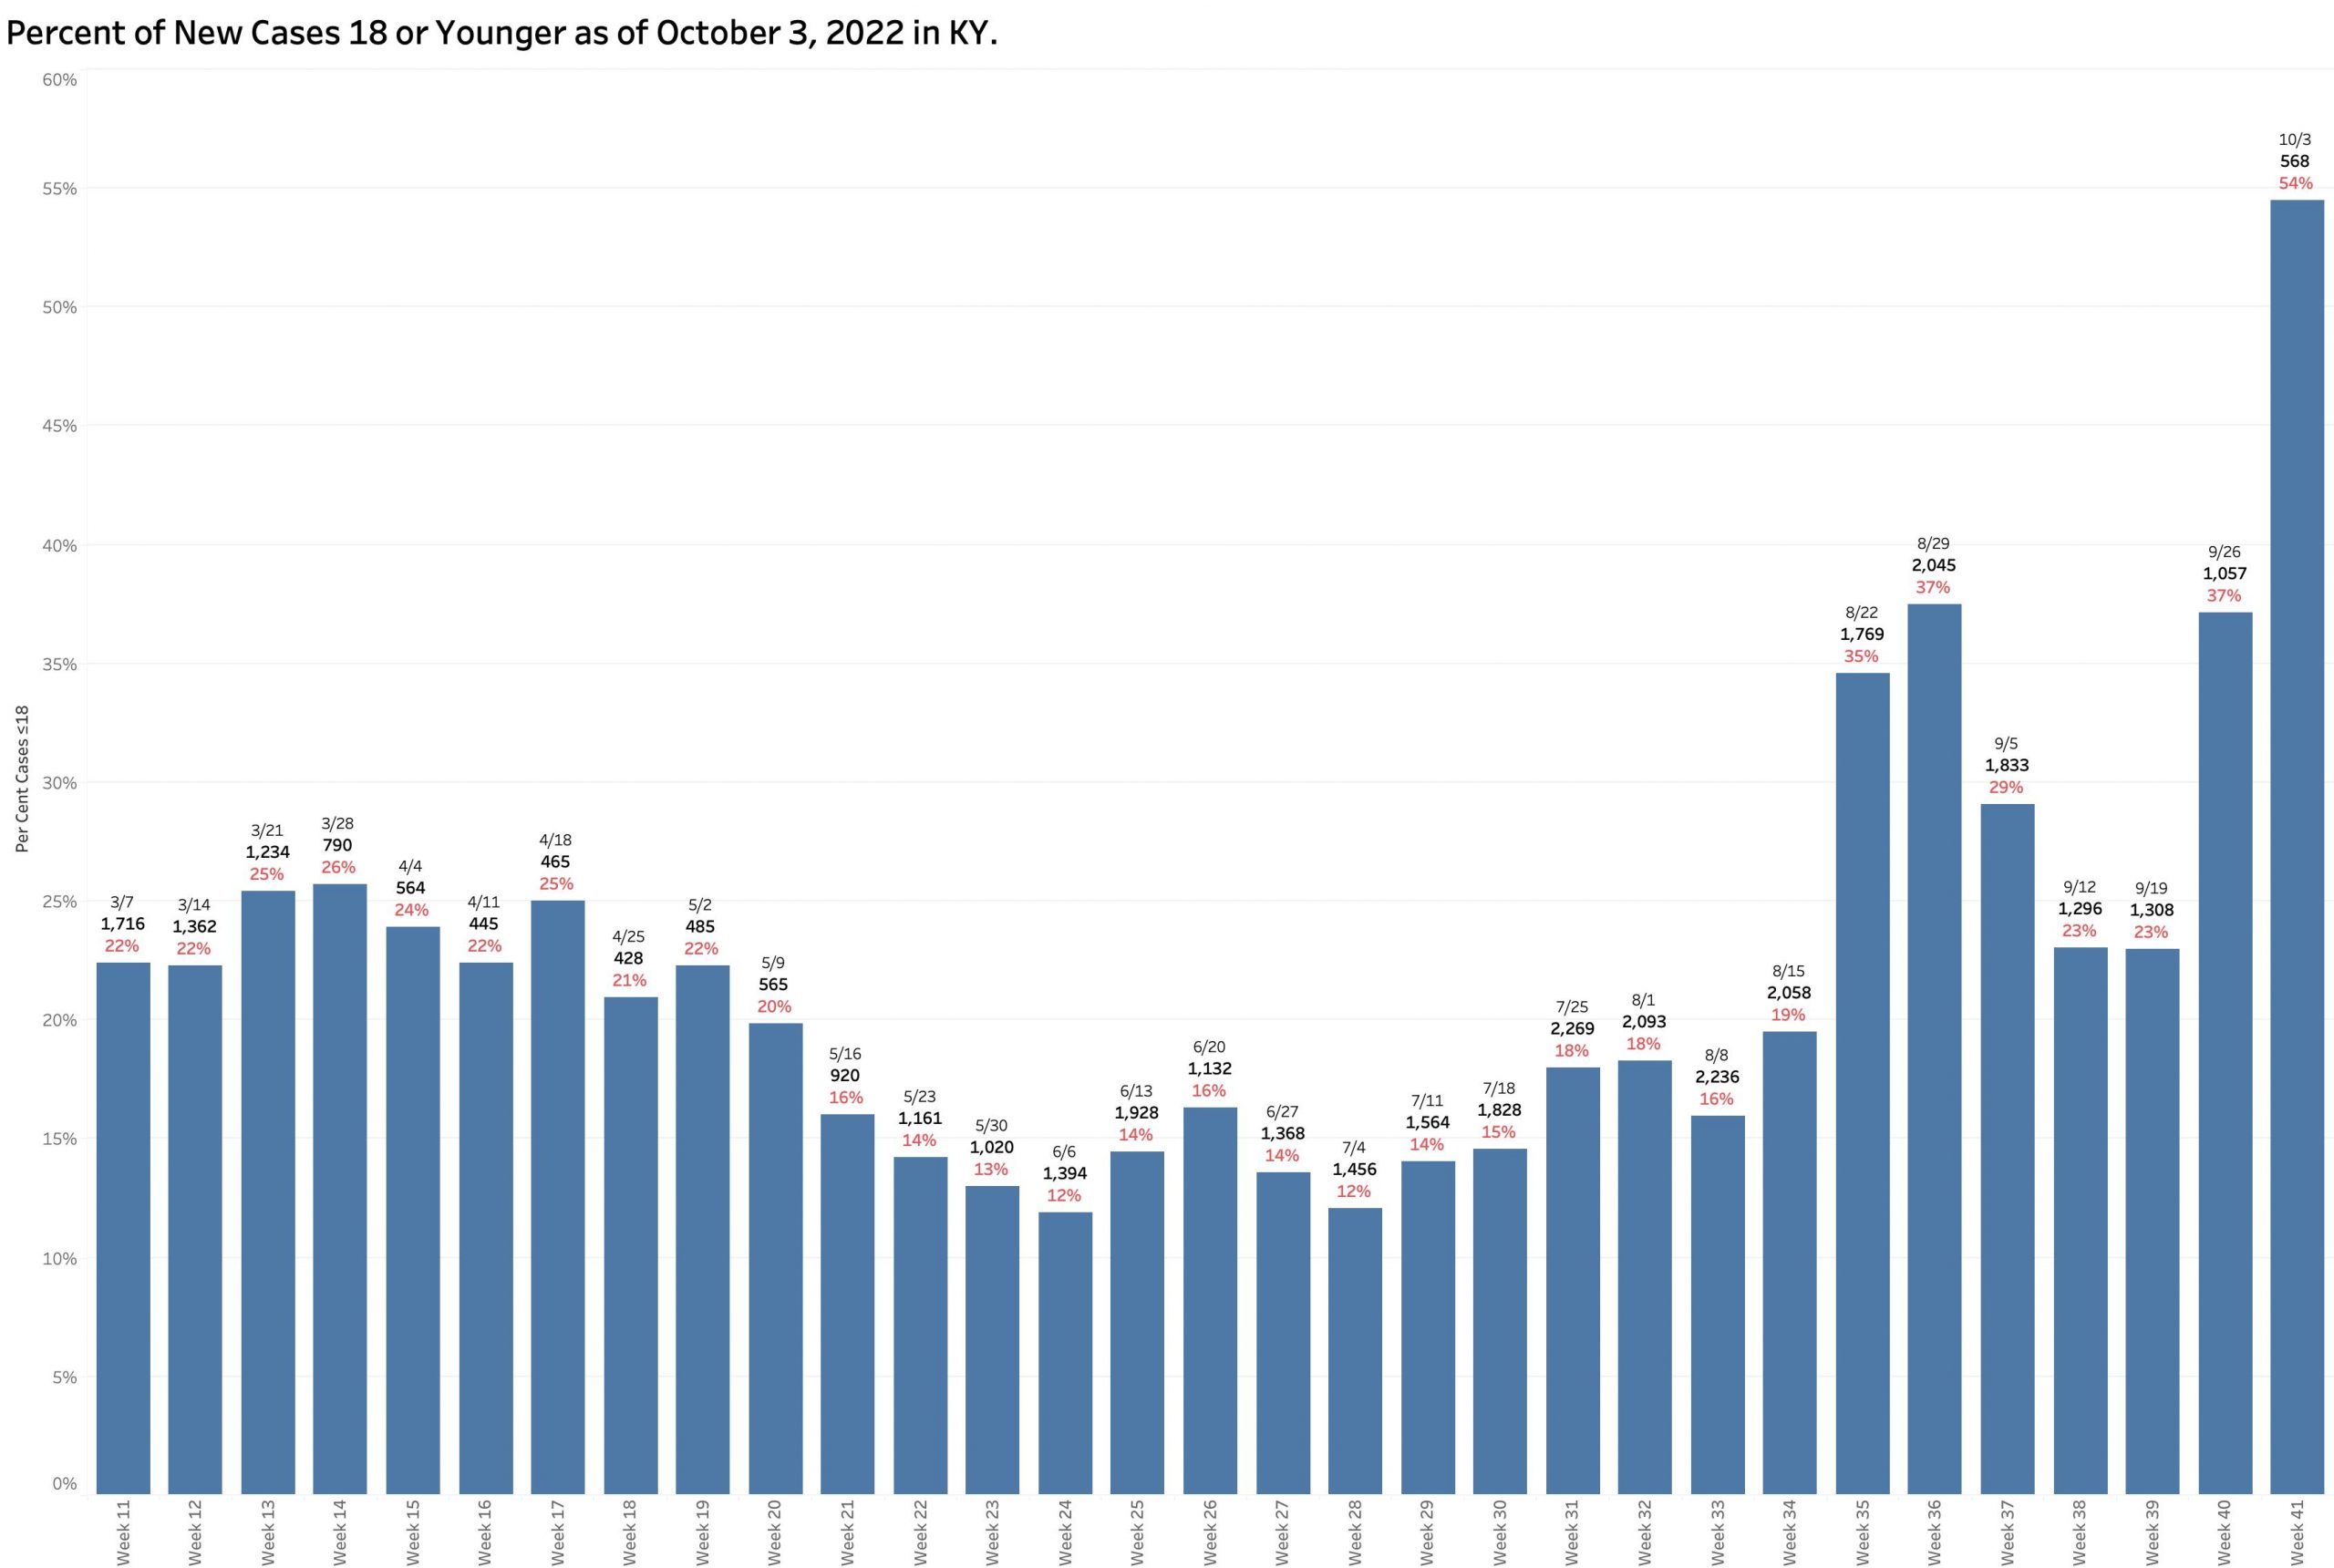
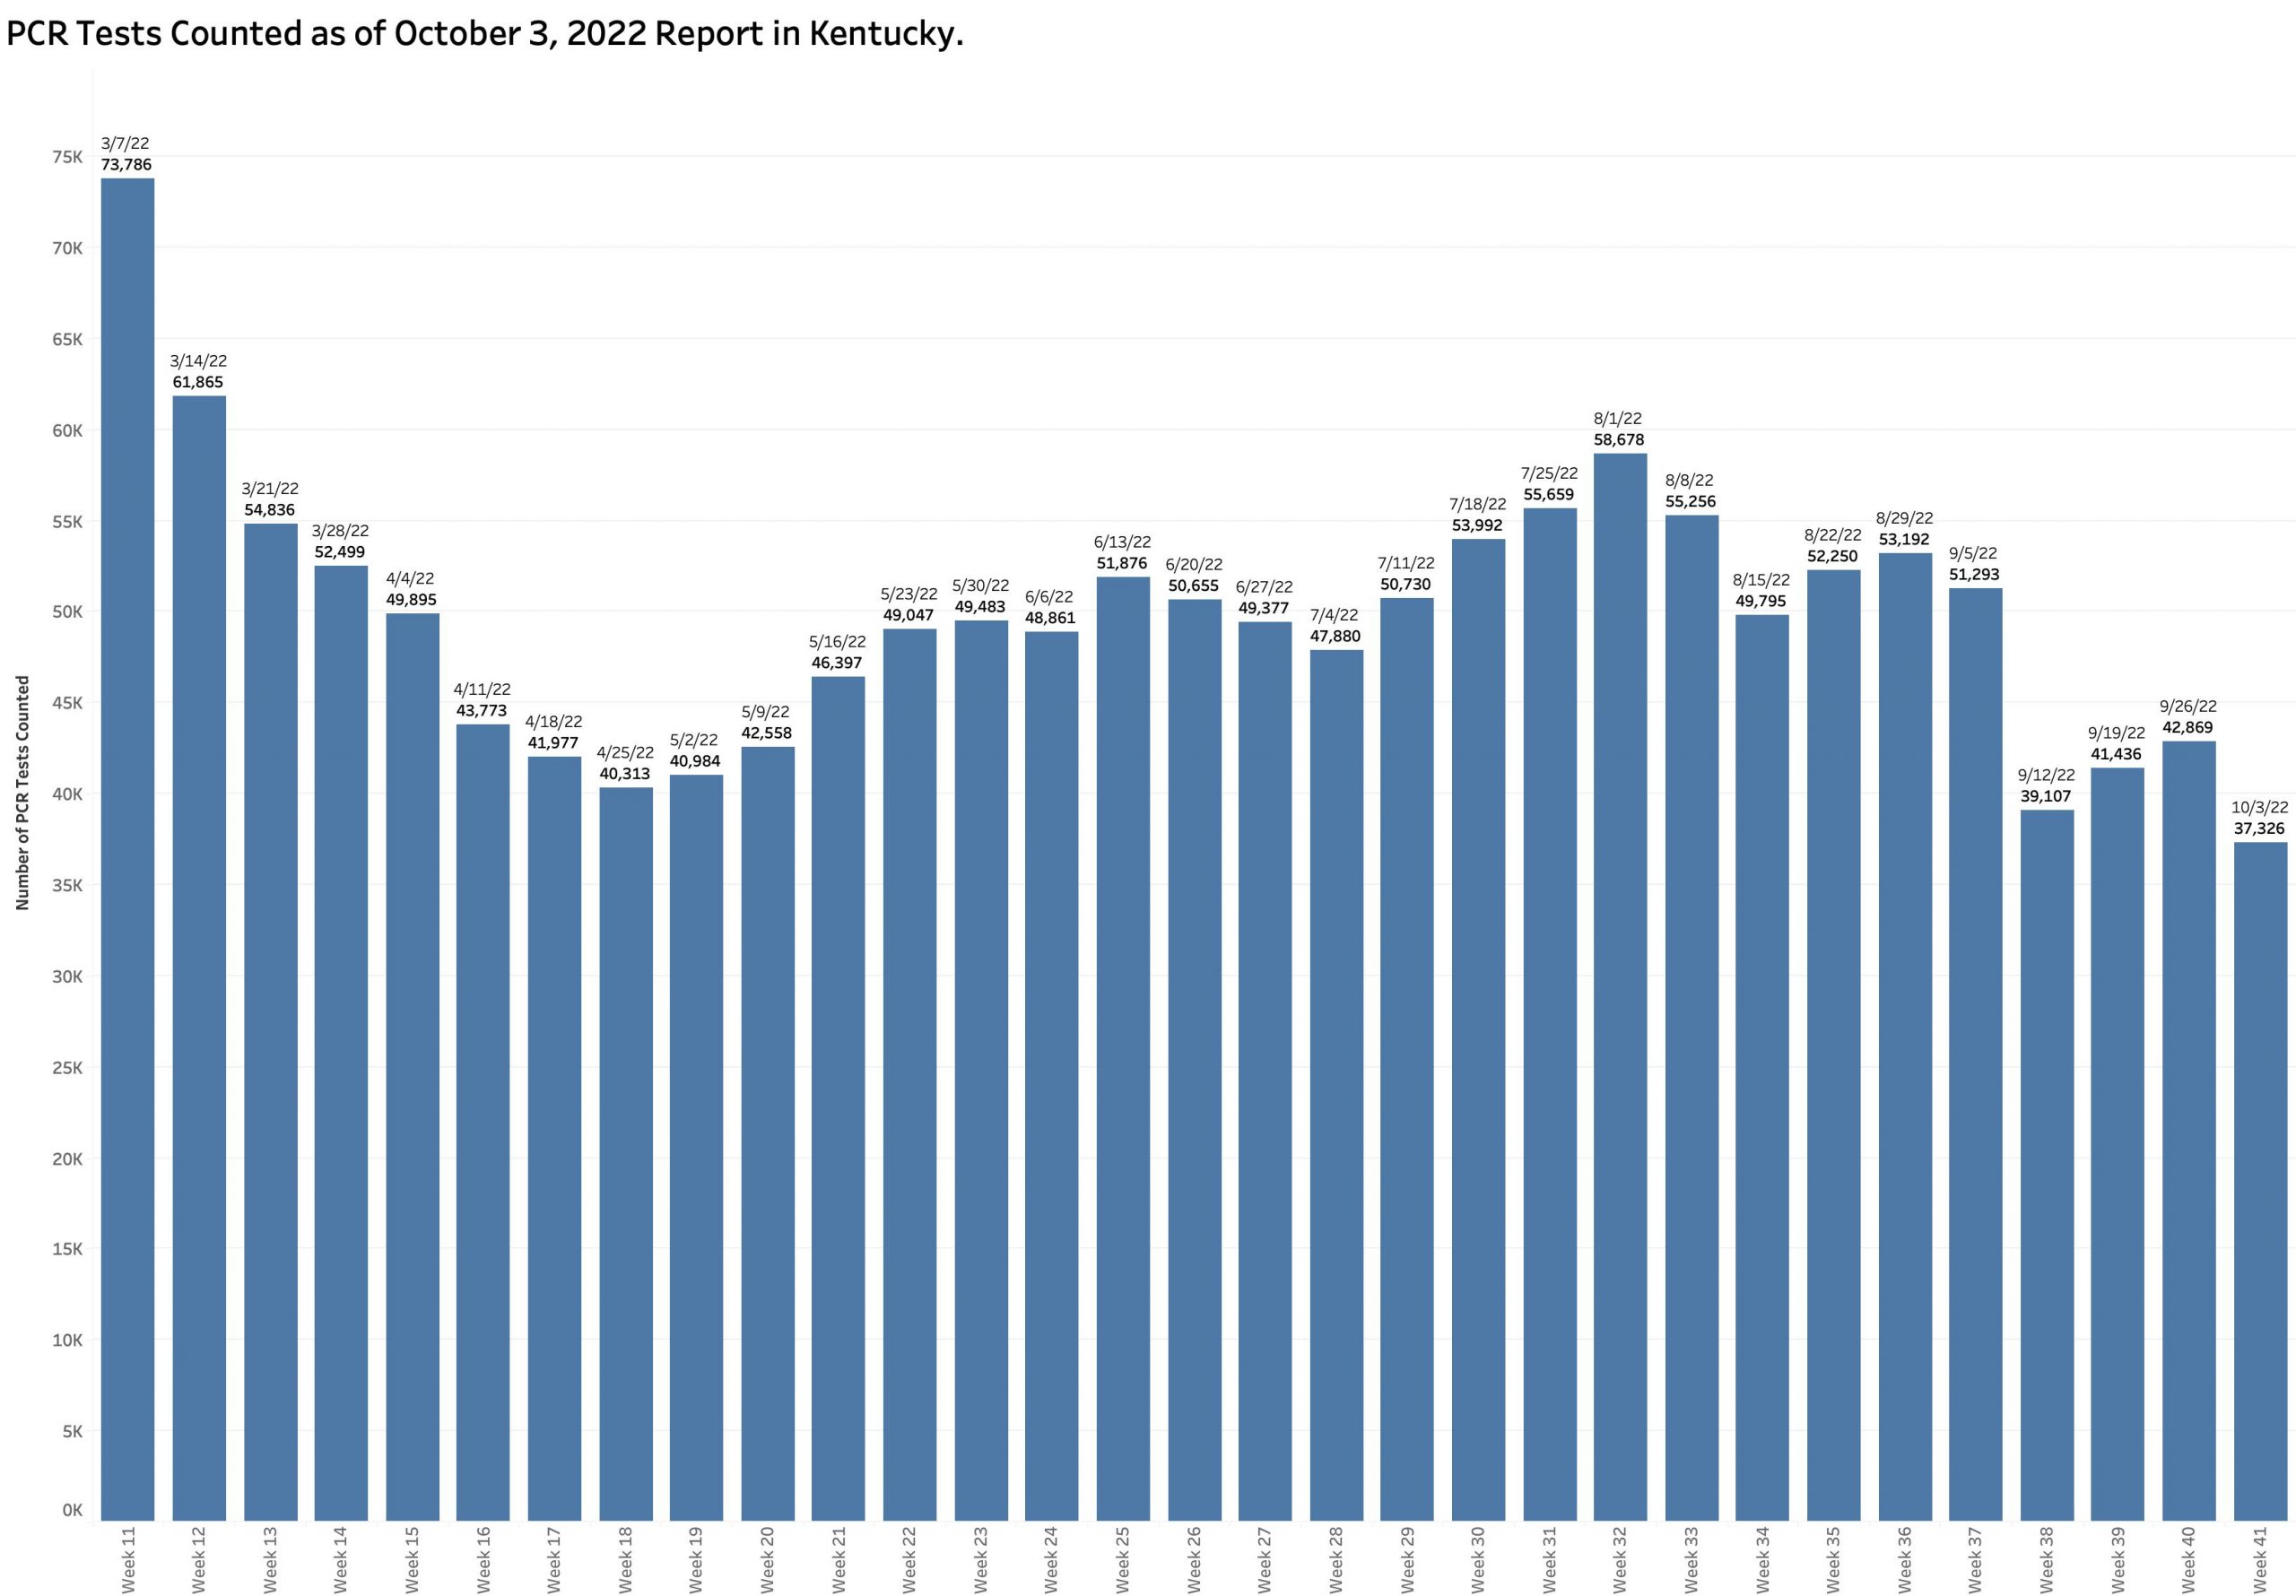
The percent of “new cases” identified by reported PCR viral RNA testing jumped up to 72% from the low 50s of the previous 2 weeks. I am unaware of any systematic or structural changes last week that would alter this ratio so greatly. Additionally, the total number of PCR tests reported from which the positivity rate is calculated dropped to its lowest level since March. That there has been a major perturbation in our testing and reporting structure is evident in the percent of new cases in individuals. Last week the percent of new cases in school-age individuals rocketed up to 54%– the highest by far since the beginning of Kentucky’s Covid-19 epidemic when that number remained below 30%. With apologies to Buffalo Springfield, “There’s something happening here. What it is ain’t exactly clear.”

What are other Covid data aggregators saying?
I am having difficulty reconciling our home-grown Kentucky reports with those of other organizations respected for their reporting of the epidemic (or even the CDC for that matter). The New York Times (that had to sue the federal government to obtain county specific data early in the pandemic) ranks Kentucky as having the highest overall disease incidence rate of any of the 51 states and DC at 27 per 100,000 based on an average daily case number of 1196. Eleven of the top 20 counties ranked nationally by Disease Incidence Rate are in Kentucky– including the top 3. Eastern Kentucky is still a prominent national hot sport of disease activity. A large measure of the differences among reports by other agencies lies in the operational definitions and analytic processes that are intrinsic to the assembly of databases. I have touched on some of these in earlier articles.
I am willing to agree that we in Kentucky and the nation is currently in one of a series of descending’s limbs of the Coronavirus epidemic. I cannot agree at present that we in Kentucky are in as rosy a position as we all want to be. I am willing to hear the arguments that we are not more-or-less on a “plateau” of epidemic activity, or that we can safely let our guard down as the fall and winter seasons progress.
Peter Hasselbacher, MD
Emeritus Professor of Medicine, UofL
Kentucky Health Policy Institute
4 October 2022