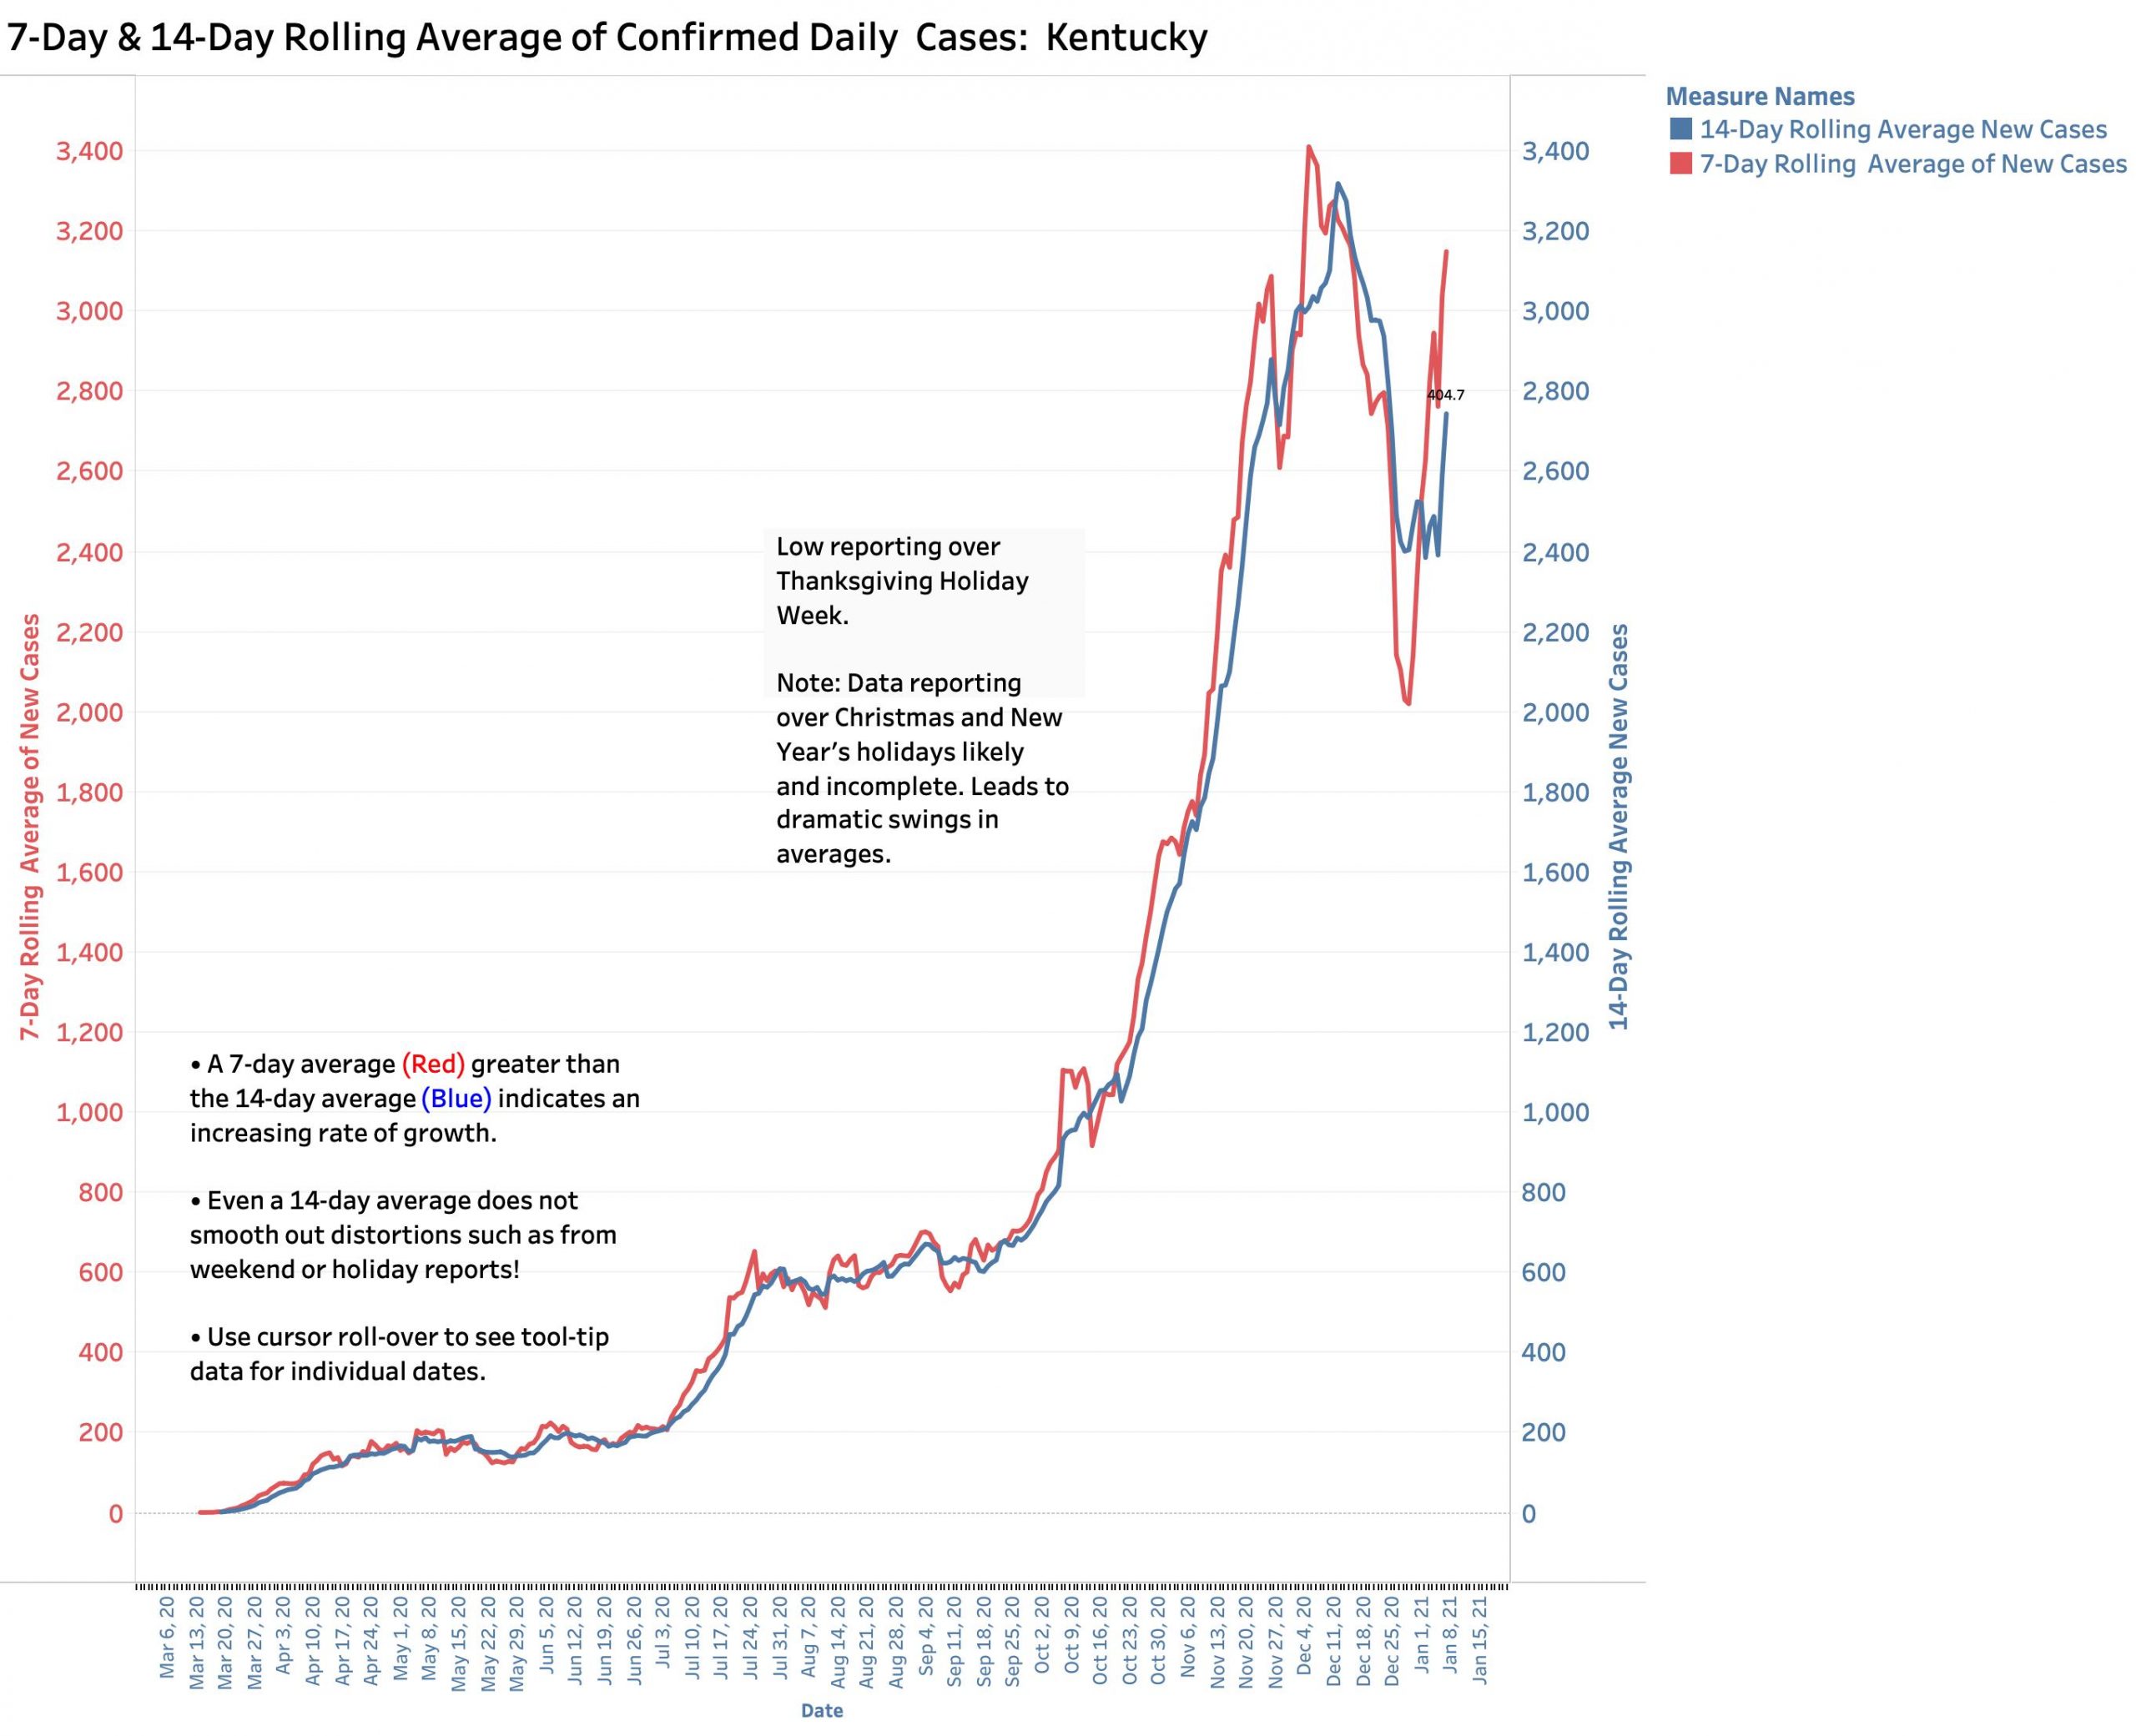
Following this just past long holiday weekend, the outcome of settling back into a predictable weekend rhythm of data collection and reporting remains unsettled. There are hints that the rate of new cases is slowing, but last week (Sunday, Jan. 10th through Saturday, Jan. 16th) had the second highest weekly count, second only to the just prior week. Our 7-Day average of new cases has been falling from its record high for the last 5 days, but the 14-Day average remains at its highest levels. At the current rate of new cases, we will end January with over 100,000 cases for that single month– a new record high. The Aggregate Total Number of cases continues to climb exponentially. If nothing else changes, we could reach a total of 500,000 Covid-19 cases by the middle of February. Where we go the remainder of this week will likely be telling. I refer the reader to the full portfolio of KHPI’s data visualizations on Tableau Public.
Testing and Test Positivity Rate (TPR).
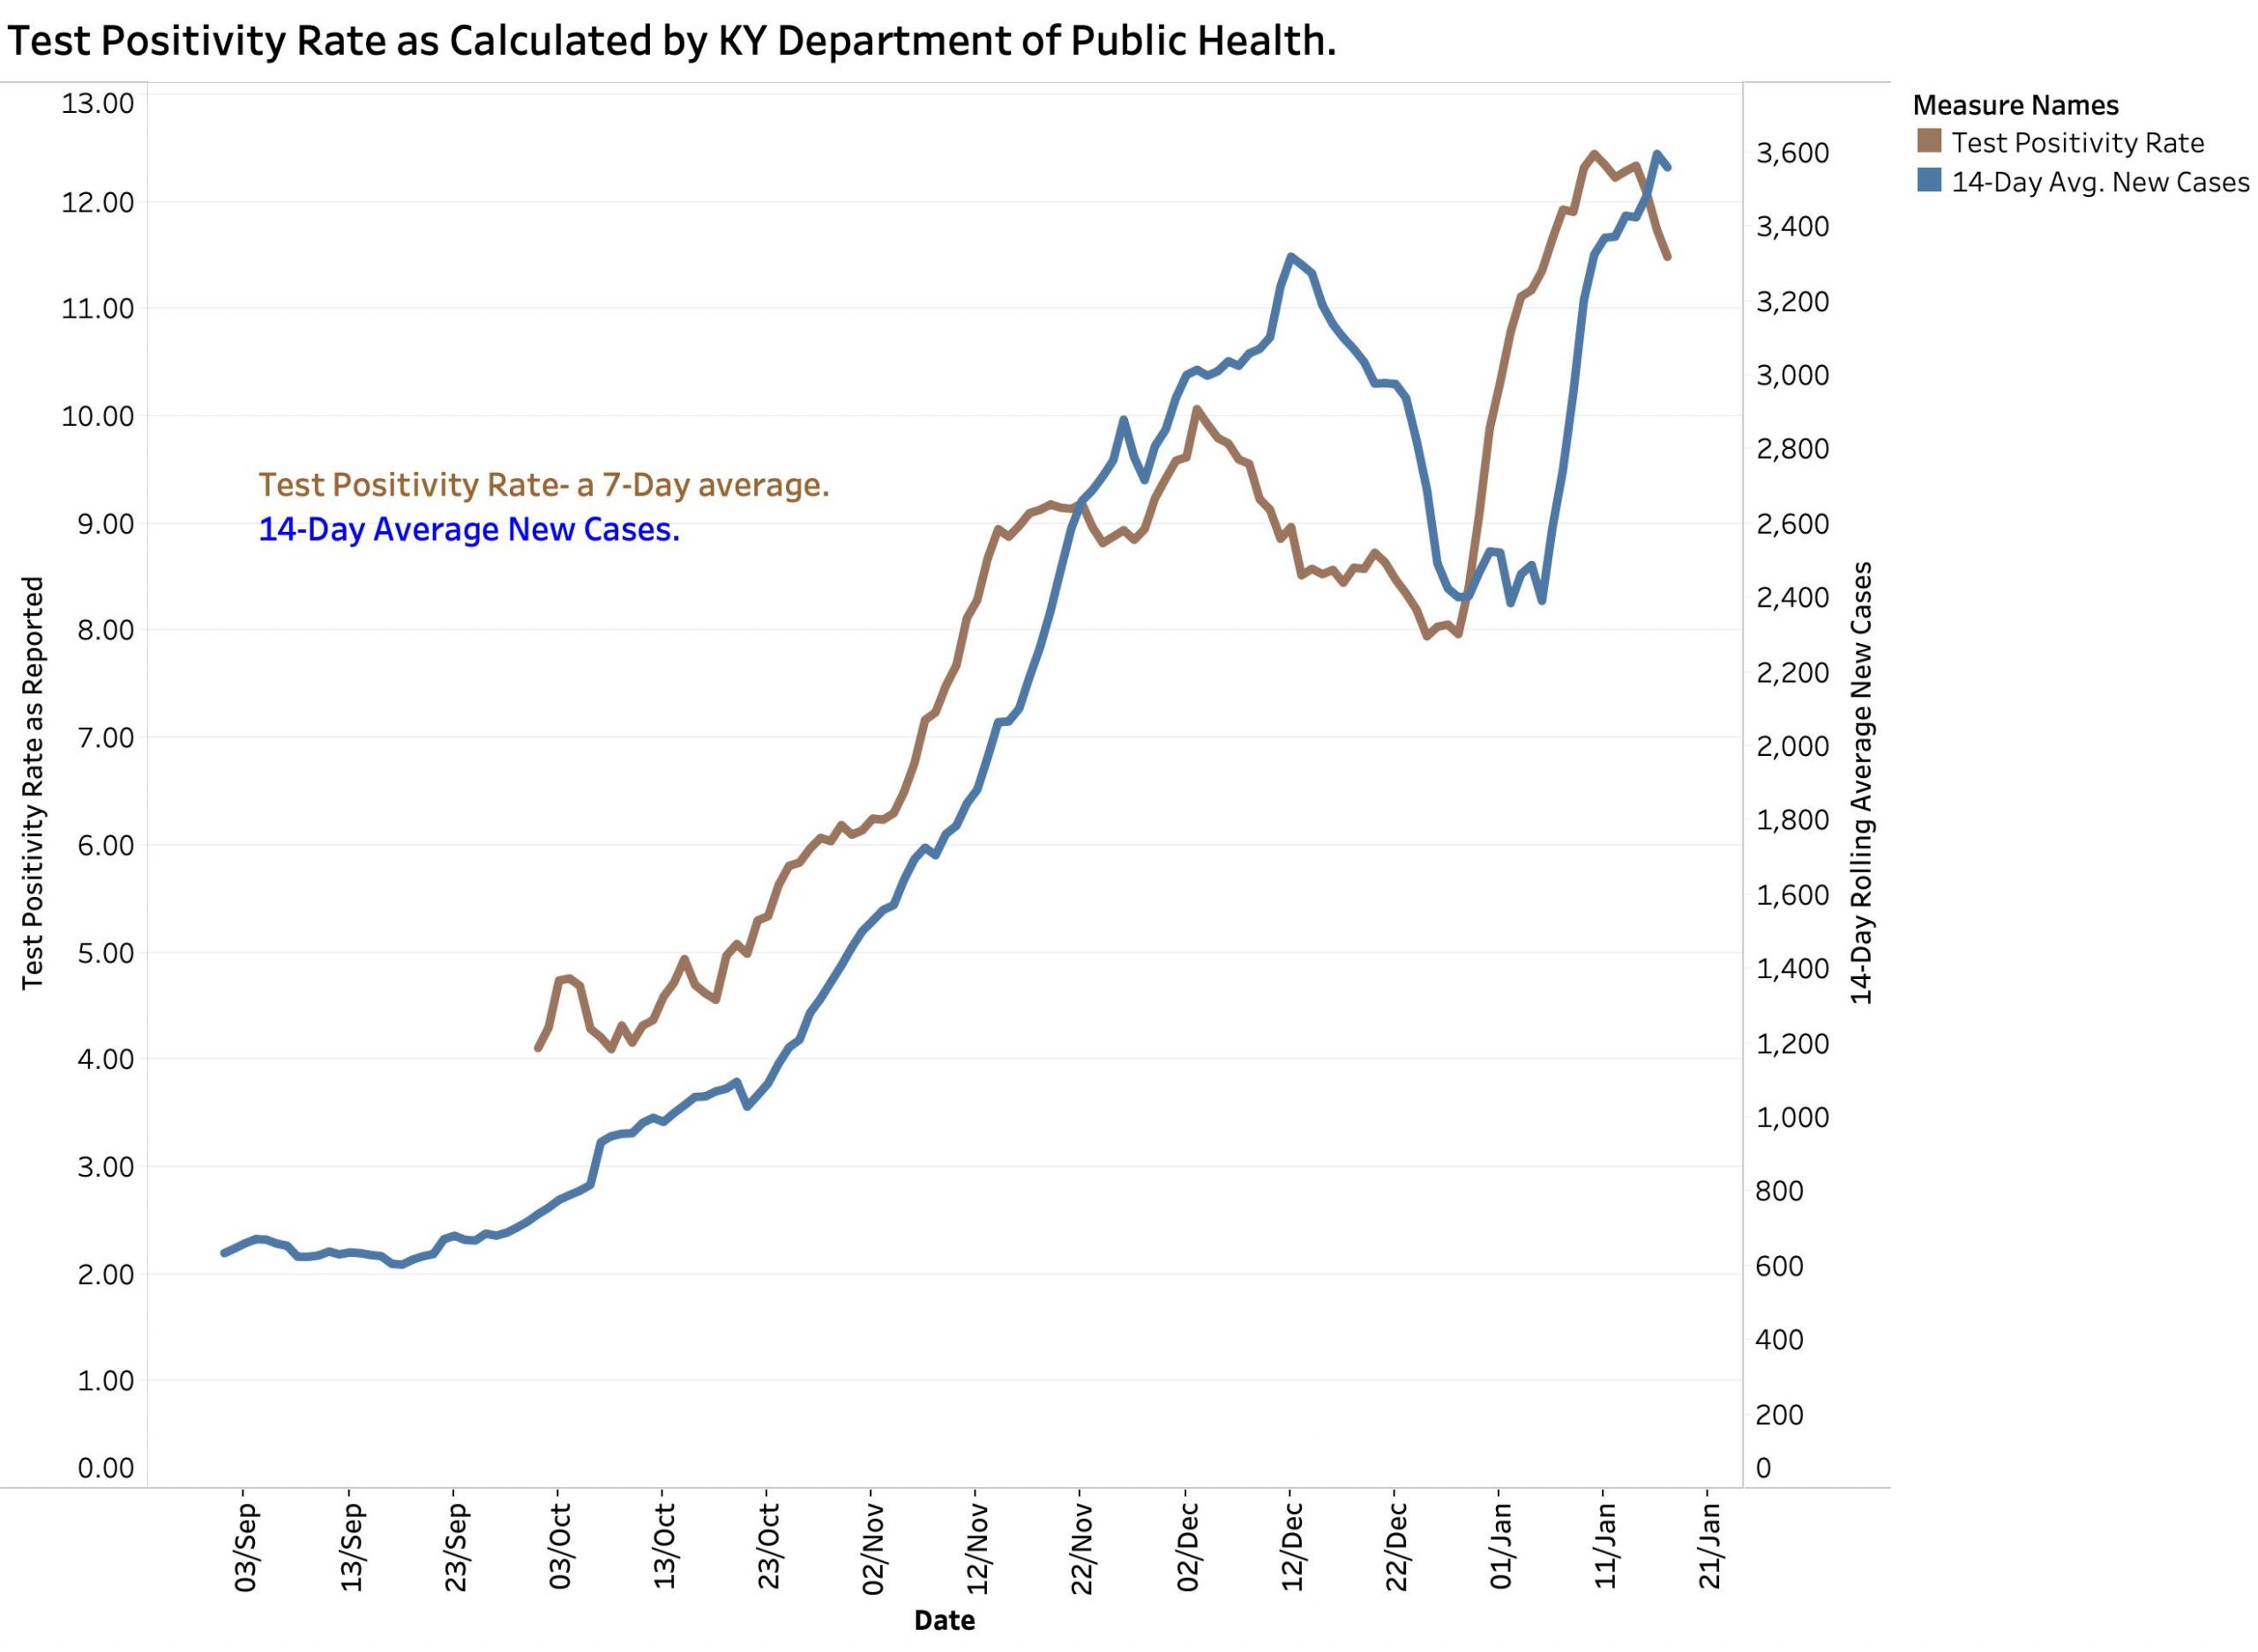
I manually entered the Test Positivity Rates reported by the state since early October into the KHPI database. To make daily calculation of this metric less volitile, the state includes only PCR Viral-RNA tests from swabs, and only from those testing centers that report to the state electronically. Although the major stated reason for calculating this measurement is to determine if enough testing is being done, it is also a truism that if the same kinds of people are being tested and the same number of tests are being performed, that the positivity rate will also reflect the prevalence of active Covid-19 disease in the tested population. Indeed, inspection of the graphic plots shows that the rise and fall of the 14-Day average of new cases tracks the Test Positivity Rate. At least since early October, new cases increased about a week after the Positivity Rate did, and correspondingly decreased when the Positivity Rate did.