
The number of new cases of Omicron infection and the positivity rate of new tests have clearly been diminishing this past week. This has not yet had an impact on overall need for hospitalization or ICU utilization. The Omicron variant has infected more people than did its Delta variant cousin and is not yet done with us!
New Cases.
The release of 3 days’ worth of Omicron’s epidemic numbers Monday evening solidified the observation that, as averaged for the state of Kentucky, the expansion of newly recognized cases is receding. All of the new-case metrics I described last week are headed decidedly in the same favorable direction. Both the 7-Day and the 14-Day average of new cases have been falling for the last 4 or 5 days, held back only by the very high number of cases the week before. The 7-Day average is now less than the 14-Day average by a large margin not seen since last October.
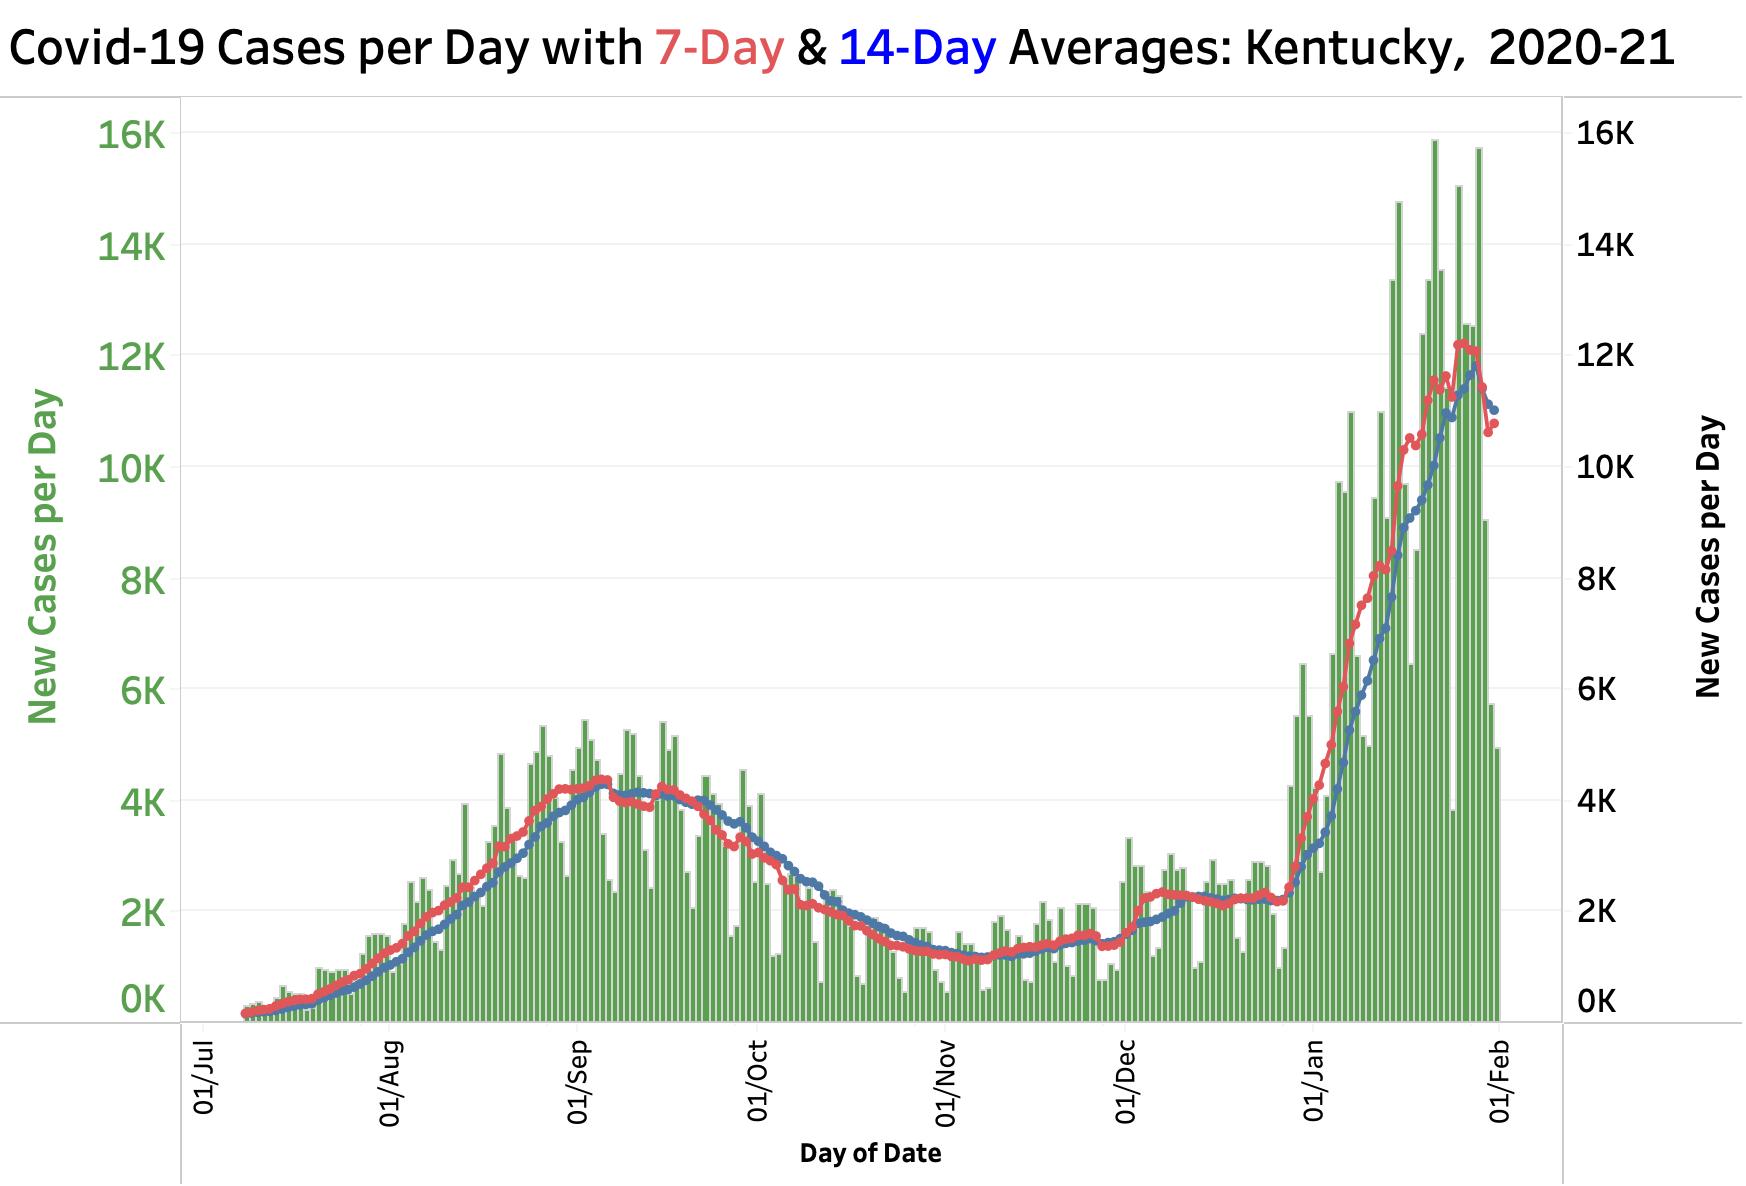
Sunday and Monday counts have been historically the lowest in any week and still are. This week began with 5821 and 4950 announced cases respectively– a far cry from the 12,000 to 15,000 cases of recent weeks. Significantly, both Sunday and Saturday’s new case numbers are much lower than for those days of the previous 2 weeks. This weekday comparison is something relevant we can monitor as this week unwinds. Further evidence of a slowing of epidemic spread is that the rate of new cases may no longer be expanding exponentially as judged by analysis of logarithmic plots.
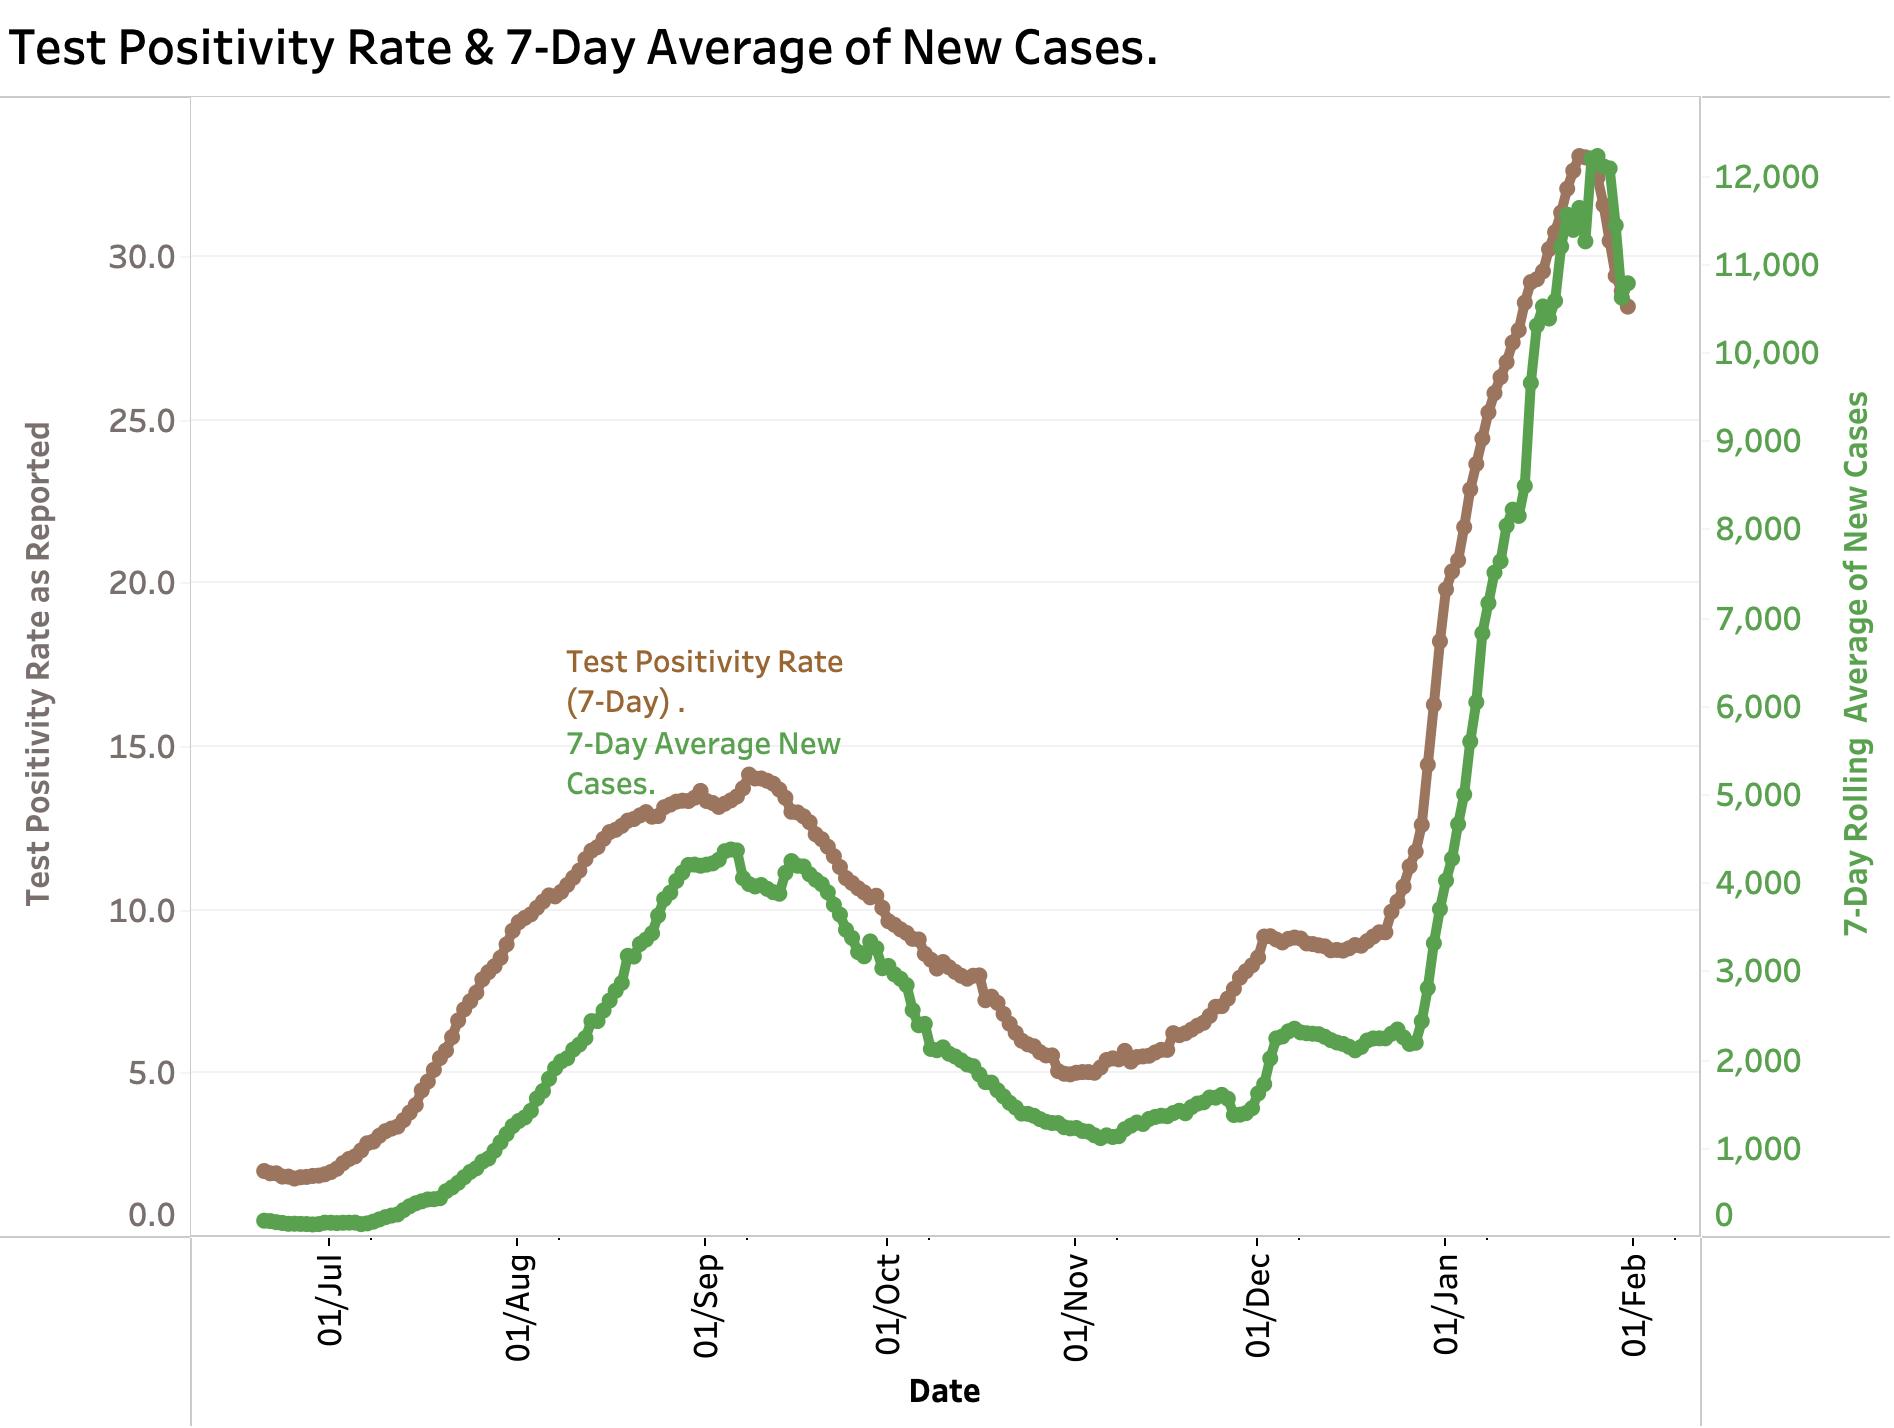
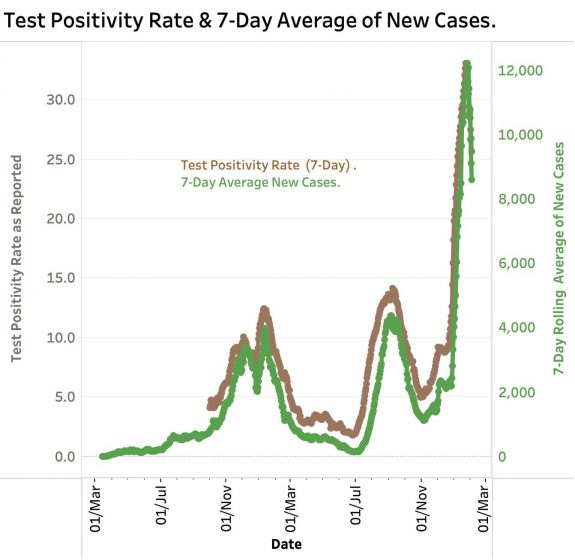
Other good news related to epidemic expansion is that the Test Positivity Rate as calculated by KYDPH has been falling progressively for the 8 days from a peak of 33.1 percent on January 23d, to yesterday’s 28.5. This falling indicator of the prevalence of active disease in the community is occurring during an interval of the highest 7-Day average testing rate of the epidemic.
The Glass is Half-Full.
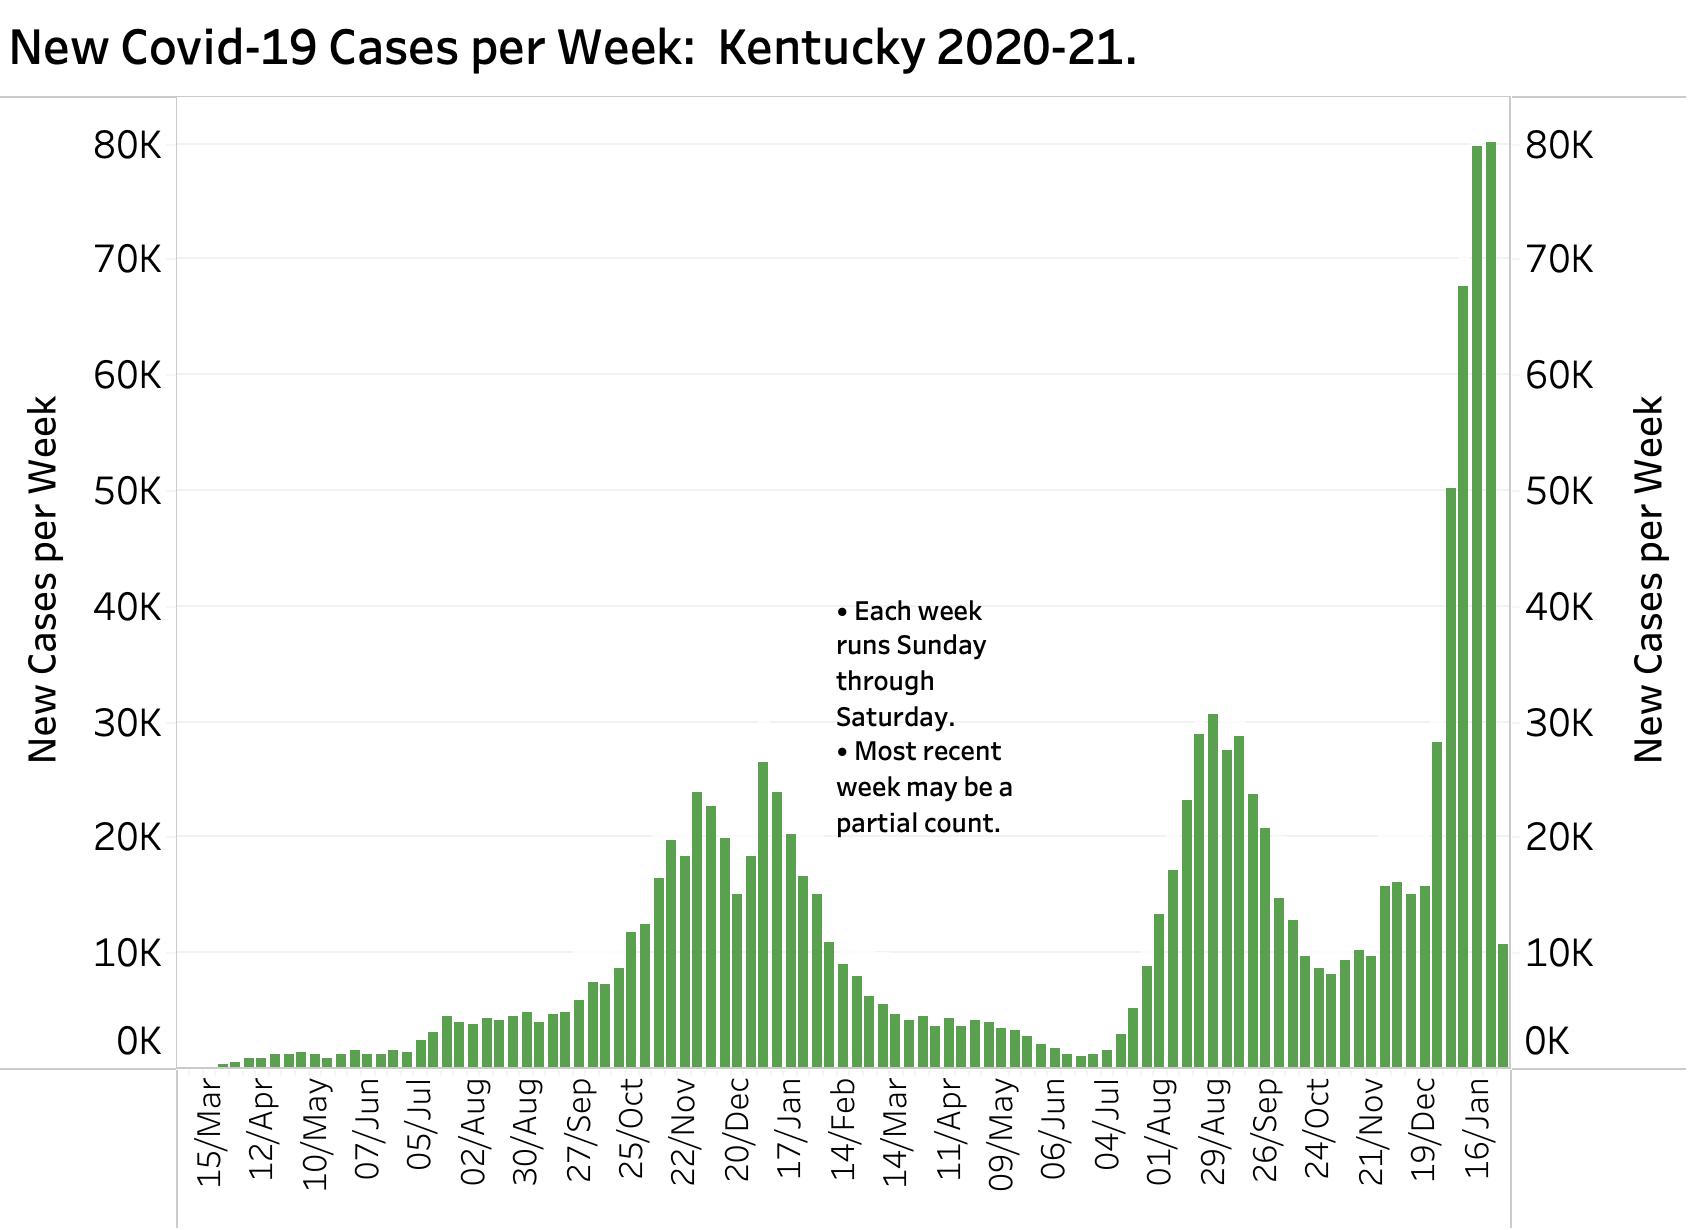
This is not to say we are in a great place. Almost three out of every ten people being tested today have an detectable infection– still twice as high as any day prior to the arrival of Omicron. There were more new cases of Coronavirus last week than any week of Kentucky’s epidemic– three times more than any week of 2020 and 2.6 times higher than any week during the Delta variant surge last year. Maximum weekly counts– while eye catching– have a different impact than the total number of cases beneath the epidemic curves. If we define the Delta surge as the interval from July 1 to October 31, 2021, there were 282,149 new cases of Covid-19 infection. In the Omicron surge so far from December 28, 2021, there were 318,748 new cases announced! This latter total will surely increase dramatically as this variant expands its impact in our more isolated or rural counties.
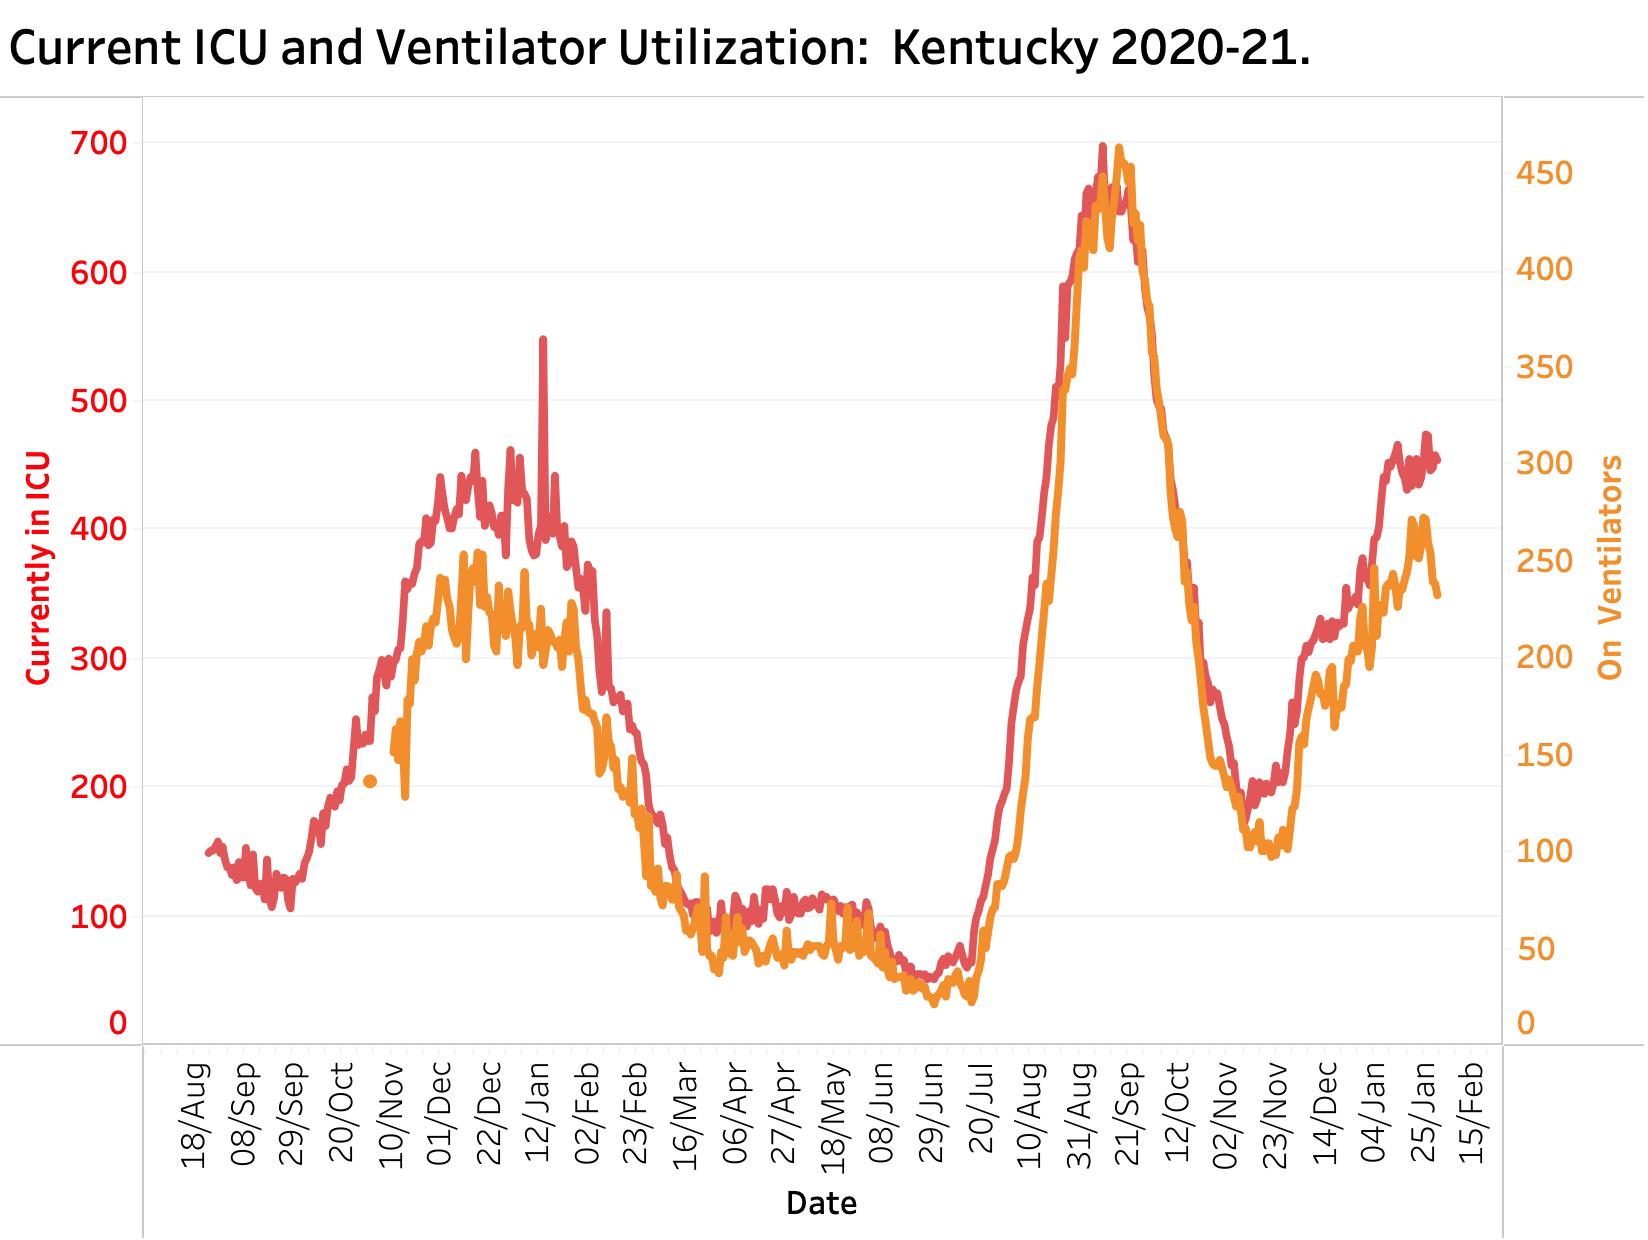
Hospitals &ICUs.
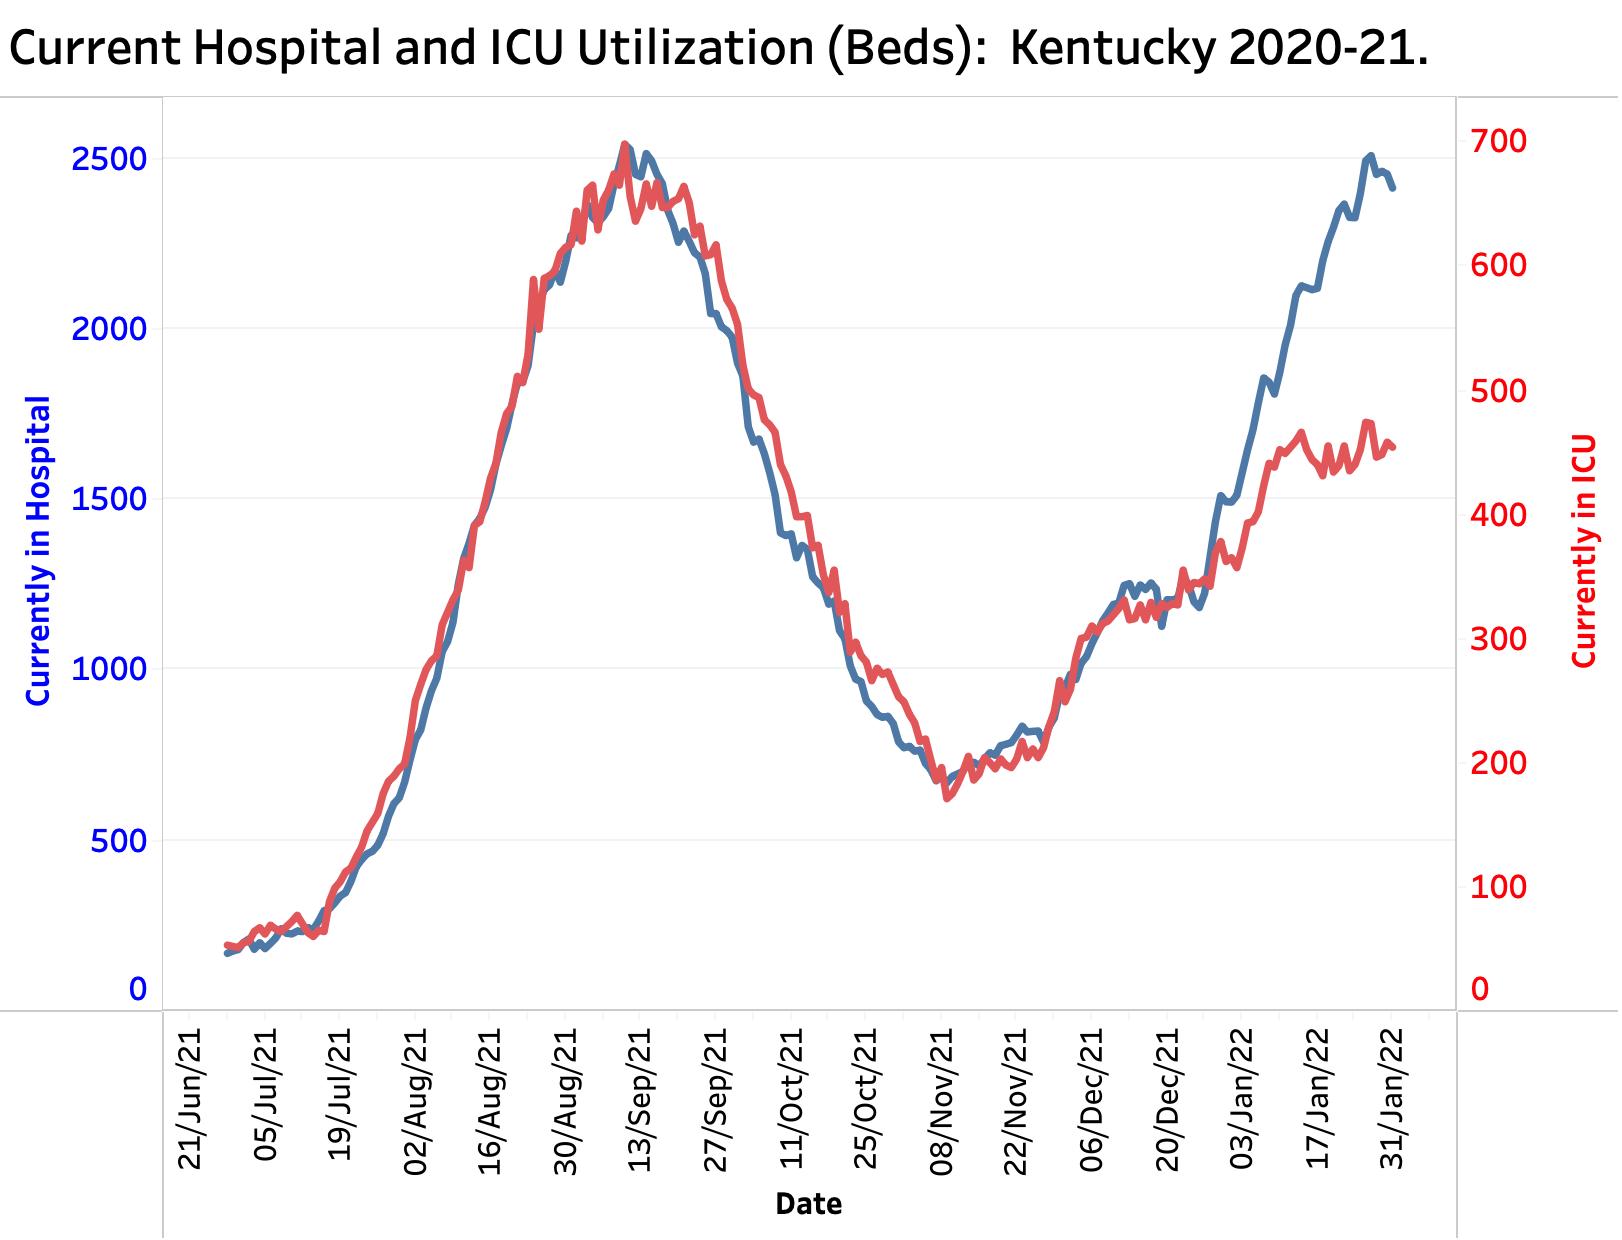
It is not just the number of ambulatory individuals exhaling or coughing the virus walking our streets or who are in our public spaces that contributes to disease burden. Perhaps more important is the impact on the health care system that takes care of us. The number of individuals with Covid-19 in Kentucky hospitals is as high as it has ever been and is not yet going down. Hospitals, their workers, and the patients they serve are in precarious positions. It is true that a smaller proportion of hospitalized individuals end up in ICUs than those who caught the Delta variant. Intensive Care Unit occupancy, while not as high as during the Delta surge, is as high today as it was in the summer of 2020. The need for artificial ventilation has tracked ICU occupancy throughout and is a strong predictor for death. The impact of Omicron on mortality rates remains unknown, as are its sequela on long-term health. There are more than enough reasons, both medical and financial, to avoid Coronavirus infection if possible!
I have updated the basic data in the visualizations on KHPI’s Tableau Public website and will do so again this evening. You can interactively change the date ranges of individual weekdays to explore the data..
Peter Hasselbacher, MD
Emeritus Professor of Medicine, UofL
February 1, 2022
(February already! Can you believe it? Covid Day #699.)
[Addendum 5 Feb 2022:
Friday evening’s data report shows continuing and more sharply decreasing New Cases and Test Positivity Rates. Both are still quite high– more than double those rates seen with Alpha or Delta. Tonight, Saturday, will close out the week. Saturdays are typically a major reporting day but we will not have those numbers until Monday evening.
Waiting for hospital numbers to show the same major change. Deaths will take a while yet to show their faces. There is reason to believe mortality rates will not be as bad as with the earlier variants.
P Hasselbacher ]