
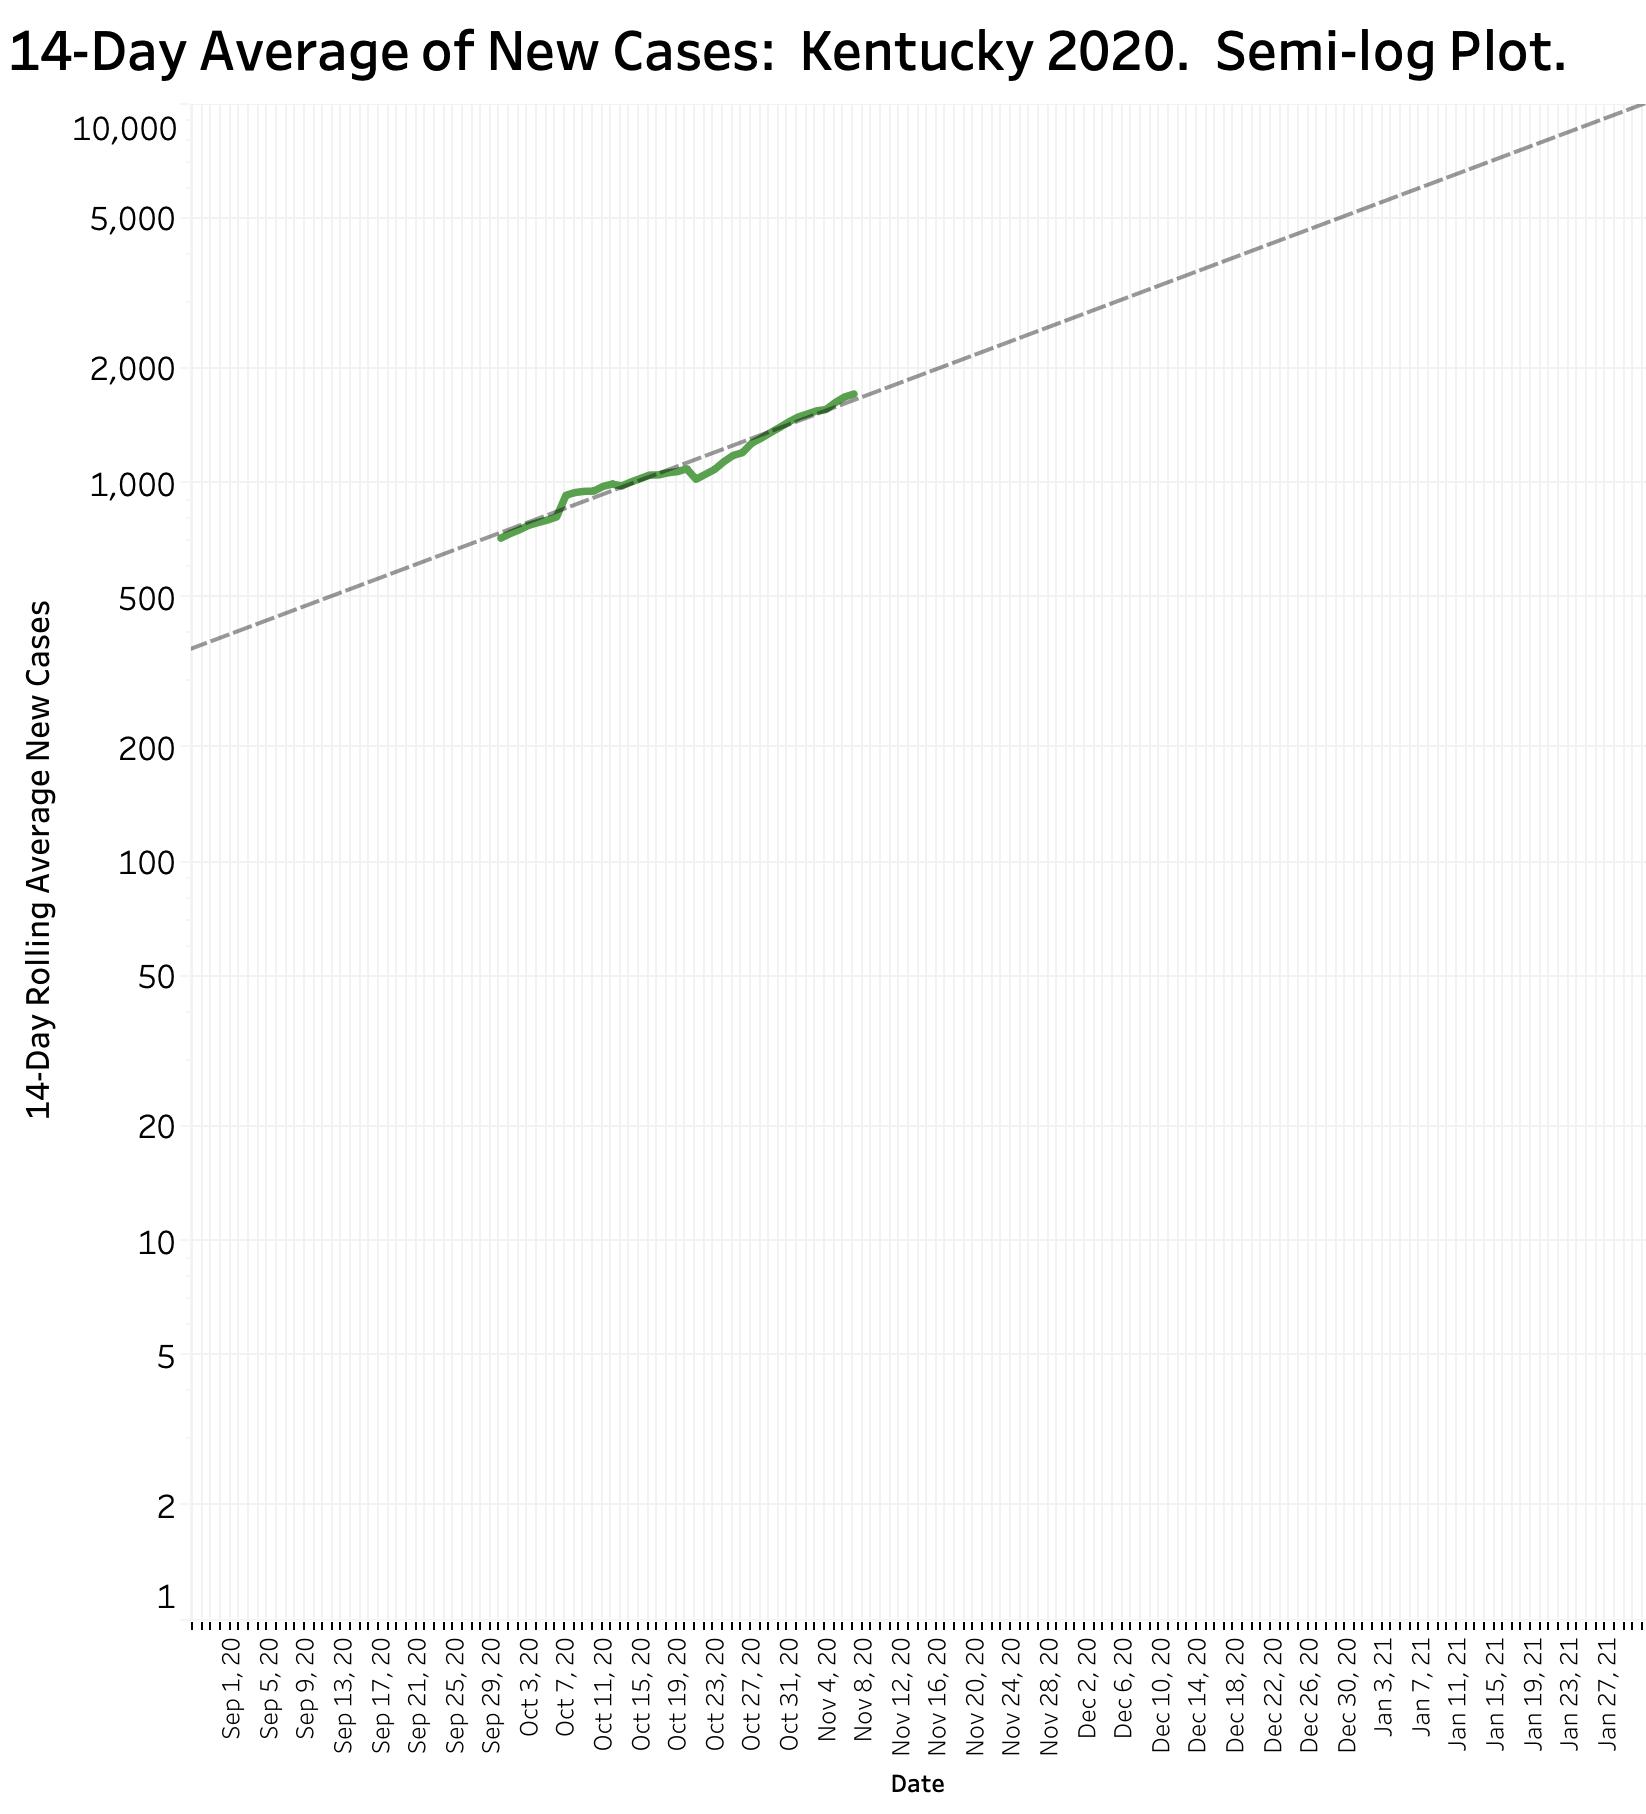
Sadly, and disappointedly, there has been no change in the trajectory of Kentucky’s Coronavirus epidemic since last week’s summary report. The number of new cases continues to set new records daily or almost every other day, now doubling every 4 to 5 weeks. Weekly cases have been relentlessly setting new records since early September. Fourteen-day rolling averages since early September closely follow a trajectory that could generate some 5000 new cases per day by the end of December and 10,000 by the end of next January if the trend continues unabated. It is no consolation that the Country as a whole is doing even worse. Surely it cannot go on like this– it must not!
Hospitals.
Reliable estimates of hospital and ICU utilization by Covid-19 patients have never been higher than during this past week. The pre-epidemic inventory of ICU beds in some hospitals in the state has been fully occupied with both Covid-19 and other very sick patients such that other areas of hospitals have been repurposed into intensive observation and treatment facilities.
Deaths.
One metric not did not hit a new record last week was that weekly attributed deaths from Coronavirus fell modestly from their record high the week beginning October 18, but are still higher than at any earlier time since our state epidemic began. It is universally accepted that deaths (and other permanent harms) lag weeks behind the onset of individual infections. Numbers of deaths will surely increase.
We already have learned enough about what is effective in reducing the damage to person and purse from this epidemic but lack the sense of societal cooperation and fairness to fully implement these remedies. As long as so many of us consider it a badge of honor to pretend that we are helpless to do anything to protect ourselves and our neighbors, things can only get worse faster.
Death is not the only unwished for result of Coronavirus infection. In many, if not most patients, the disease is a systemic one with some individuals of different ages or with various preexisting medical or social conditions being hit much harder than others. For example, Covid-19 can damage small blood vessels everywhere in the body causing potential permanent heart, lung, kidney, brain, or other internal organ involvement. A human being needs to start and continue with as much full function of these organs as possible to live out a normal lifespan. Some of these “recovering” folks are already being categorized as “Long-Haulers,” but the full impact of this disease on mortality and morbidity has yet to be revealed. The takeaway is that it is not good to catch this virus. It will certainly change the lives of many who survive their loss of smell. Intentionally exposing oneself or others to this disease is just irresponsible, and to quote another, just plain dumb.
What else might we learn about Kentucky’s epidemic?
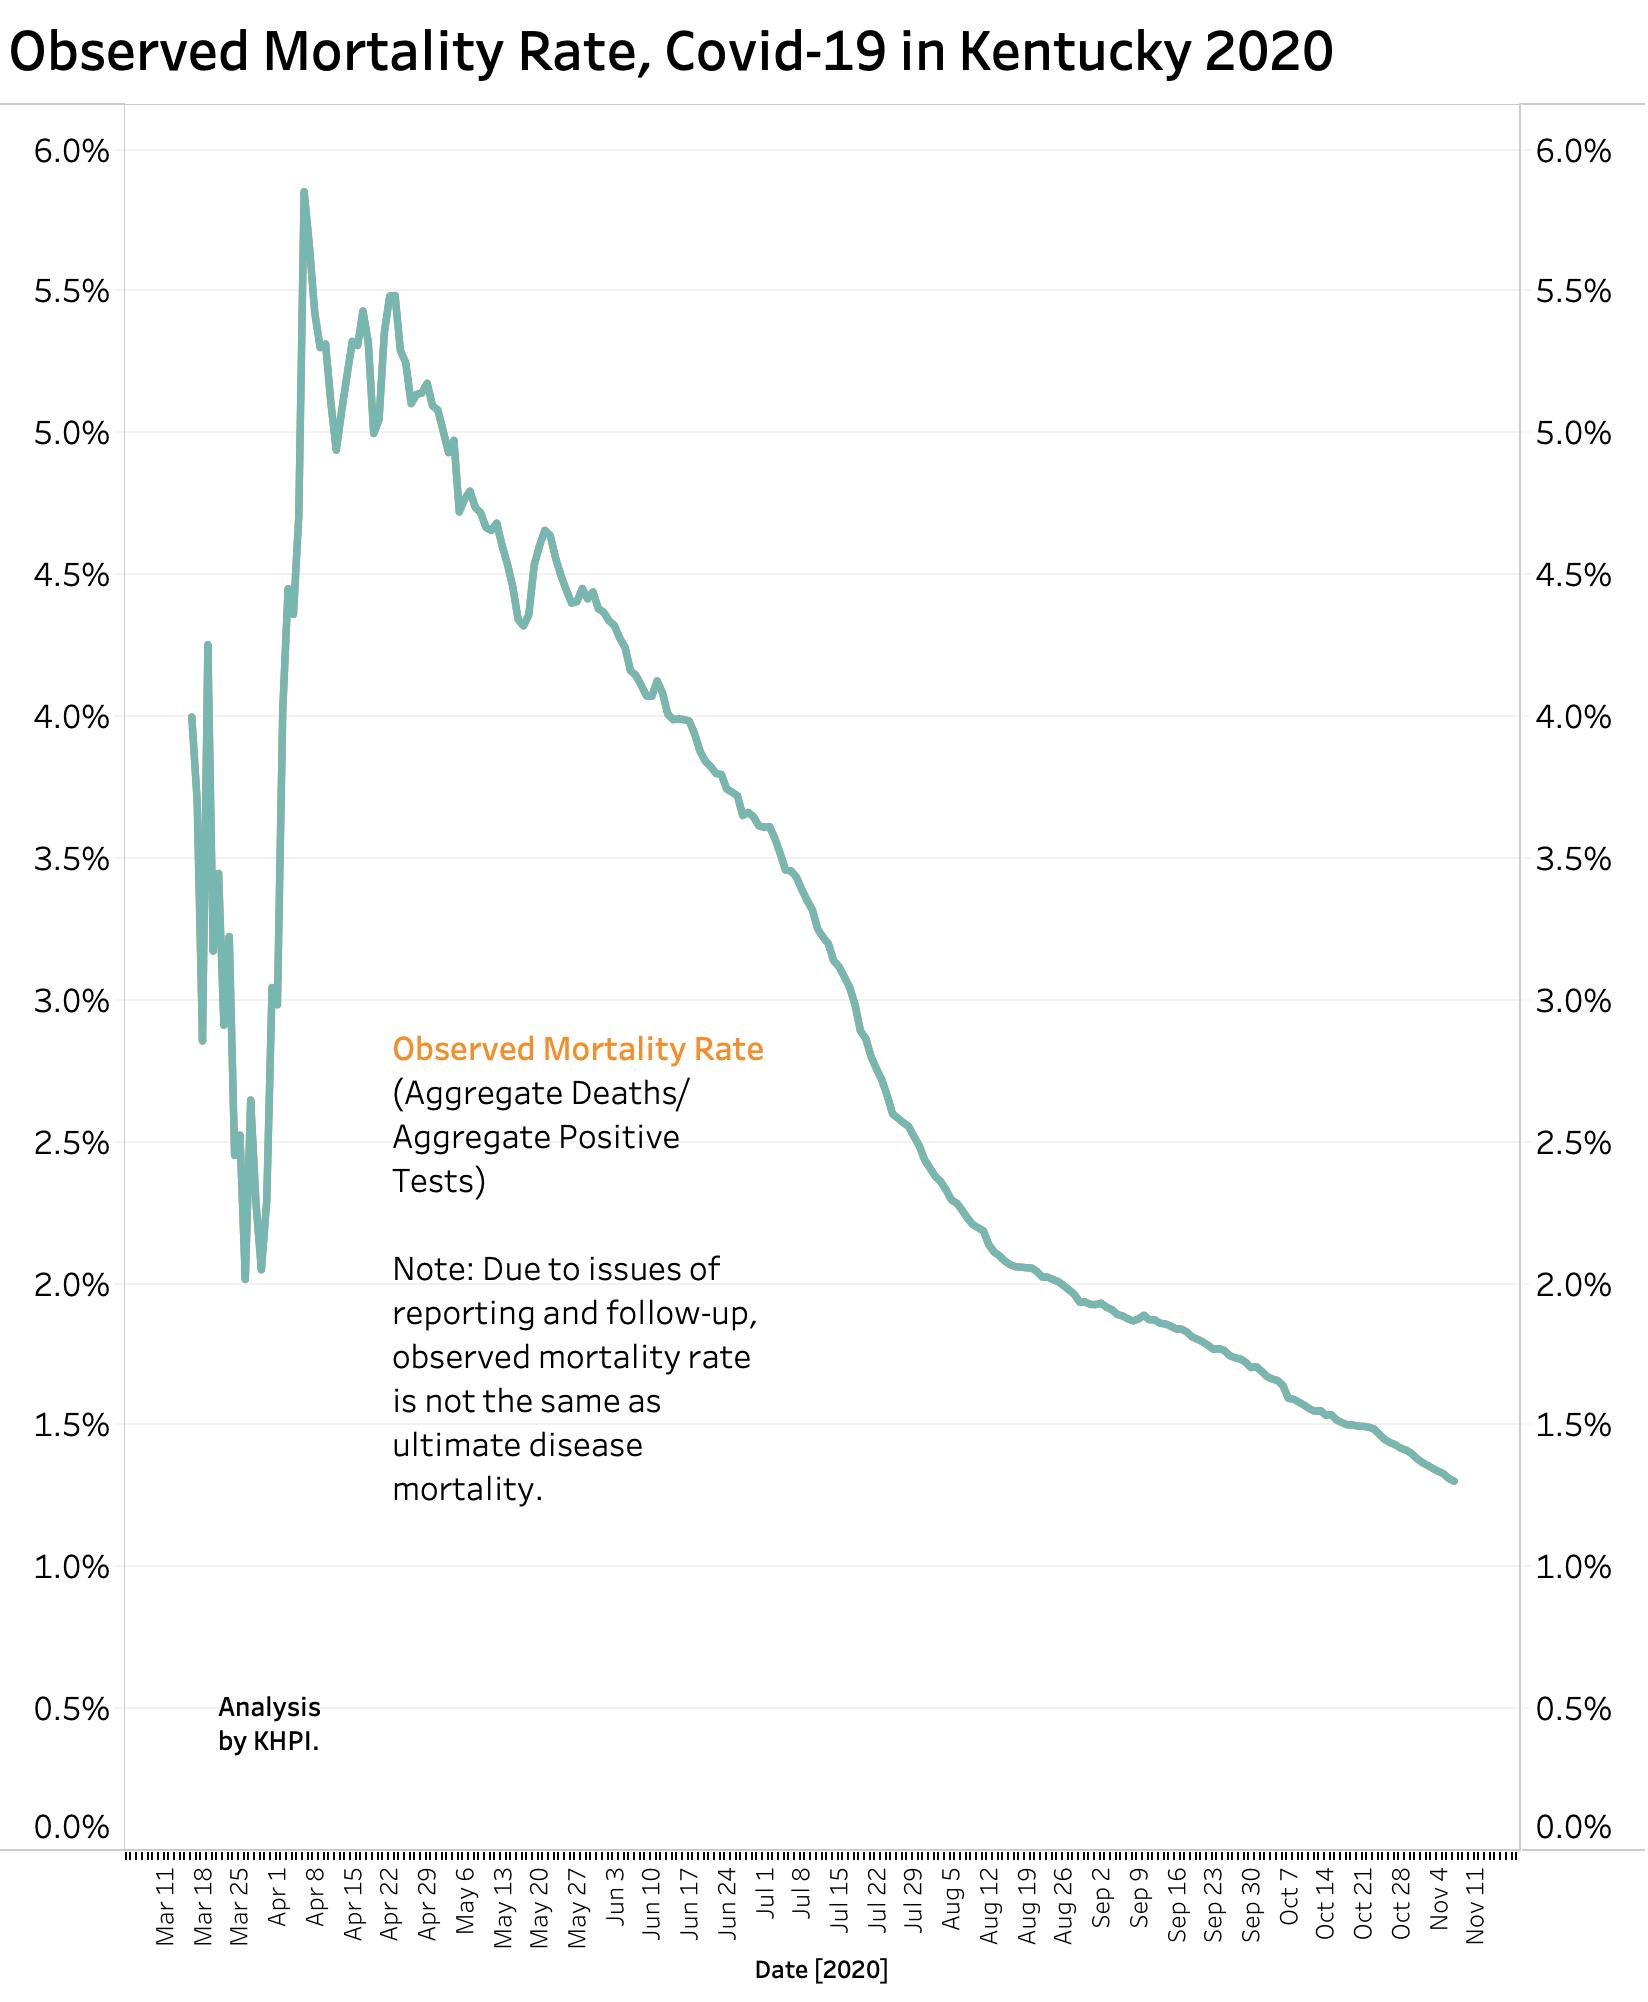
Last Saturday was the 246th day since the first Kentucky case was recognized. I have been tracking other items available to the public which are relevant to the next 246 days in which the epidemic will surely still be with us. One is the mortality rate calculated day to day since the first day of the epidemic. In the early 4 months in Kentucky when testing was limited and was prioritized for the obviously sick and vulnerable, as many as 5% or more of all those recognized with a positive viral test eventually died. No authority believes that we recognized then or now all infected individuals. Many infected people of all ages are asymptomatic even as they can still be active spreaders of infection to others. The collateral damage to uninfected folks who put off or do not have access to the medial management they would have had to treat other plagues of mankind such as heart disease or malignancy. I do not know how to estimate the effect of these factors on the full impact of Covid-19 on our communities. In time we will learn more.
One demonstrably optimistic factor is that with experience, the acute mortality rate of infection has been decreasing. Public data suggest that in aggregate, only about 1.3% of every diagnosed case of Covid-19 in Kentucky since March has died. That number continues to trend downwards. Of course, with a representative weekly number of reported tests around 130,000 being offered to symptomatic and asymptomatic people alike, one expects that fewer individuals will feel the full impact of the disease. Medical personnel who treat Covid-19 patients have both medicinal and non-medicinal effective treatments for the sick. While some of these treatments may individually been shown to have only “modest” beneficial effects on outcomes, in the aggregate, patients seem less likely to enter ICUs, to need respirators, and hopefully be more likely to leave the hospital to begin their new normal lives.
Ages of recognized cases and deaths.
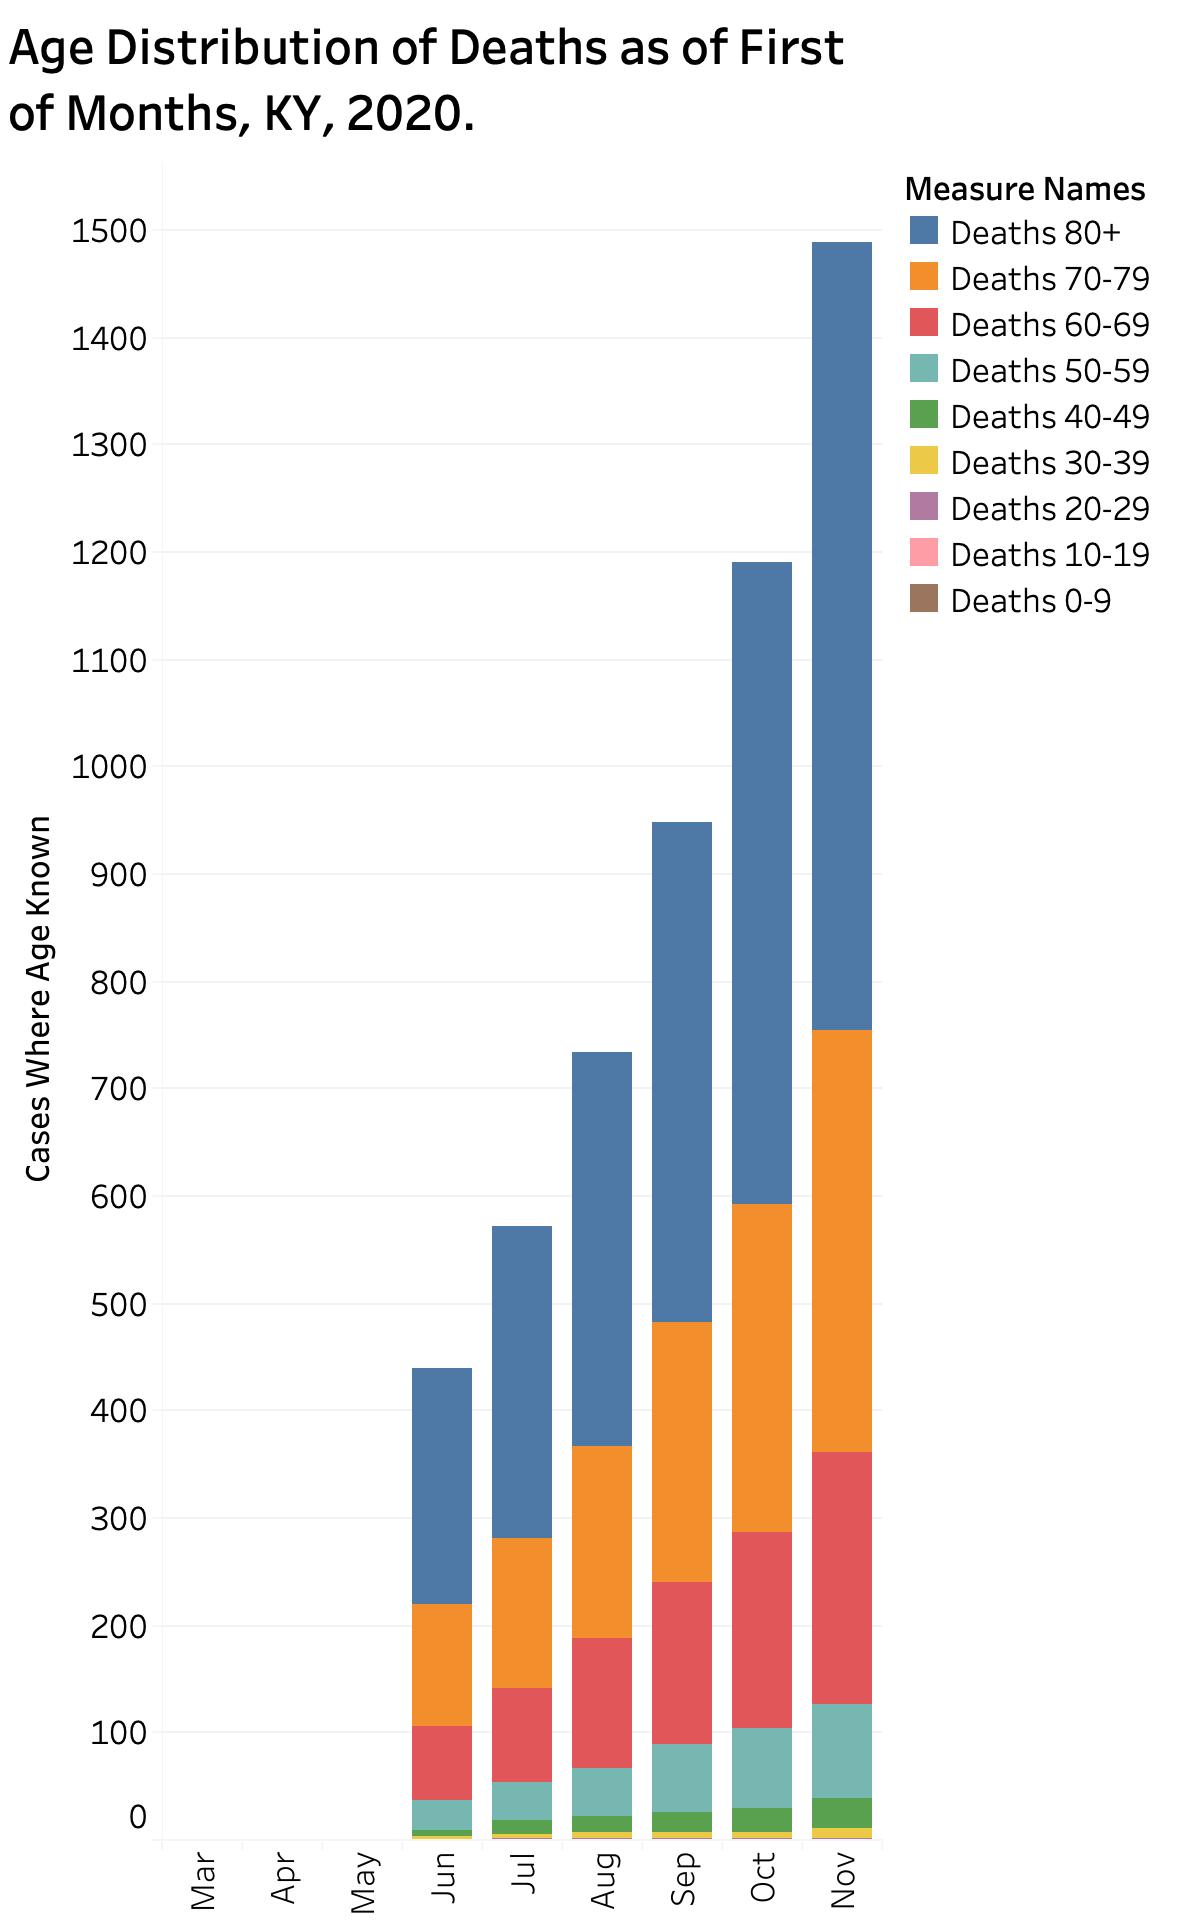
Since June, Kentucky published a daily tally of the cumulative ages of those with documented Covid-19 infections and those who have died. Since these must be extracted manually from printed forms, I extracted only the data for the first of each month since June 1 through November 1 to look for trends. I admit I have not been as successful as I wish to coax my data-management software into as clear as visualization as I would like, but until then, I think at least two significant points are obvious.
Deaths.
It should be no surprise to anyone that most of the reported deaths attributed to Covid-19 are among very elderly. The largest proportion comprises individuals of 80 years or older. Nonetheless, the segments of 70-79 and 60-69 make up a sizable proportion of the whole. Combined, these latter two age brackets contain nearly as many individuals as in the 80+ bracket. A meaningful number of deaths occur in the bracket of 50-59. There are comparatively very few deaths in individuals under the age of 29.
Cases.
The age distribution of cases on the first of the months is almost the reverse of the age distribution of deaths. Even so, as the epidemic and the testing structures have evolved, the distribution of cases has been more uniform than I anticipated among the brackets than was the case for deaths. Only the very youngest and the very oldest two brackets contain demonstrably fewer cases than the other seven.
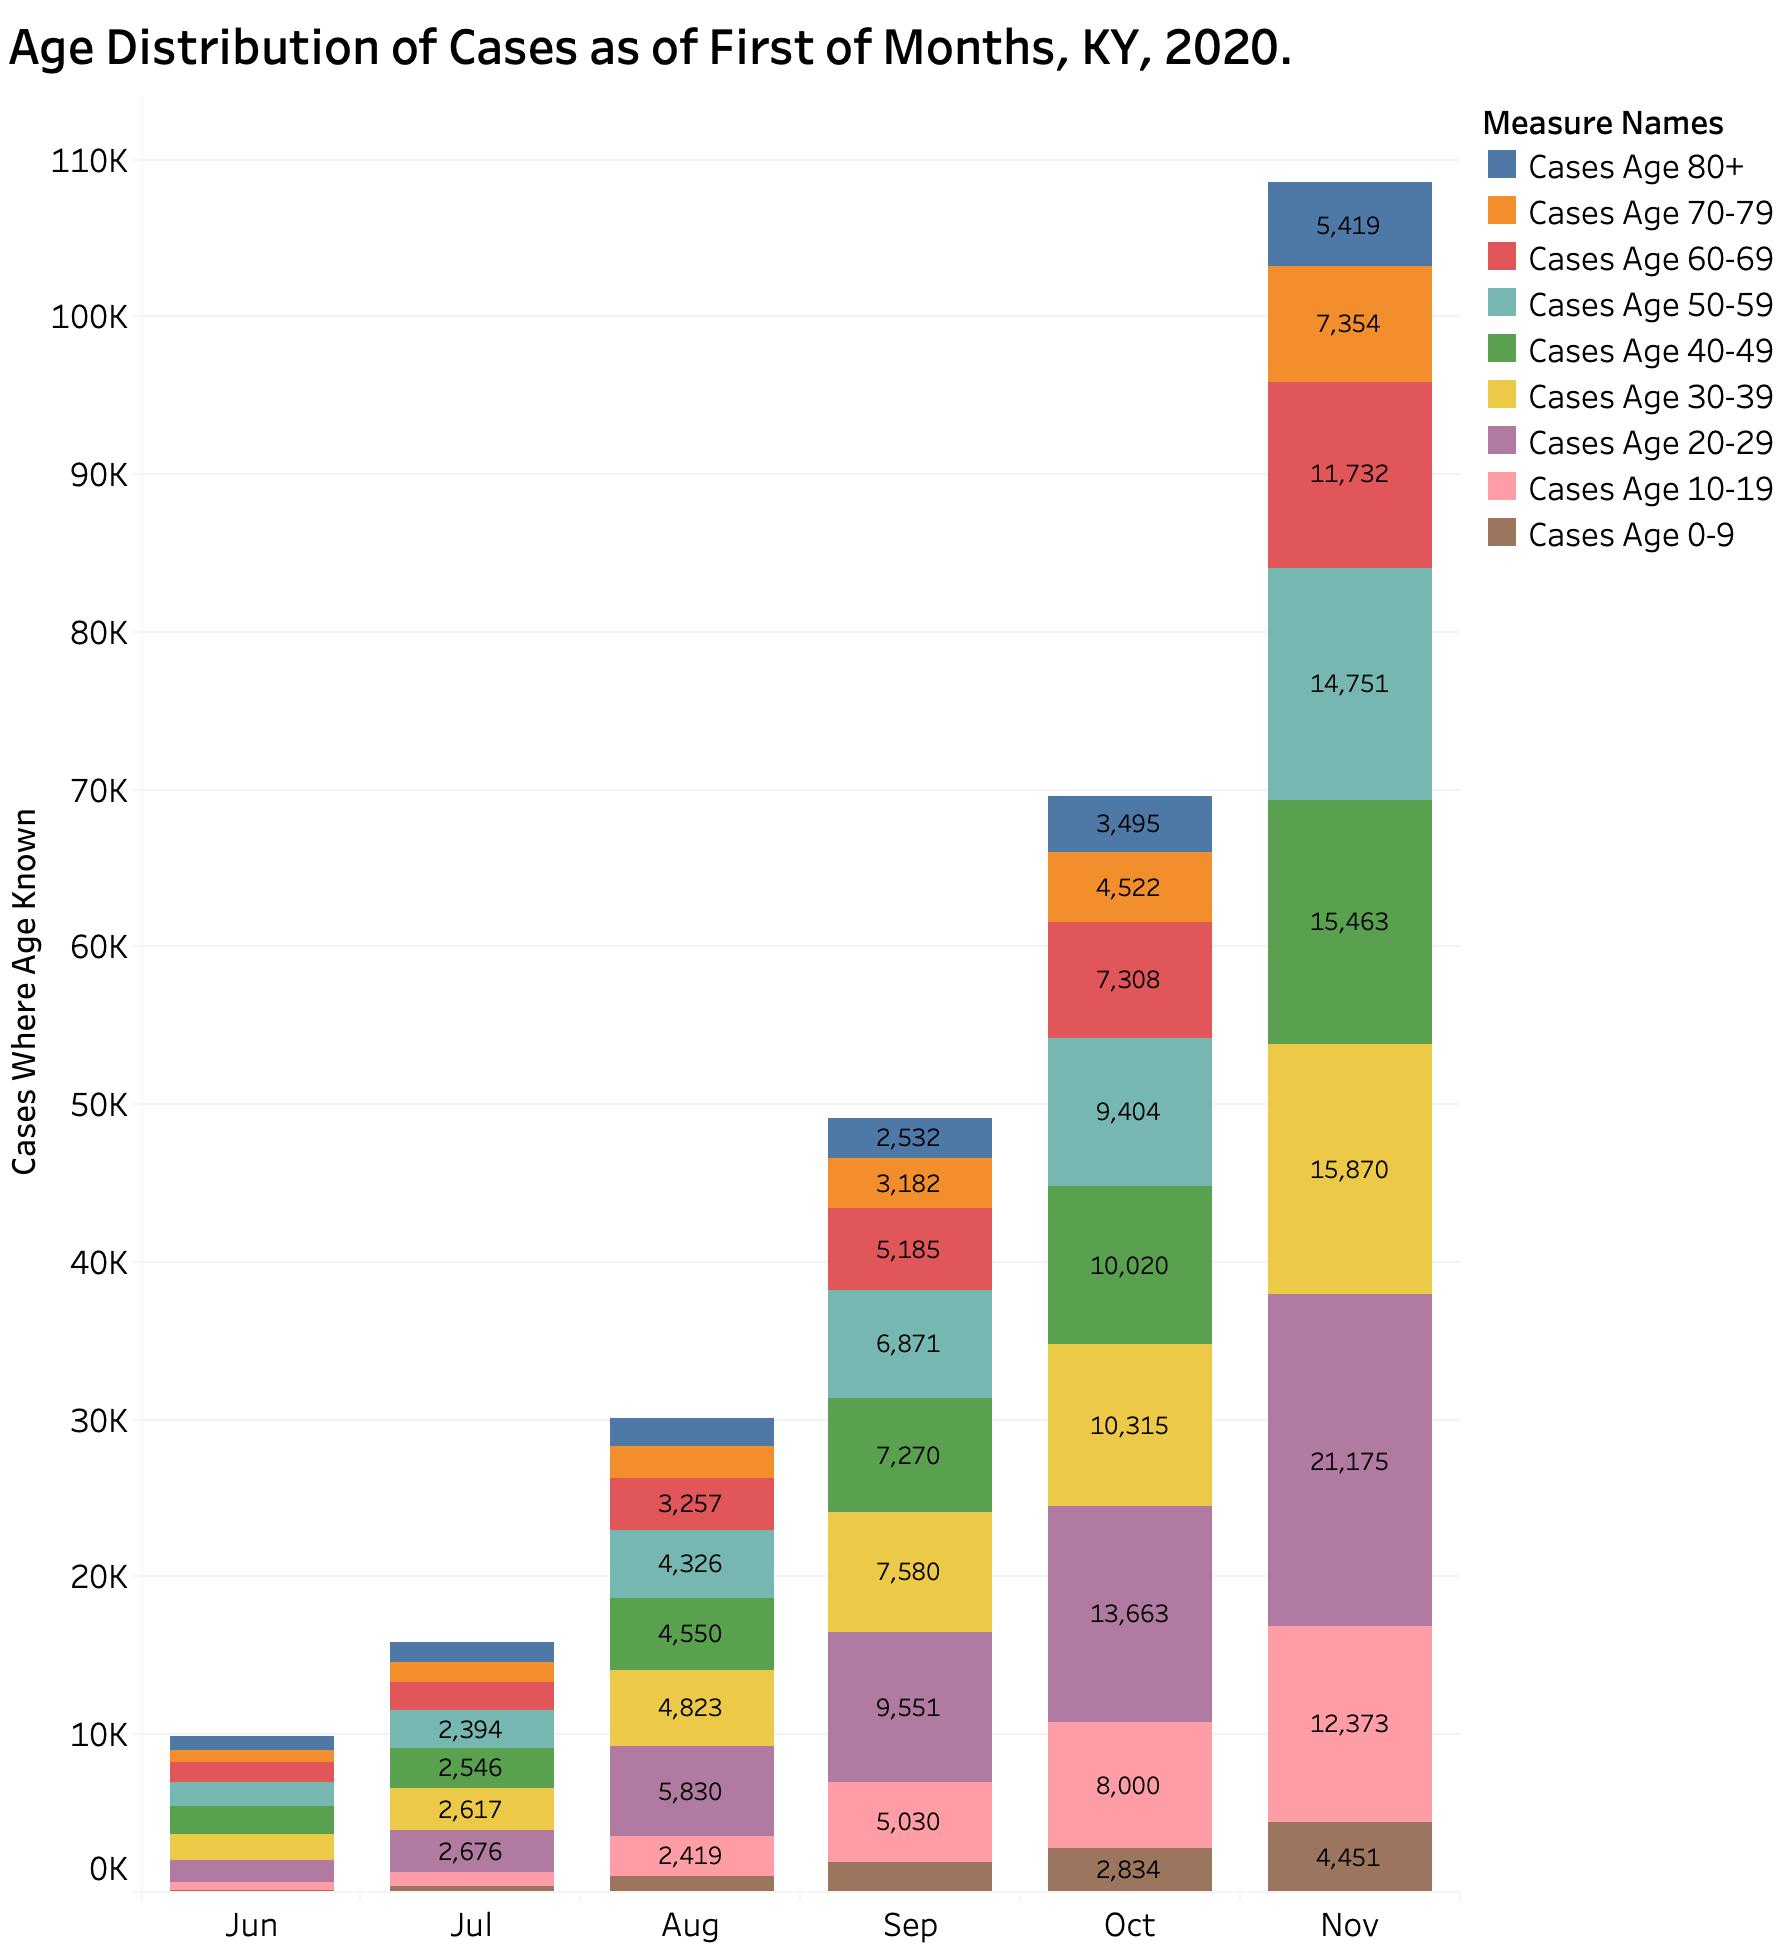
What I wanted to examine most was look at change over time in the age distributions of cases. I have yet to add the numeric data of November 1 (and will later), but as of October 1 the bracket containing the largest percent of aggregate cases was 19.6% for Cases 20-29. The next largest segment was the bracket of Cases 30-39. When I calculated the rate of change in the proportions of aggregated cases over the 4-month interval between June 1 and October 1, the segment of Cases 10-19 increased the most at 7.9%. The next largest percent of aggregate change was Cases 20-29 at 4.5%. That is to say, more younger people (including children) are getting infected than older people or the very elderly.
Aggregate vs. New Cases.
Looking only at aggregate (total) cases can mask the impact more recent changes. I compared the number of new casesreported only during the calendar month of June 2020 to those for the calendar month of September. The number of cases in the bracket Cases 10-19 increased from 453 to 2970, a more than five-fold increase when these two months were compared and double the increase in Cases 20-29. As I understand these numbers, the trend is that the number of new cases under the age of 29 is expanding faster than all those over 30. I find this troubling and certainly not reassuring to those who believe that only the elderly need worry. These younger folks can certainly spread their virus around to both their peers in school and their elders at home. The impact on these young-folk personally remains to be known.
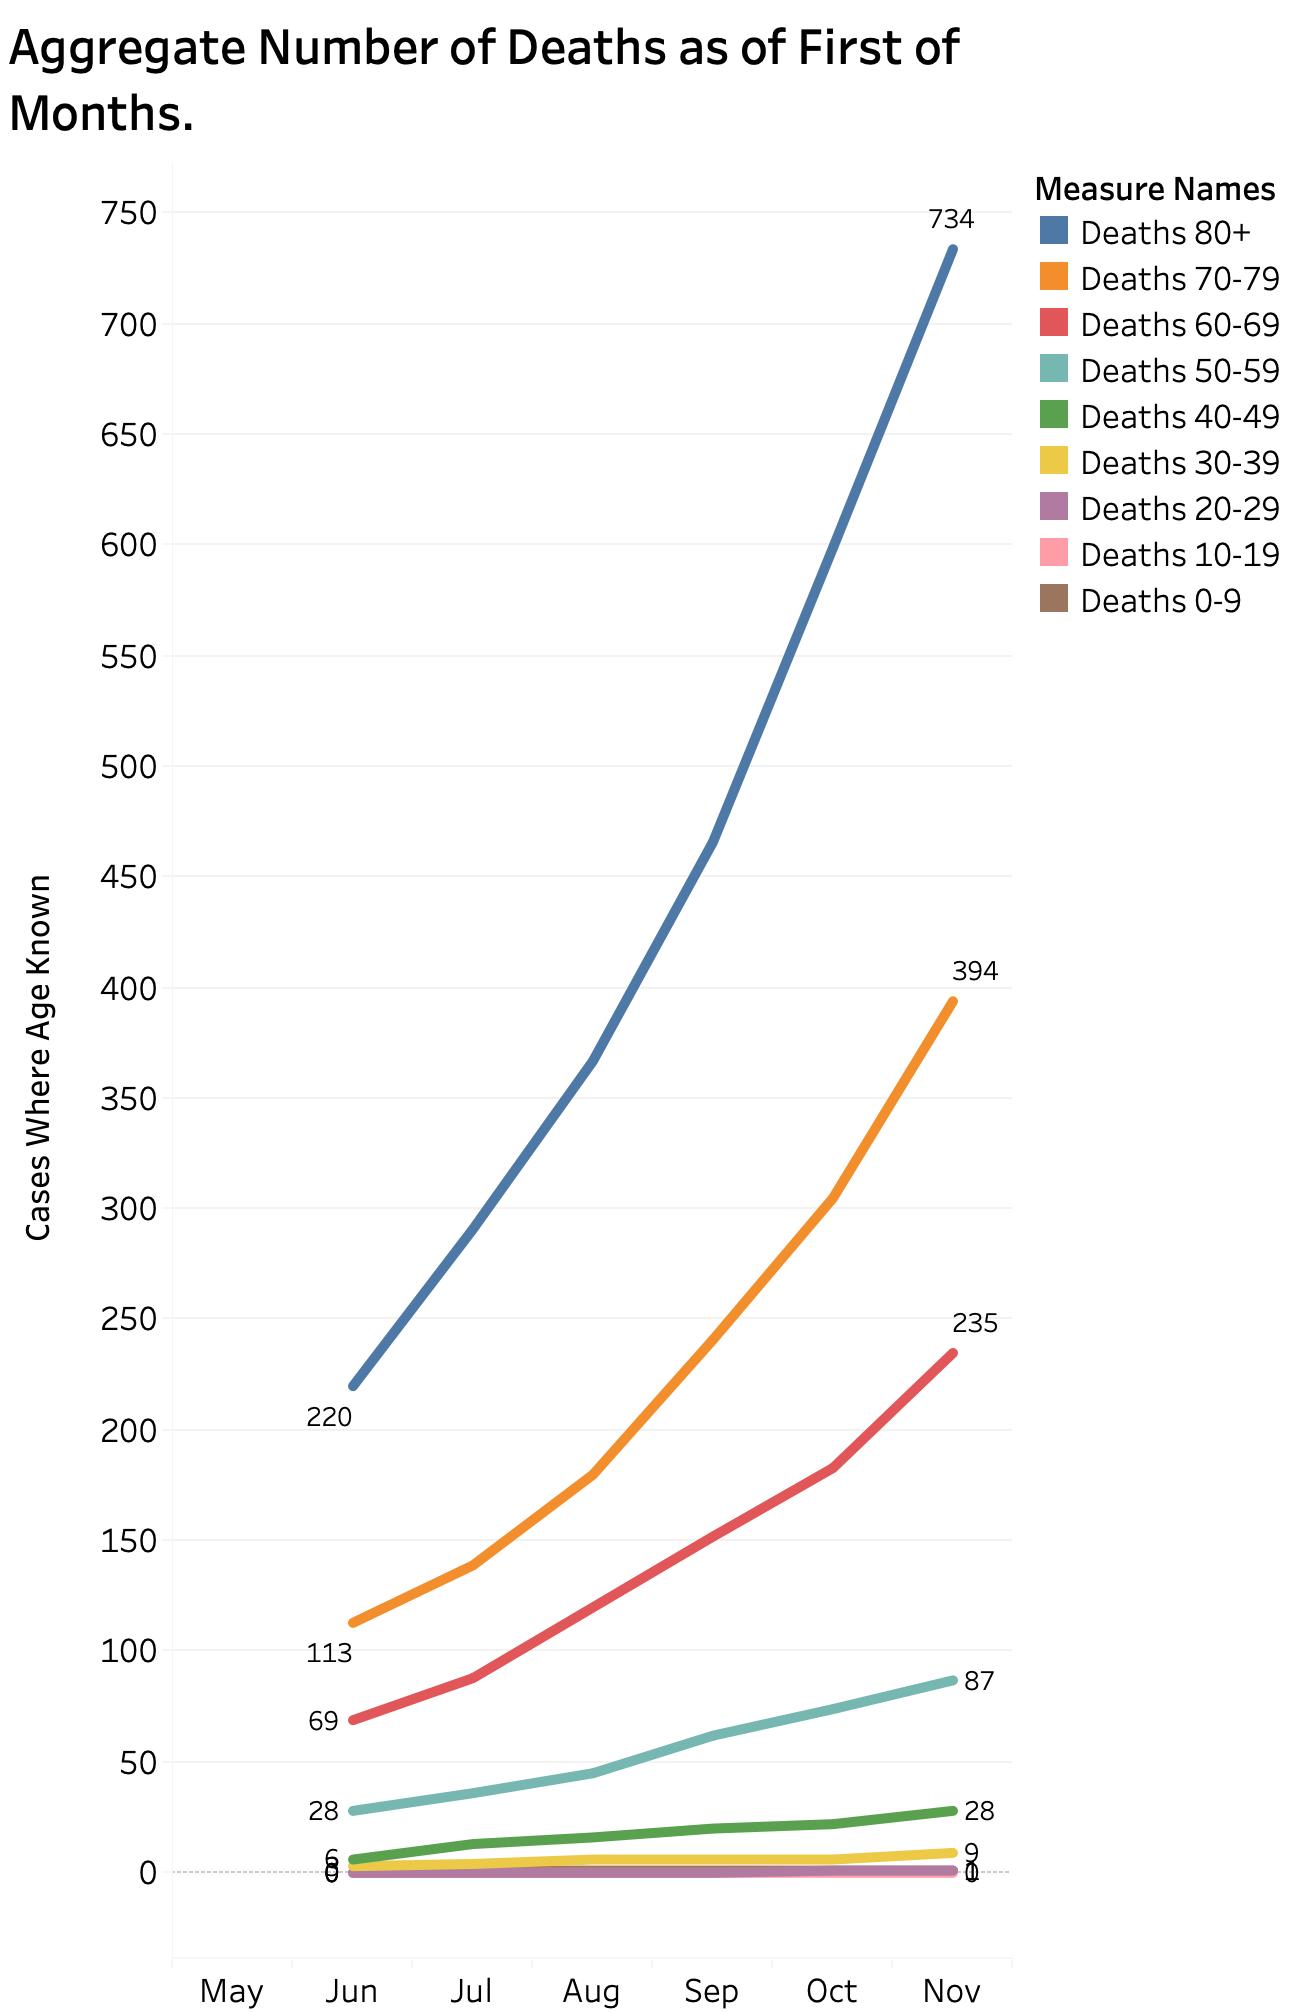
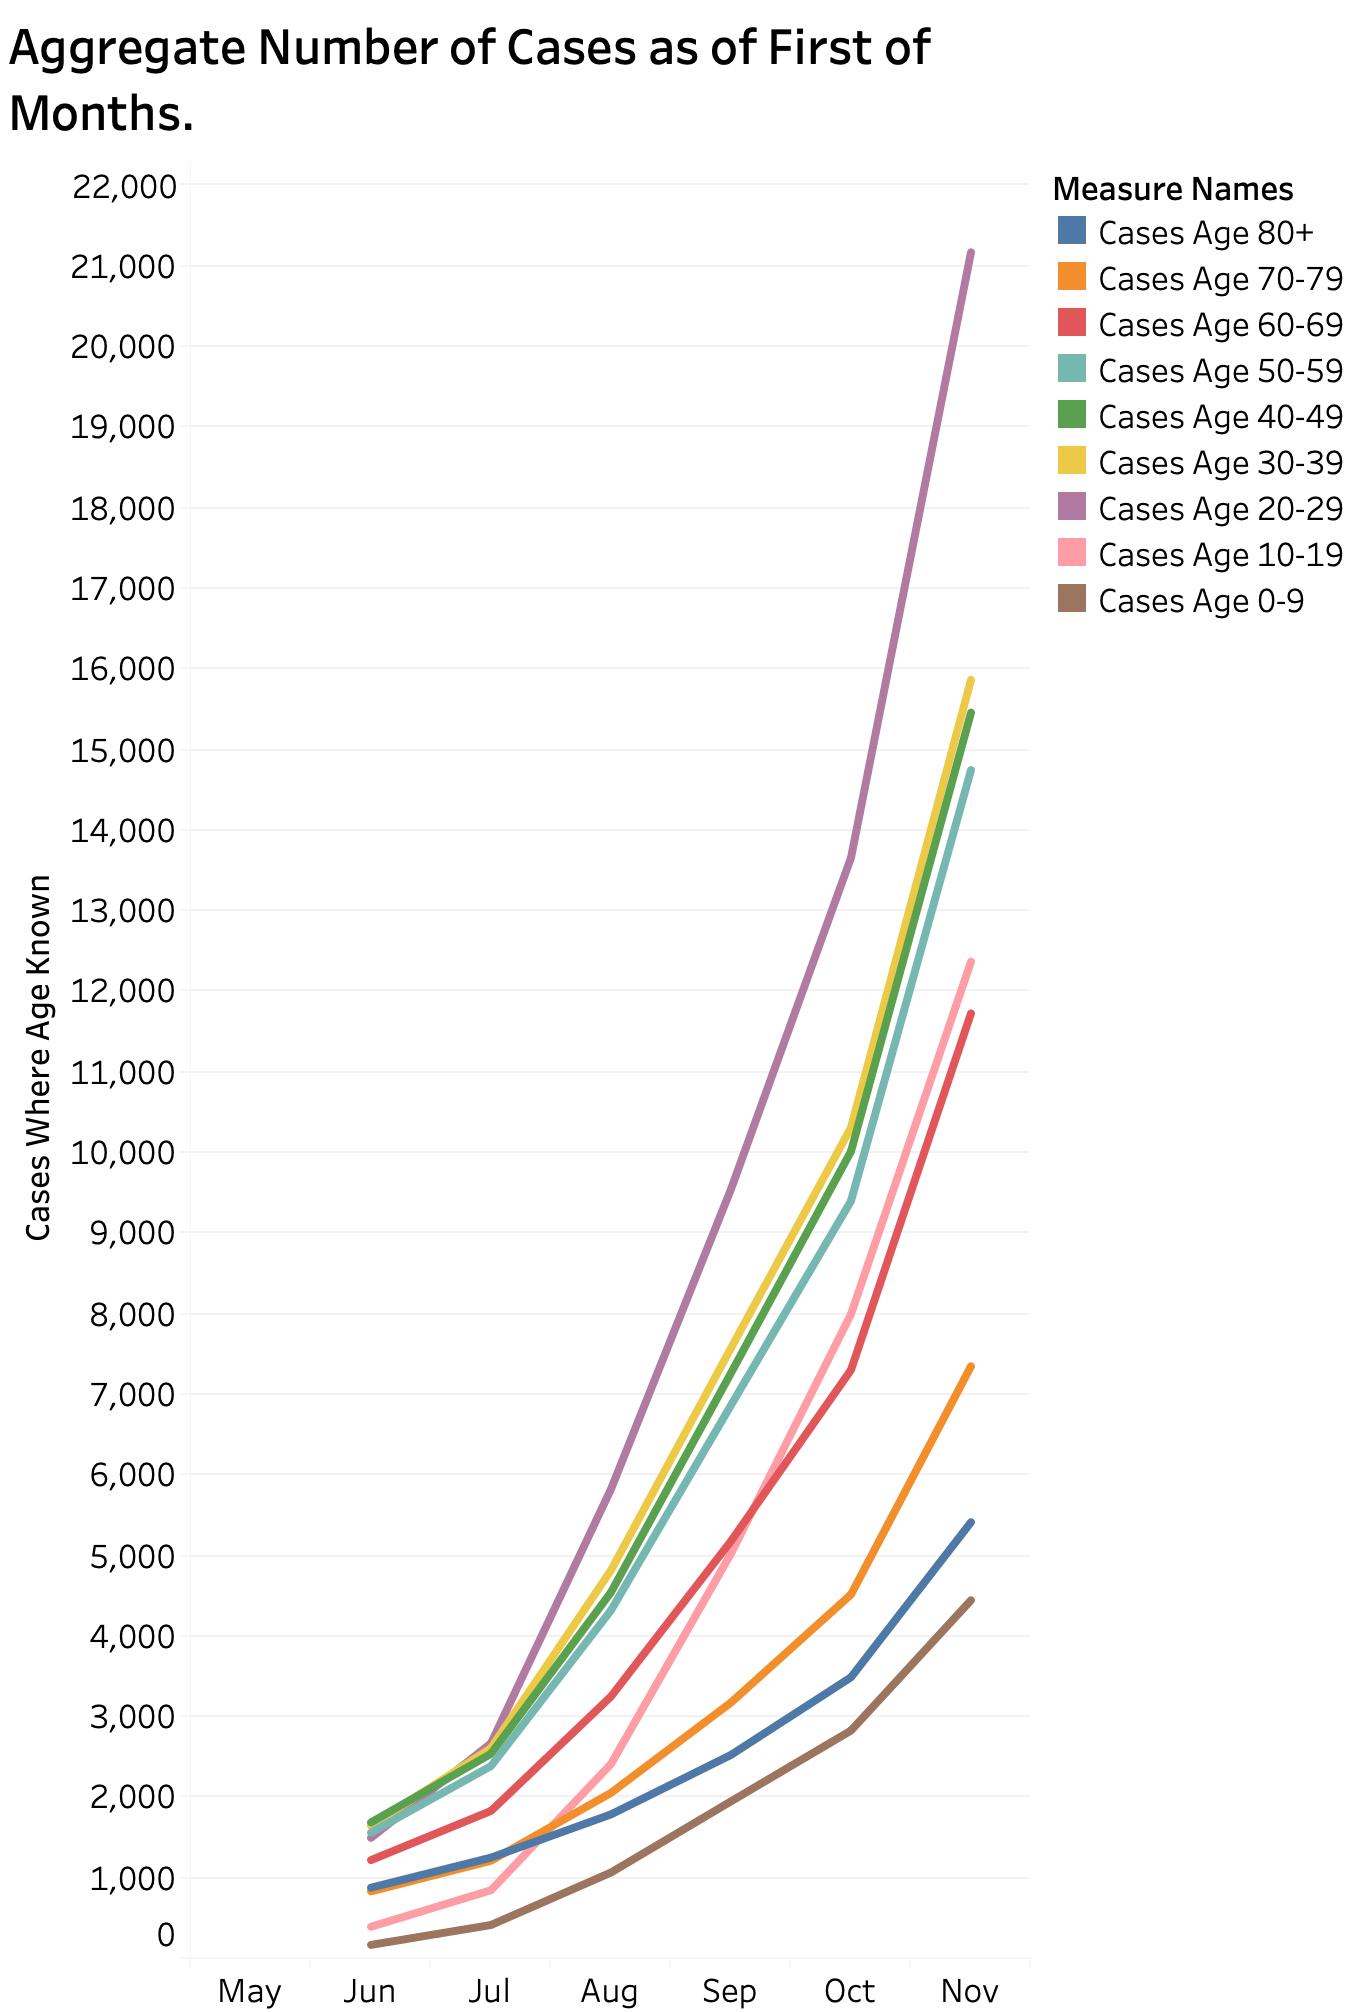
The most rapidly increasing line in the plot below is the purple Cases Age 20-29. The pink Cases Age 10-19 has also taken a sharper trend upwards. Other lines mostly kept their respective places
That is enough for now.
An updated animated map showing the weekly spread of Covid-19 throughout Kentyucly’s 120 counties can be seen or downloaded here.
You can refer to the KHPI Tableau Public website for the full portfolio of updated data visualizations. Many of these are interactive revealing the underlying values for each data point. Interactive data filters allow different date ranges or individual counties to be selected. I also updated the New York Times county data that allow the case, death, and cases per 1000 population to be visualized for each Kentucky County. Since I last updated the data, the aggregate difference in plots of new cases amoung counties with small, intermediate, and large numbers of cases is disappearing as the virus has spread widely throughout all the Commonwealth. Individual counties can still demonstrate the marked impact of super-spreader events in the over the months. View the maps and tables here and please select and inspect counties with which you are familiar and help us understand the kinds of events or circumstances that markedly alter the epidemiologic curves of local communities. Epidemics in prisons are a dramatic example, but there are other more mundane kinds of human interactions that we need to understand if we are to keep kids in schools, our stores open, and our hospitals safe.
God bless us all, every one,
and to all…
keep us safe as we enter the holiday seasons.
Peter Hasselbacher, MD
Emeritus Professor of Medicine, UofL
9 November 2020