
While other states are still talking of being “on fire” with Covid-19 and of having their hospitals swamped, Kentucky may be seeing some relief, at least in the rise in the number new cases daily. The same cannot yet be said about the number of deaths or a heavy burden on the healthcare system and the professionals staffing it. Although some good news and hard earned, we remain at a tipping point.
New Cases.
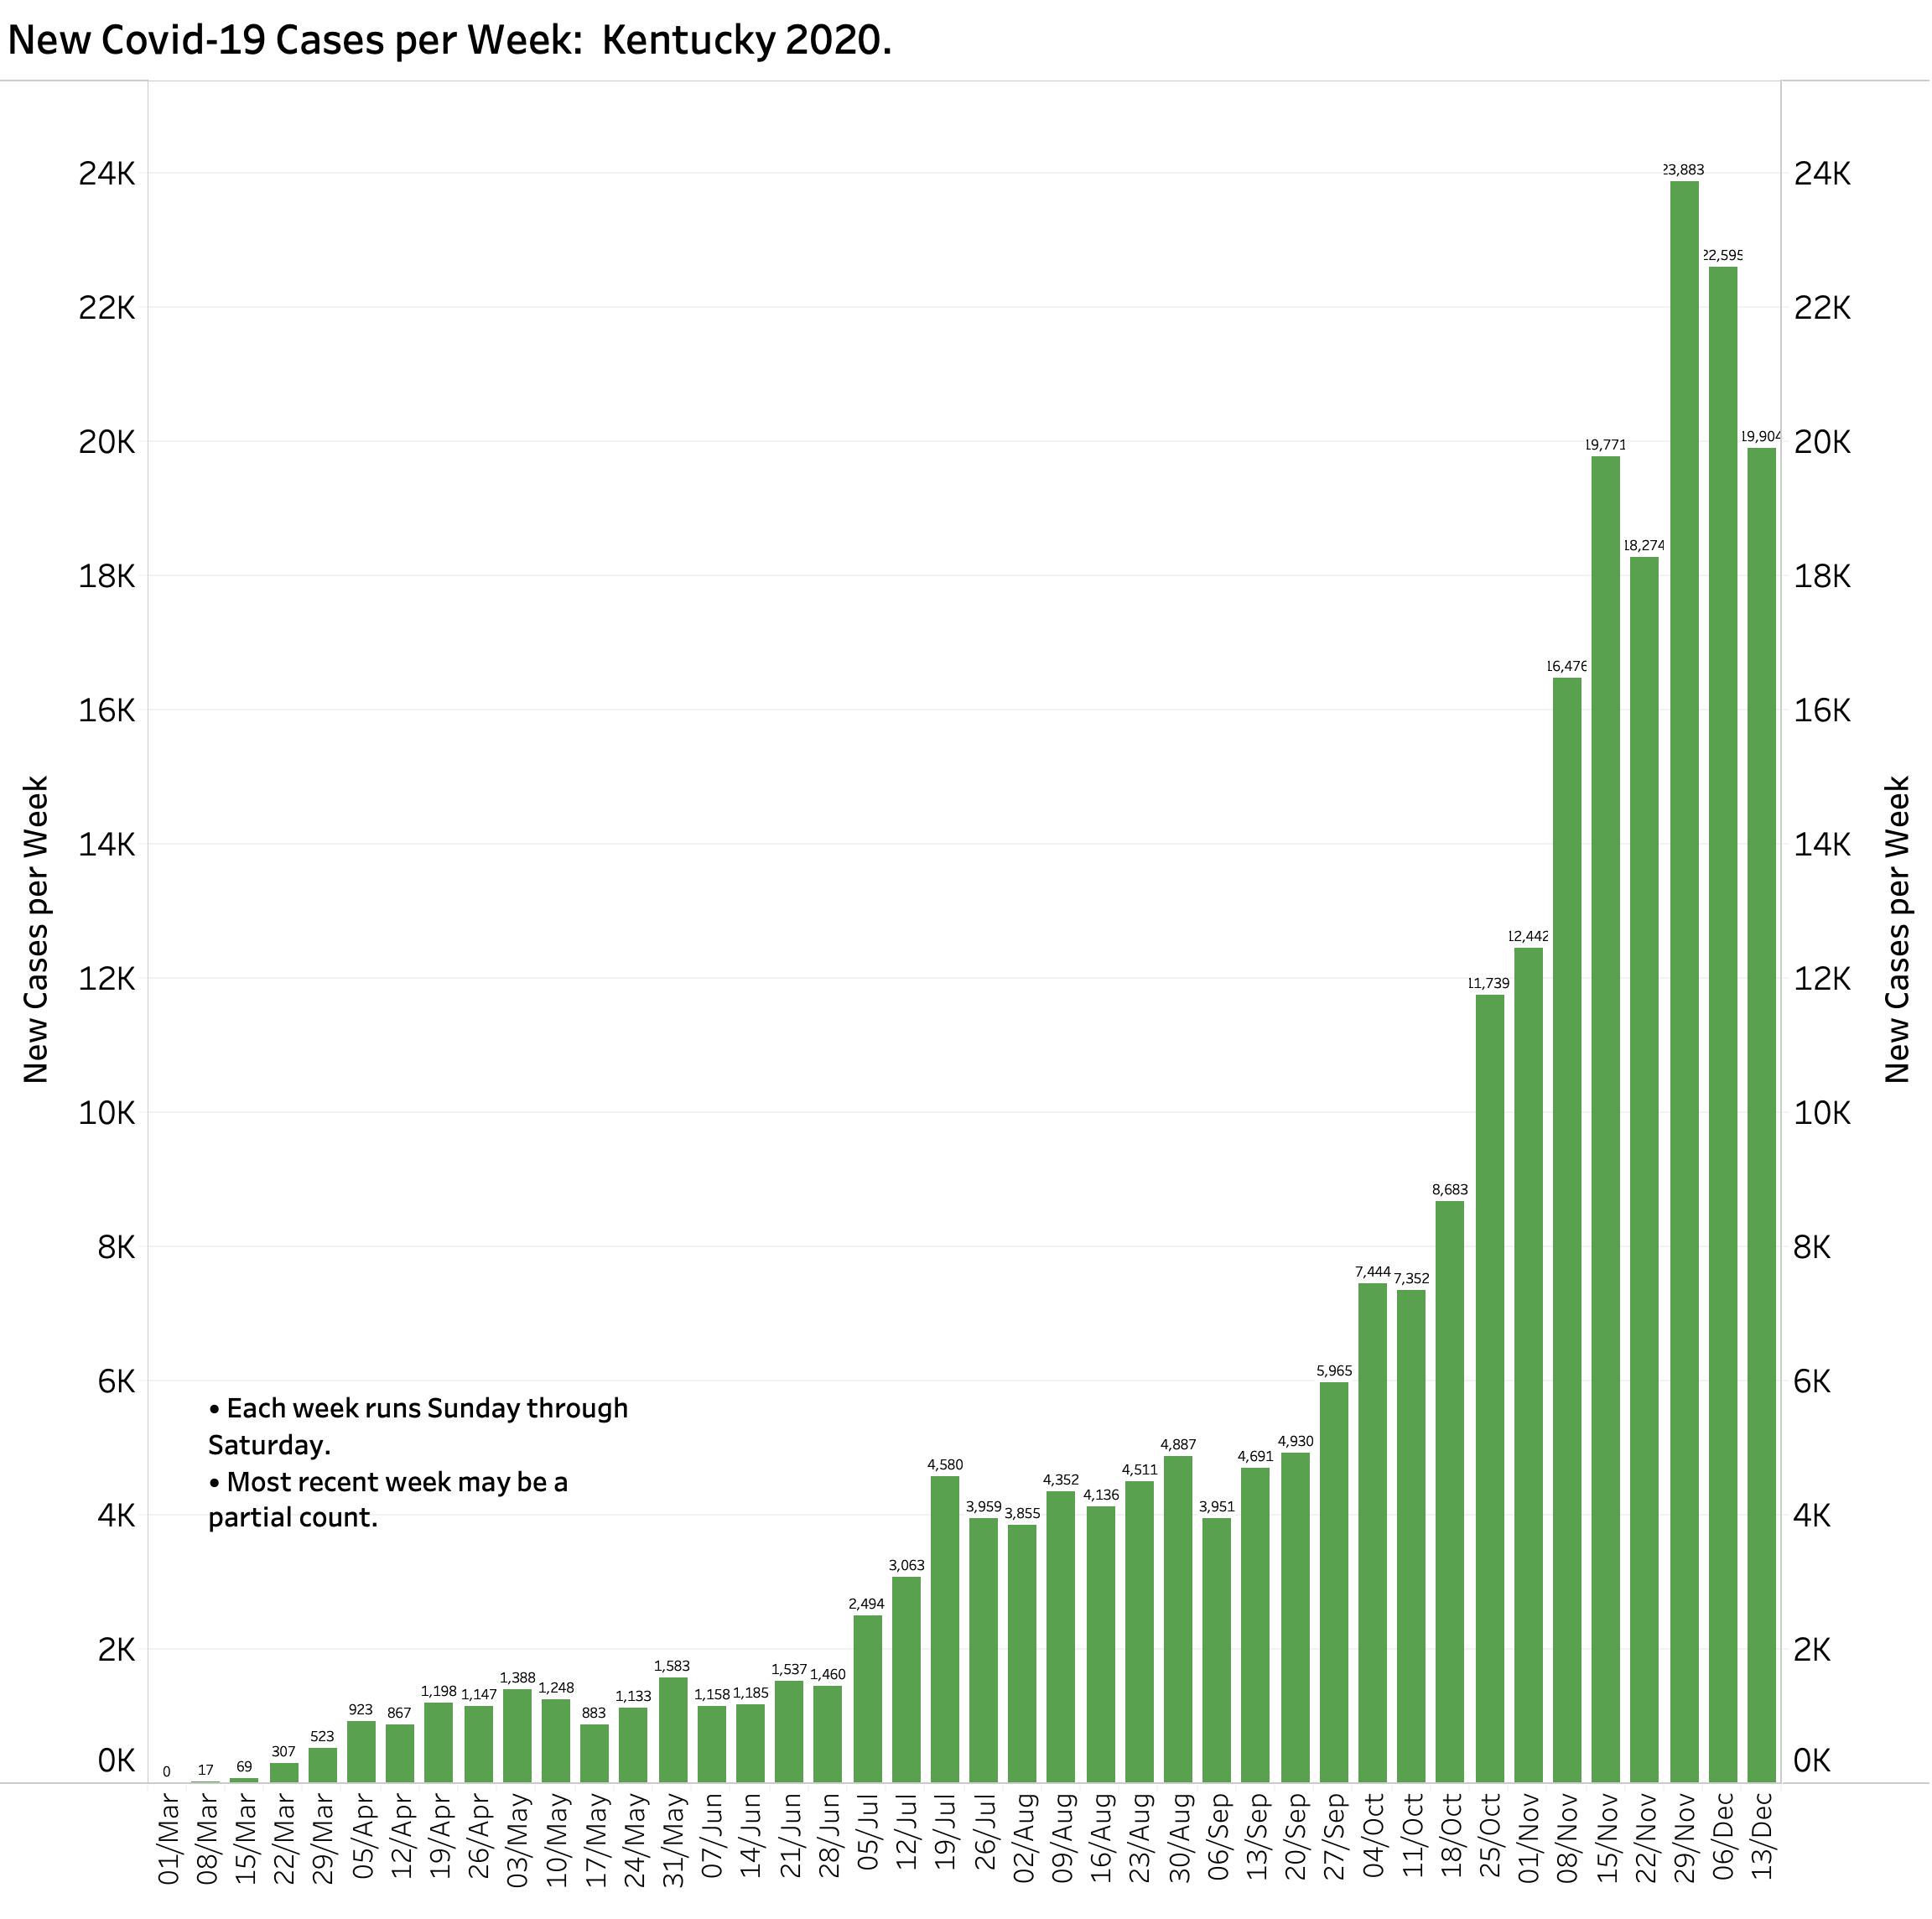
The wide variation in daily case counts attributable to existing workday schedules for data collection and reporting makes day-to-day comparisons unreliable if not misleading. The use of rolling averages certainly smooths out the daily variation but at the cost of always being up to 14 days out of date. However, the workflow through the weeks appears uniform enough that comparisons for any given weekday can be meaningful. KHPI’s online epidemic profile has added a user-selectable filter to its visualizations of new case counts that pulls only the counts for any given weekday (i.e. Saturday). In these comparisons, for every individual weekday, case counts have been slowly dropping over the past 3 or 4 weeks. However, these new cases remain much higher than before the epidemic surge that began in earnest in later October. The overall case count of 19,904 for the week beginning Sunday, Dec. 13 is also dropping compared to the previous 3 or 4 weeks but remains much higher than the total of 11,739 for the week of Oct 18 and certainly more than all weeks prior to Sept 27. New cases for December (already at 61,523 as of Dec. 19) are on track to set a new monthly record.
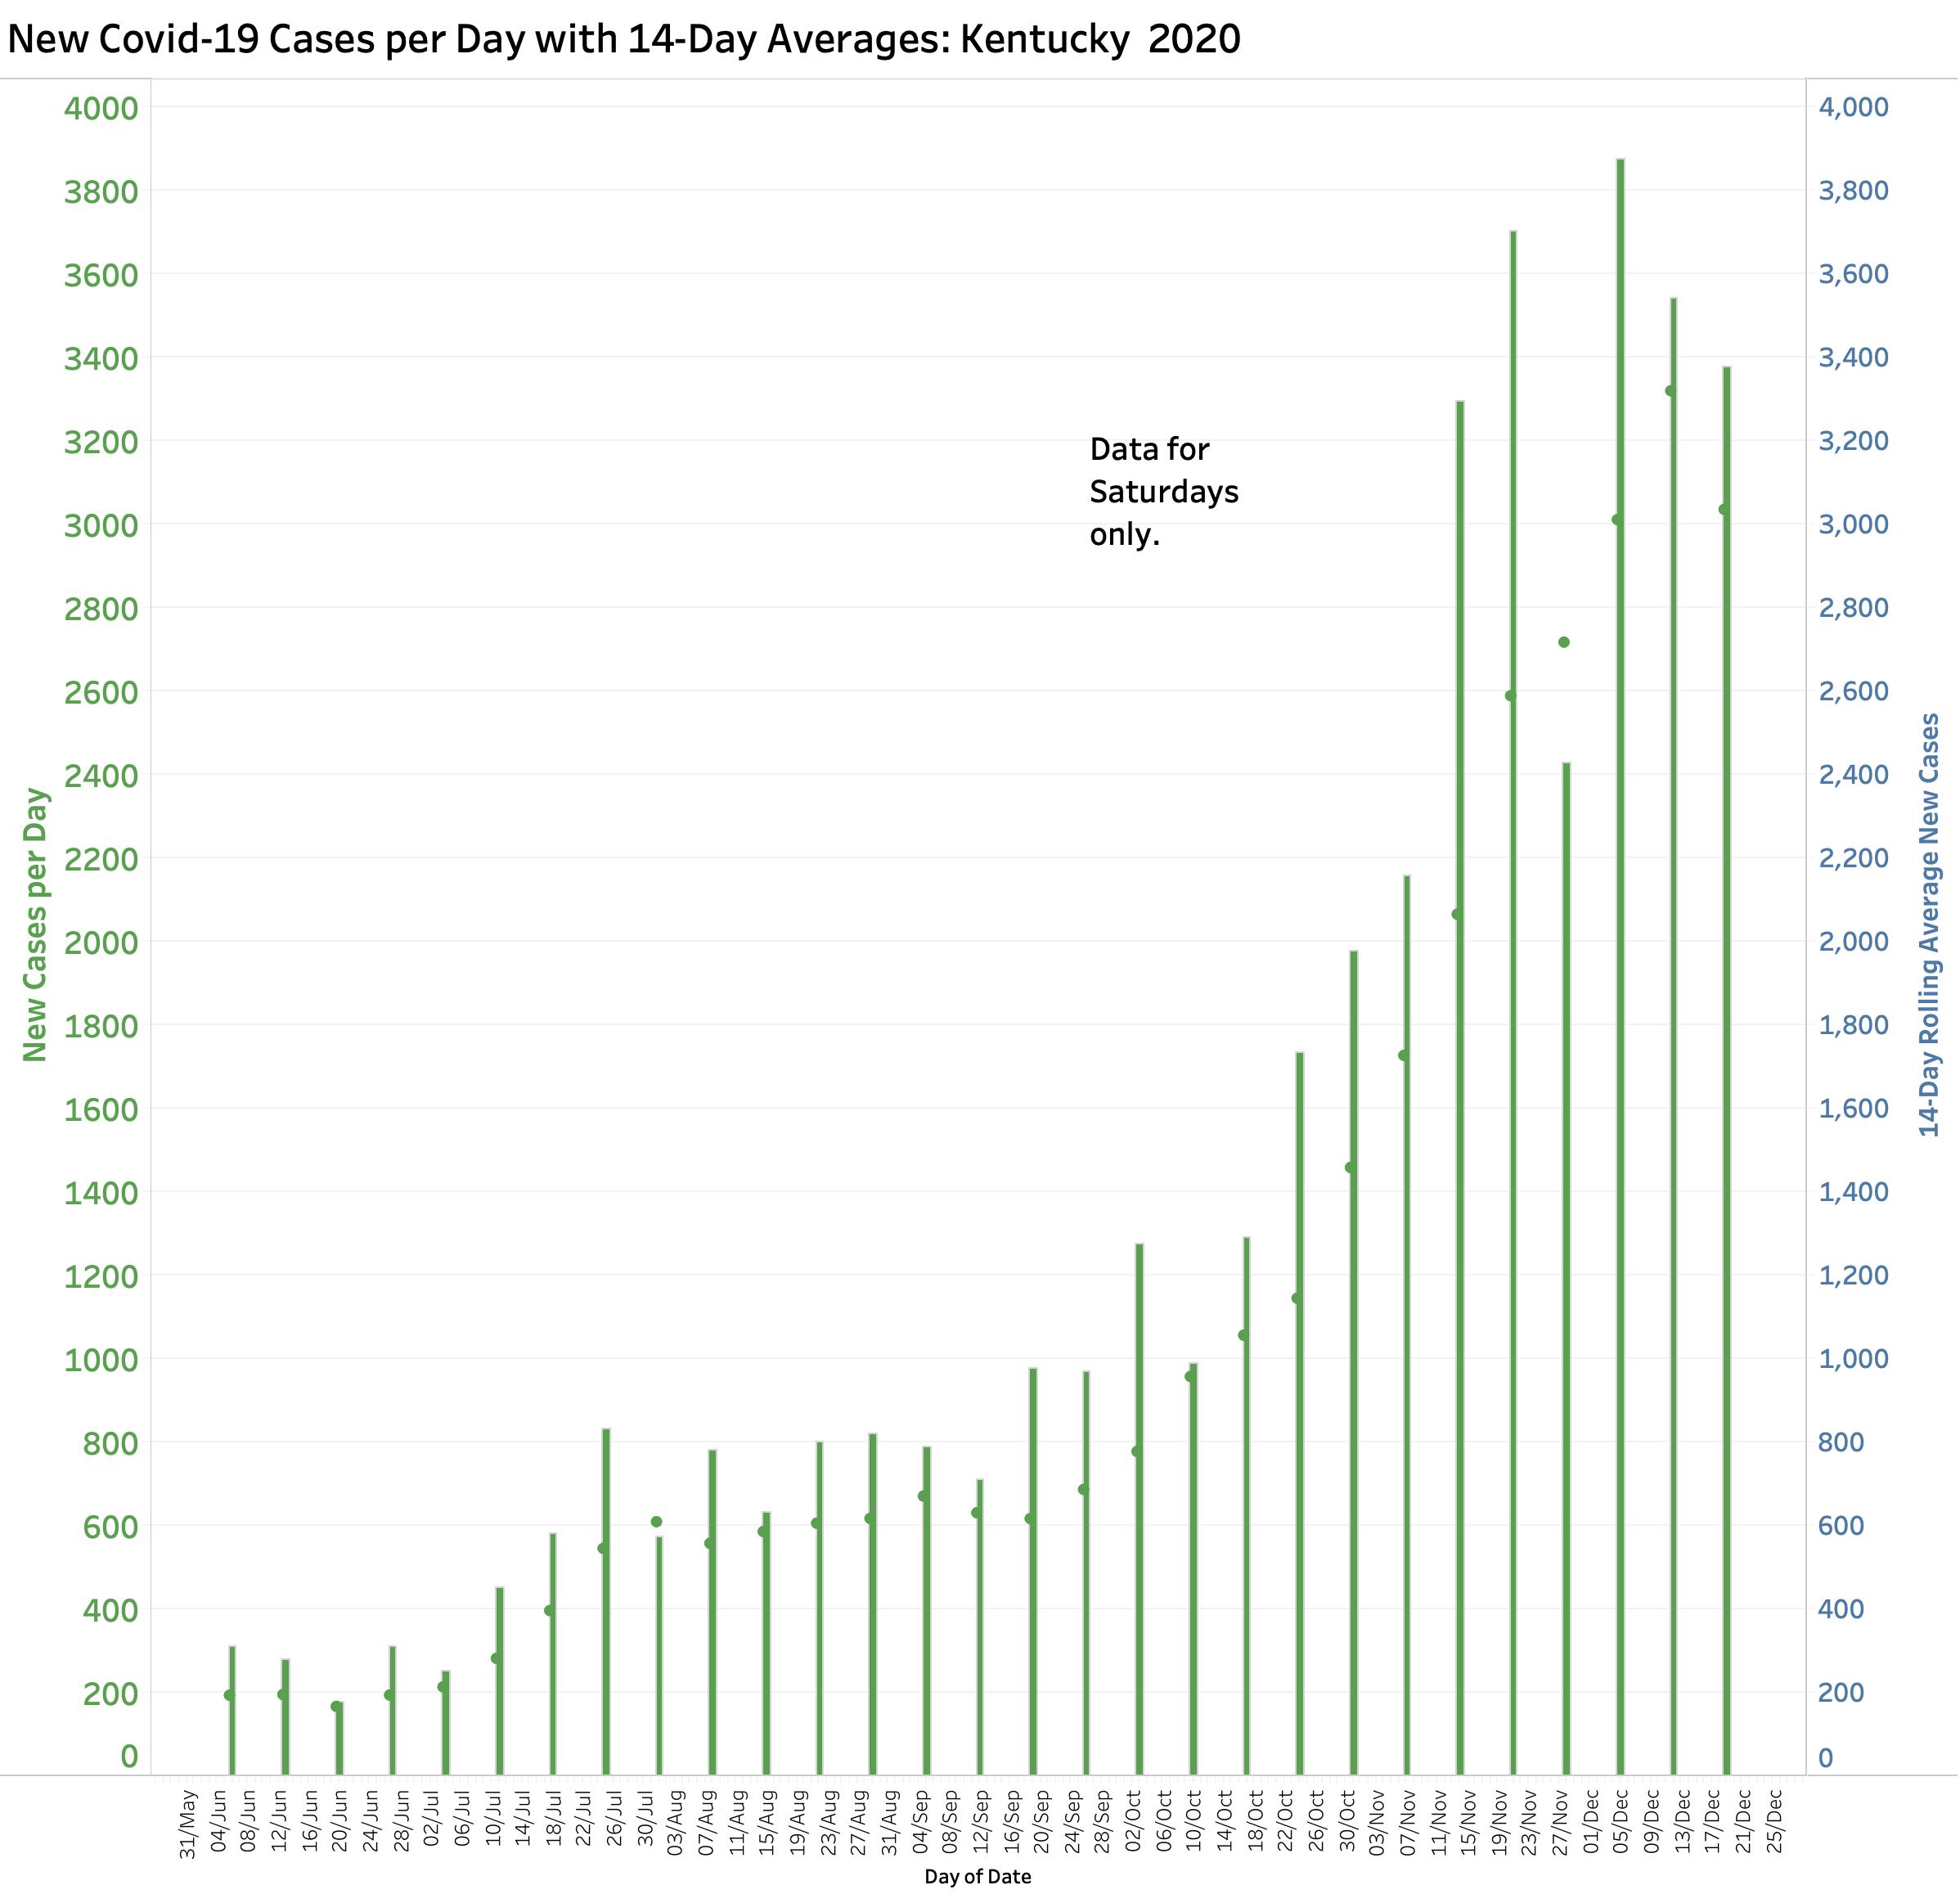
A declining number of new cases is also reflected in a 7-Day rolling average falling faster than the 14-Day average, and a leveling off below the trend-line on the semi-log plot of those data. These and all other data mentioned in this article data can be viewed on KHPI’s Tableau Public website. I have no doubt that this downward trend is in part due to the re-application of broader public health measures. It also likely reflects the expected natural history of Coronavirus exposure for the cohort of individuals who contracted their disease during the Thanksgiving holiday week.
Deaths:
The reality that the full impact of exposure to Coronavirus on the health of the public is delayed is reinforced by the numbers of infected individuals admitted to hospitals or who die. Although the average time between exposure for an individual to become symptomatic may be 4 to 5 days, it may take as many as 14 days. Following the onset of symptoms, it can take another 8 to 12 days (or more) to become sick enough to justify admission to a hospital or an ICU bed where a patient may remain for a long time. Recovering may take a lot longer than that. Last week set a new record with 179 reported Covid-19 deaths. As of December 19, with 12 days to go, 463 December deaths so far have already set a new monthly record.
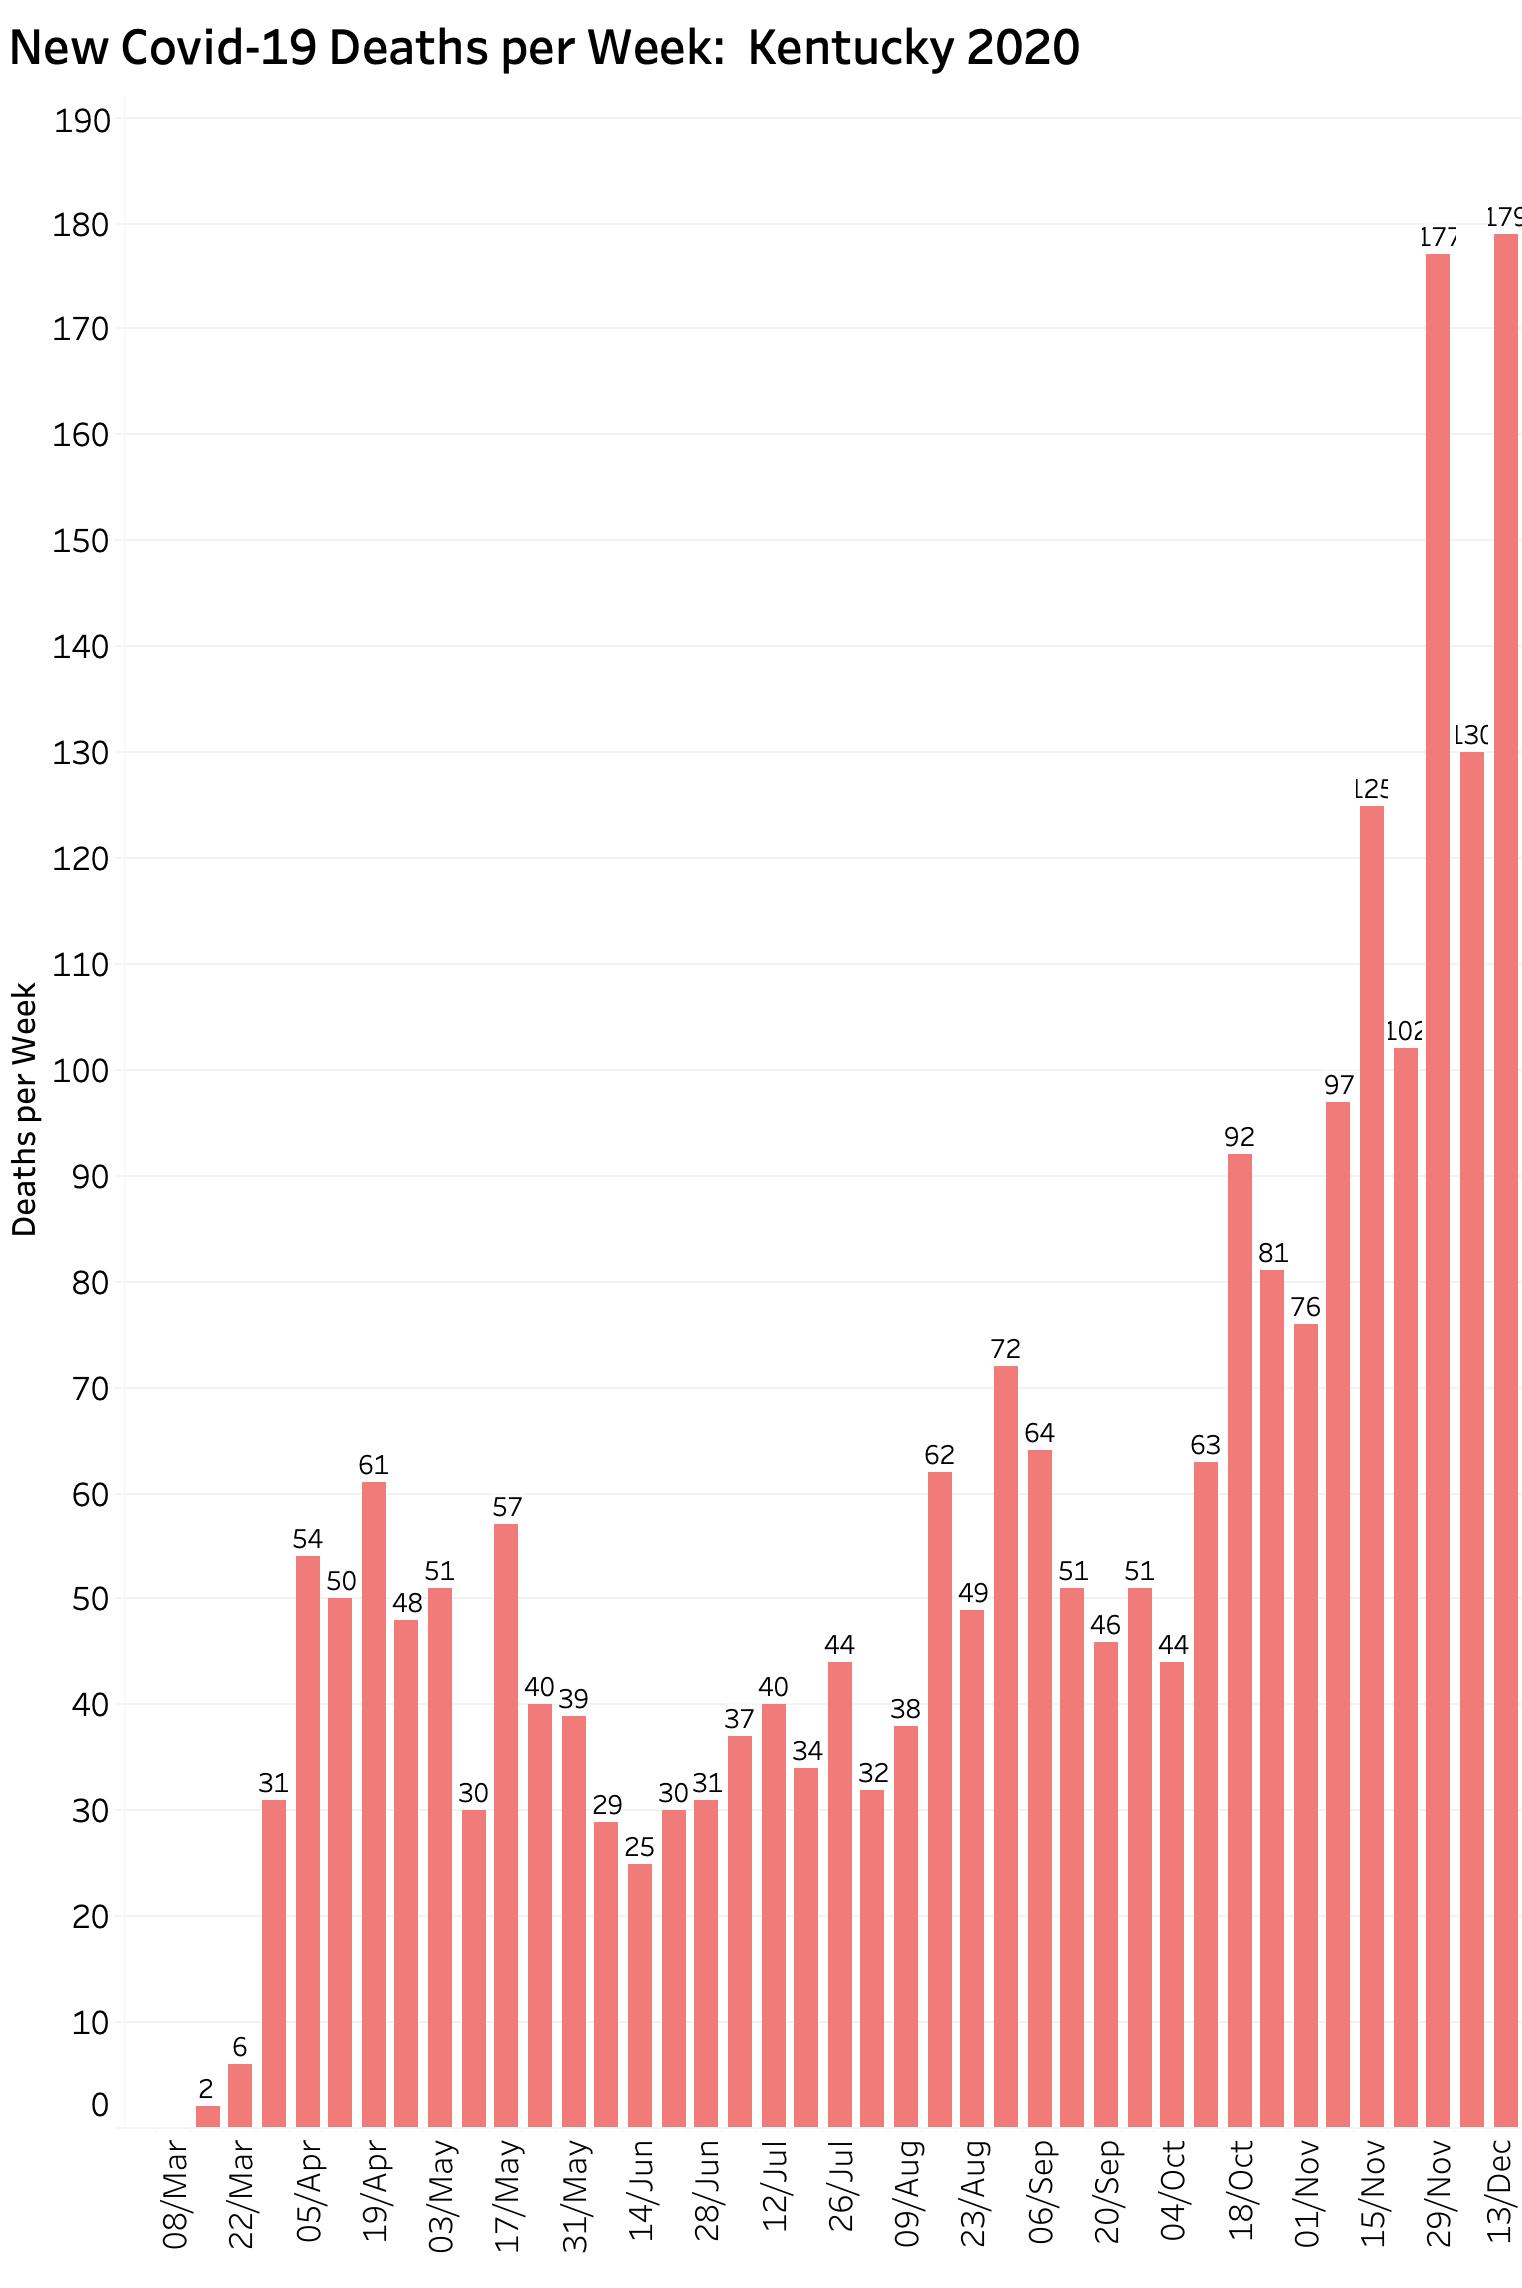
At this rate and if nothing changes one way or the other, we may see 3000 aggregate deaths directly attributed to Covid-19 by the second week of January. The number of related collateral deaths due to disruption of our usual health care system or drug overdoses will add many more cases to identified acute Covid cases. Sadly, even if surviving the impact of acute Covid-19, additional patients will die from chronic complications of the disease before their usual allotted time on earth.
Hospital and ICU Utilization.
The number of individuals currently in hospital or ICU beds or on ventilators has not yet taken a definitive turn downwards. These numbers are plotted on KHPI’s Tableau Public website.
Test Positivity Rates.
At one of last week’s daily updates the Governor was questioned by a reporter about why the State’s reported Current Test Positivity Rate was much lower than that calculated by the station from daily reported raw test and positive numbers. Certainly the latter method was the one I used initially in attempting to answer the basic question of “how can we tell if we are winning.” I dropped that data visualization from KHPI’s portfolio some time ago because the dramatic volitivity of the calculation greatly exceeded that of every other daily reported statistic. During December alone, the Positivity rate calculated from total new tests and cases bounced between 5% and 50%! The several reasons for volatility over the course of the epidemic are clear. In the beginning, negative test results were not even being reported and only very sick people were being tested at all. Testing capability was quite limited. Number of new tests performed per day varies very widely. On several days it was a negative number. It is not been obvious whether the data reported is of the swab or the report. As the epidemic progressed, testing methods began to include methods other than the “gold standard” viral RNA test to include traditional and more simply performed serological tests for other parts of the virus. These latter had very different measures of reliability, including the often referred to sensitivity and specificity, and derivitive false positives and false negatives. I am still unaware of how or if multiple tests on the same person were taken into account as individuals in some groups get weekly tests! Do they get counted more than once? Furthermore, testing sites had widely different timelines for reporting any result at all and apparently might even submit results using old fashioned paper or fax reports. There is no way that any meaningful conclusions could reliably be drawn by the Commonwealth from such numbers. Averaging over the time-delayed 7 to 14 day interval cannot satisfy the “garbage in- garbage out” test of the statistician! (I will post some comparative curves on Tableau Public in the next few days.)
It is important to note that Test Positivity is not claimed to be the same thing as the percent of a given population that is or has been infected by Coronavirus. It can serve as a proxy or “stand-in” to estimate whether or not we are testing enough people. For example, if the daily test positive rate was consistently still bouncing as high as 30% or more as it was in the early days of our epidemic, one might conclude that we were missing too many cases. Our 7-Day rolling average of Test Positivity settled down to single -digit numbers before rising again. No method of calculating Test Positivity is helpful unless it is calculated the same way every time. Correctly recognizing this truism as I understand it, what Kentucky has done in recent months is to restrict its analysis to only those PCR viral RNA tests that are reported electronically in a timely and consistent way, and uses what I understand to be a rolling average of those daily calculations. (The specific numbers used are not available to me or perhaps not to anyone else of the public. That, as well as providing most of the other non-personal data collected should be fixed.) I support our Department of Public Health’s use of this calculation method as one of a battery of indicators. In my opinion however, it is still the rubber-on-the-road of cases, hospitalizations, and deaths that remain as the most important relevant items to count. This is not to imply that there are no other useful measures of how, where, when, and how fast the virus is spreading.
That is enough for now.
Even though our collective public health efforts have been rewarded by this inter-holiday respite (and that an effective and sufficiently safe vaccine is now available!) there is no reason to assume we will maintain or better our current glimmer of relief. This past weekend came only three weeks after the end of the second Thanksgiving weekend. Today we are already into the week of Christmas. Kentucky has backed away from its most rigorous public health measures (such as no indoor service in bars and restaurants) and has softened others even as we face another widely anticipated and heavily traveled December holiday season. I would not venture a prediction of what January will look like. What will make the difference between meaningful success or continuing with the relentless 10-month invasion of Coronavirus is human behavior and a willingness to pull together. That alone is not enough. If a community asks its members to do hard things, then the community needs to support its people and to do so until the dust has settled. We are at this point seeing less than fully effective application at both ends of these rules. Indeed, we are told by the travel industry, that record numbers of people will be in the air or on the road. Shopping centers are filling up. Loved ones are reuniting. Lawsuits are being filed. Legislation is being promised. We are not winning yet.
Peter Hasselbacher, MD
Emeritus Professor of Medicine, UofL
21 December 2010