Yesterdays’s report totaled 1549 new cases of Covid-19. There has been no letup in reported New Cases, Percent Test Positivity, or Hospital and ICU utilization since the first week of July. Unless there are changes in behavior of Kentuckians, there is no reason to expect any change in this exponential trajectory. At this rate new cases are still doubling every 8-10 days. We all should know where that leads!
Yesterday I listened to a presentation by the Robert Wood Johnson Health Policy Fellowship program at the National Academy of Medicine of which I am an alumni. The title was “Communicating Science Effectively in the Time of COVID.” The program was well done, but sobering for me. The old scientist that I am works from a basic assumption that the facts will speak for themselves. Thus I spent much time unpacking state and national databases to describe what is happening in this epidemic and using that information to predict potential futures. That approach is obviously insufficient. It’s more complicated than that! Facts must be supplemented by stories. As I no longer take care of individual patients and am not part of the traditional public health apparatus, I have few stories to share. Others are doing that job for us. We need to pay better attention to our audiences. The challenge to act as a community instead of as individuals is great, but in my opinion one that must be faced as we learn to live with this first great plague of the 21st Century that isn’t going away soon.
The data speaking to me today tell me it is going to get a lot worse before we turn the corner again.
Peter Hasselbacher, MD Emeritus Professor of Medicine, UofL
Unless one has been living in a cave these past months (or the modern equivalent of being totally off the grid) it is impossible not to acknowledge that the world, our nation, and our state of Kentucky are entering a sustained major surge in Covid-19 disease that has already shown its ability to duplicate some of the worst experiences to date for the pandemic. Since July 1, 2021, every reported indicator used to monitor new cases in Kentucky has been moving together in exactly the wrong direction. These include daily and weekly new cases and their 7- and 14-day averages, Kentucky’s calculated Test Positivity Rate (TPR), and rising hospital and ICU utilization. That the rate expansion of Kentucky’s epidemic is increasing daily is indicated by a 7-day new-case rate that exceeds the 14-day rate; and that since July 1, new cases have been rising exponentially with an estimated doubling rate of about every 10 days. These indicators put us in the same place we were in last summer before the nightmare of last winter’s holiday surges. Because the state has decreased its reporting days, the following graphics summarize the date only up to Friday, July 23. [See addendum at end of the article for update through 26 July 2021.]
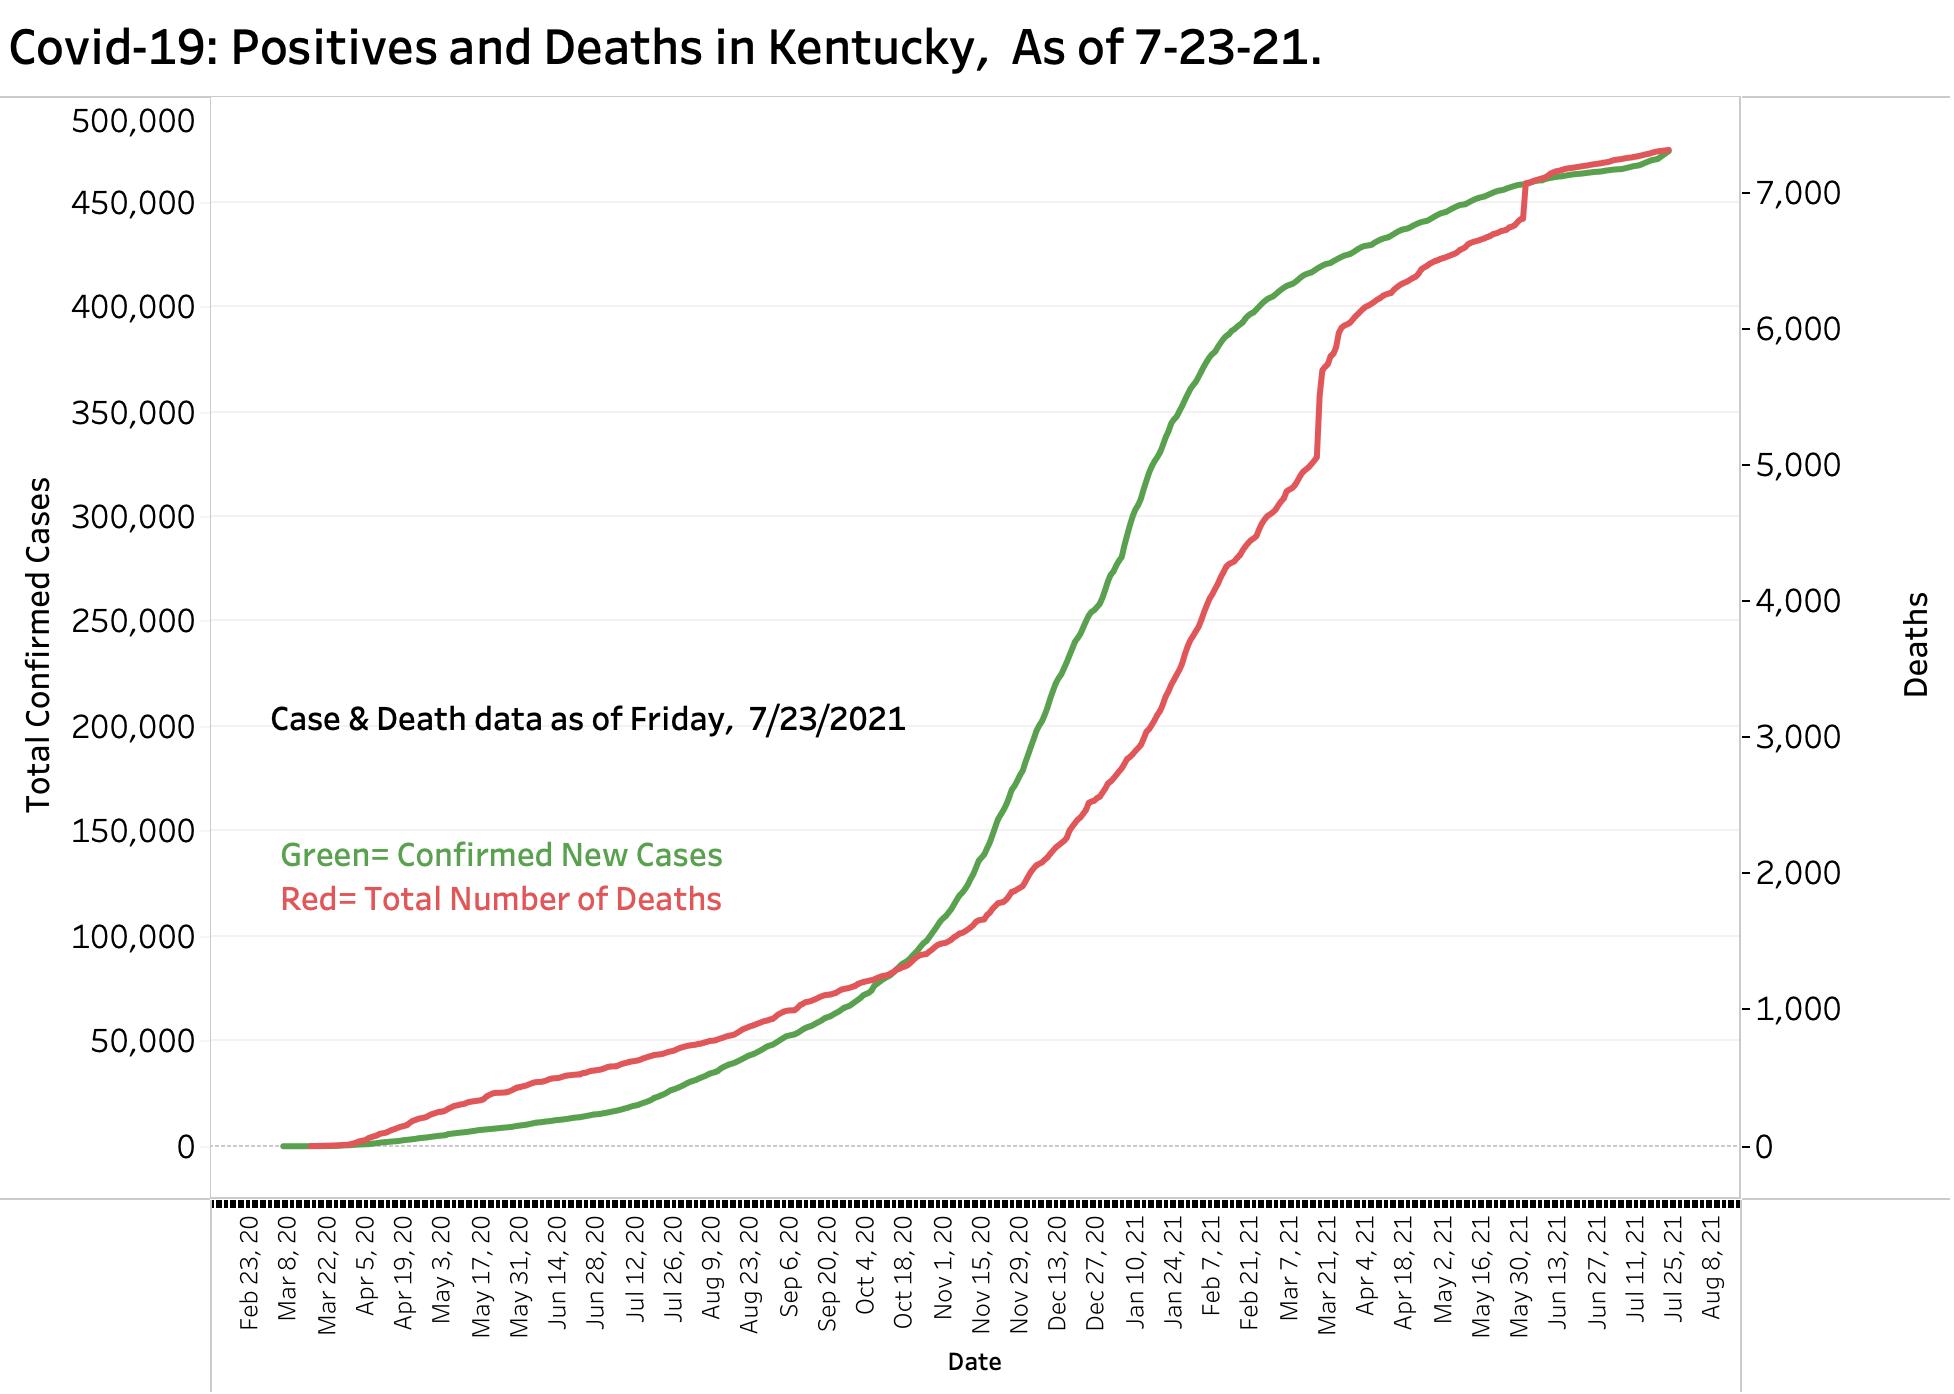
Overview of Aggregate New Cases and Deaths: This has been KHPI’s summary graphic for over a year. With over 7-million viral tests counted, at least 474,444 unique cases of Covid-19 were diagnosed. Virtually all authorities assume this is a gross undercount. One might assume that counting deaths would be more accurate, but even the 7312 Kentucky deaths counted so far are surely an undercount of the actual mortality that can be said to have been caused by the Coronavirus. Large one-day increases in deaths reported in March and June attest to the fact that we did not have reliable timely systems in place to track Covid-19 deaths, let alone the excess deaths due to disruption of the healthcare system. Similar artifacts in reports of cases and tests occurred that complicated our epidemic surveillance and predictions. This epidemic caused more misery than illness and deaths alone. Social disruption was massive– and continues.
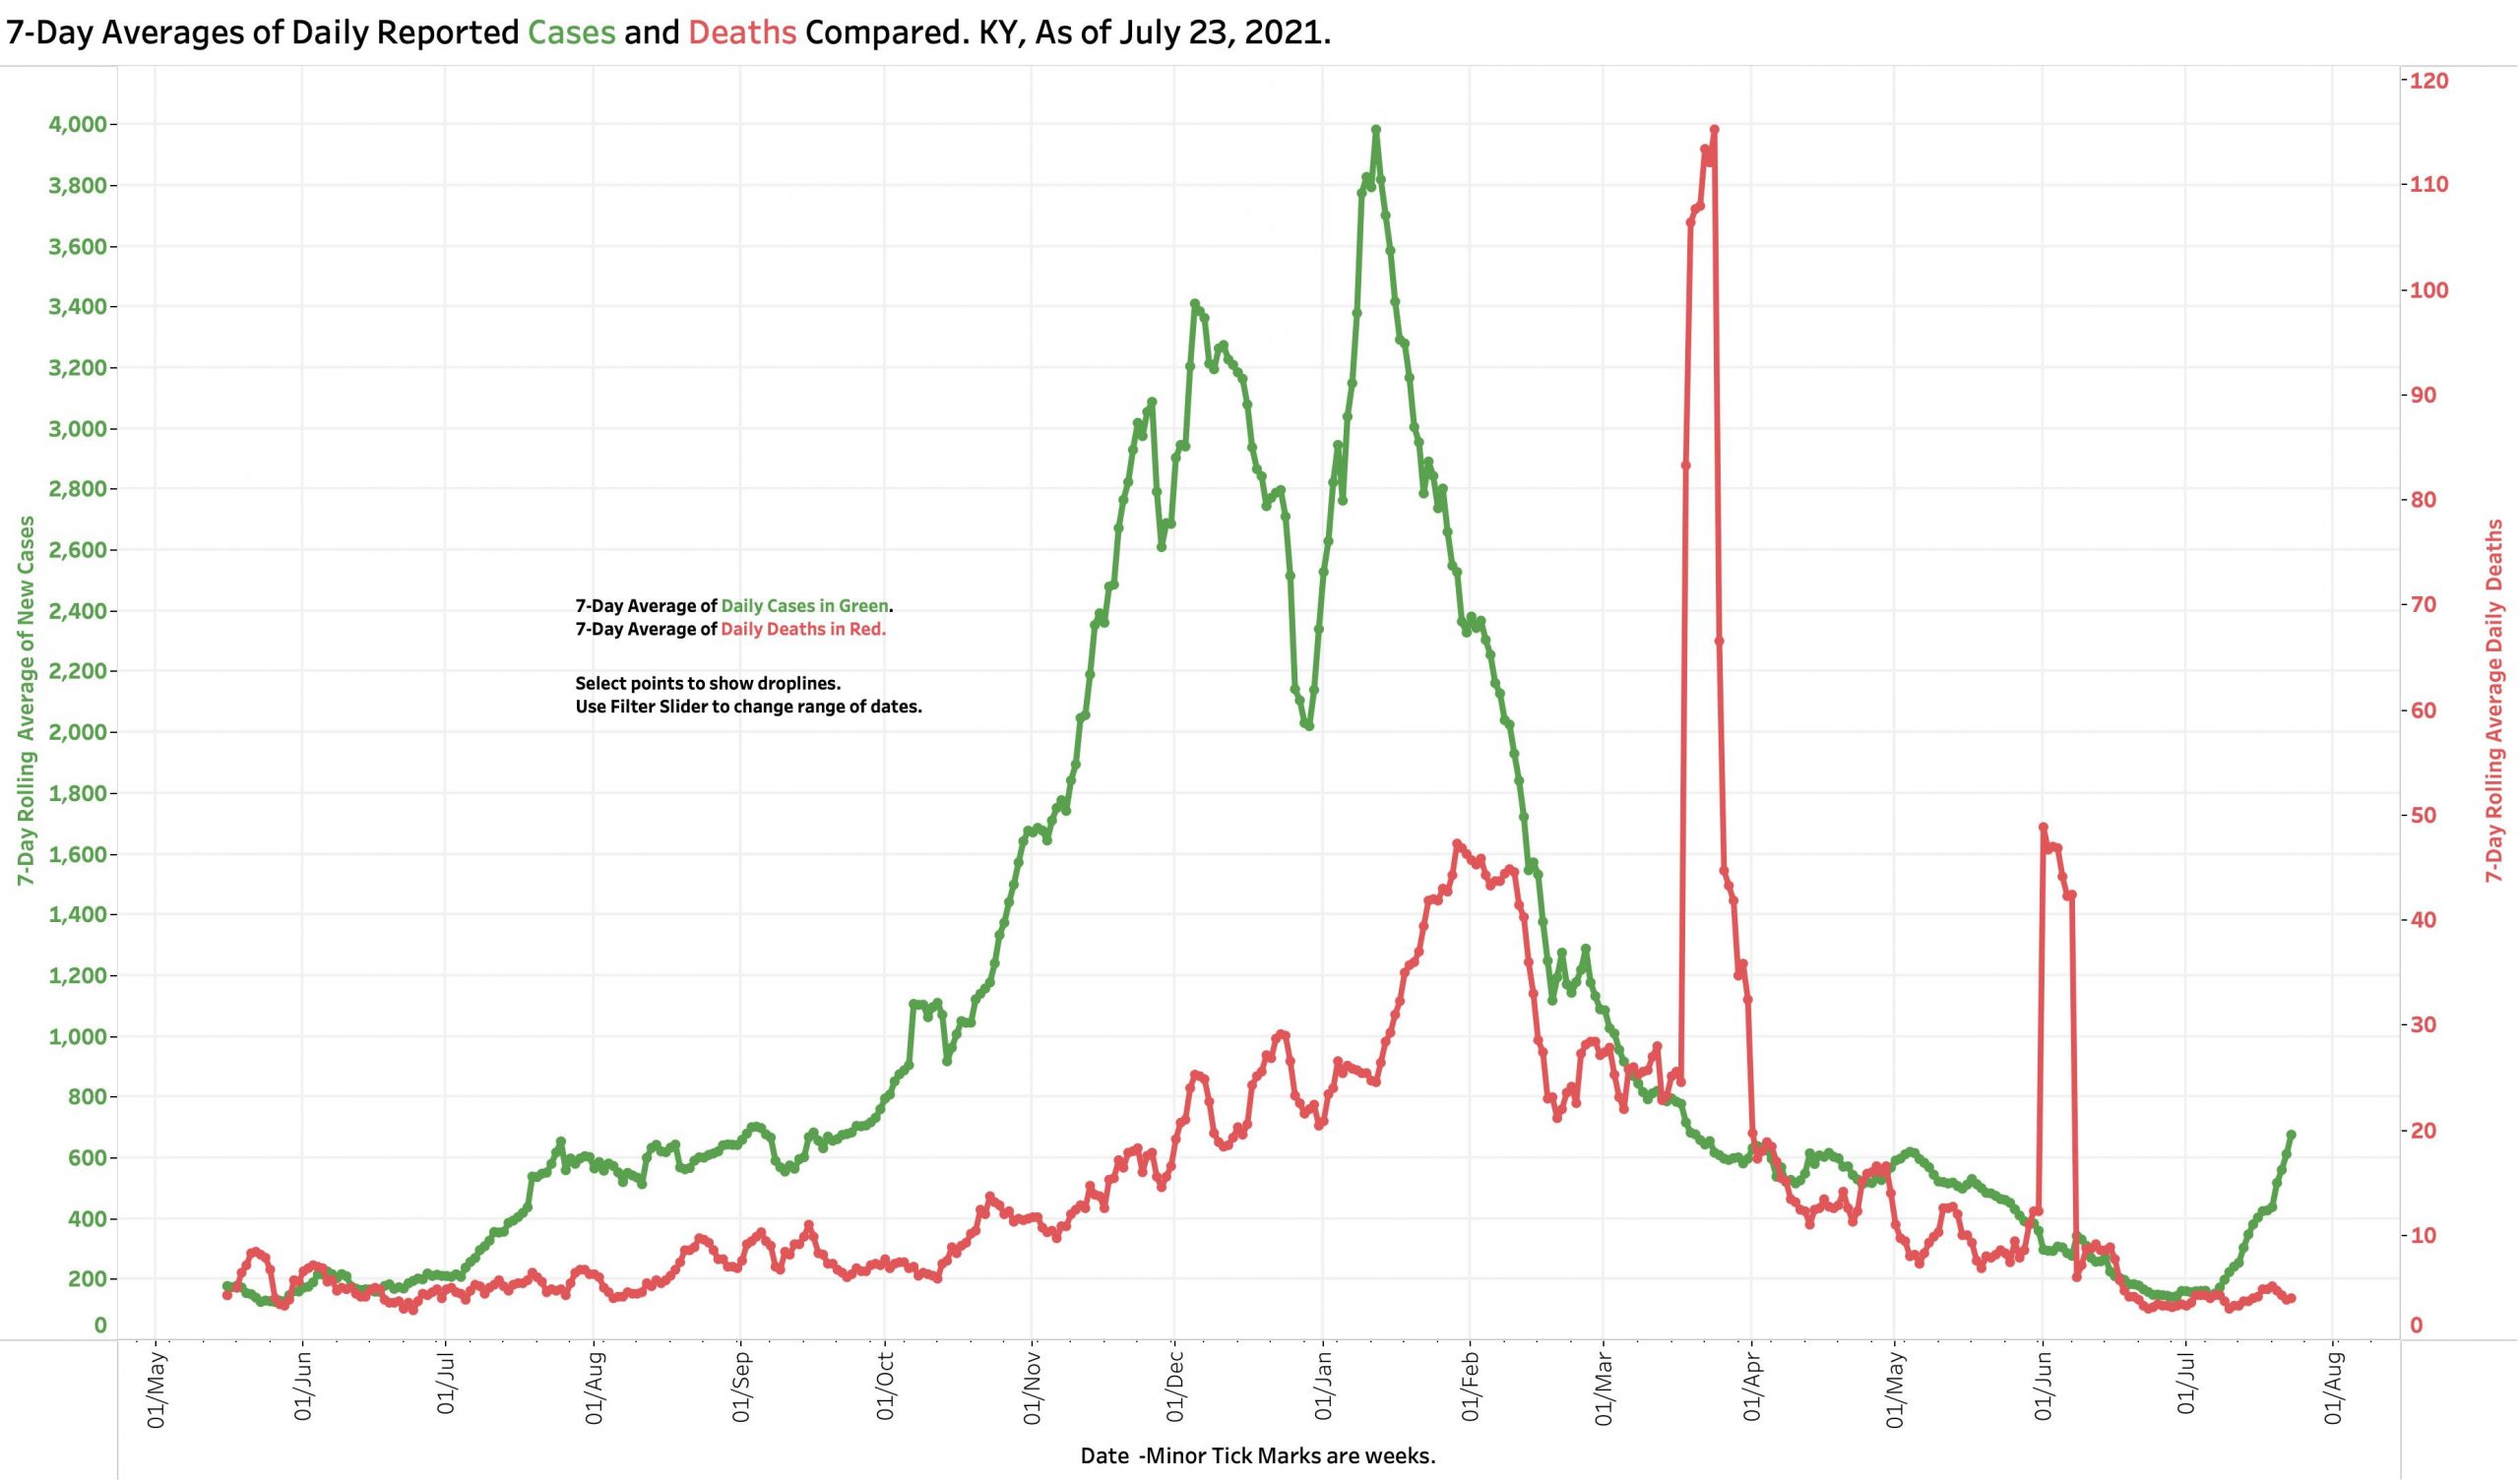
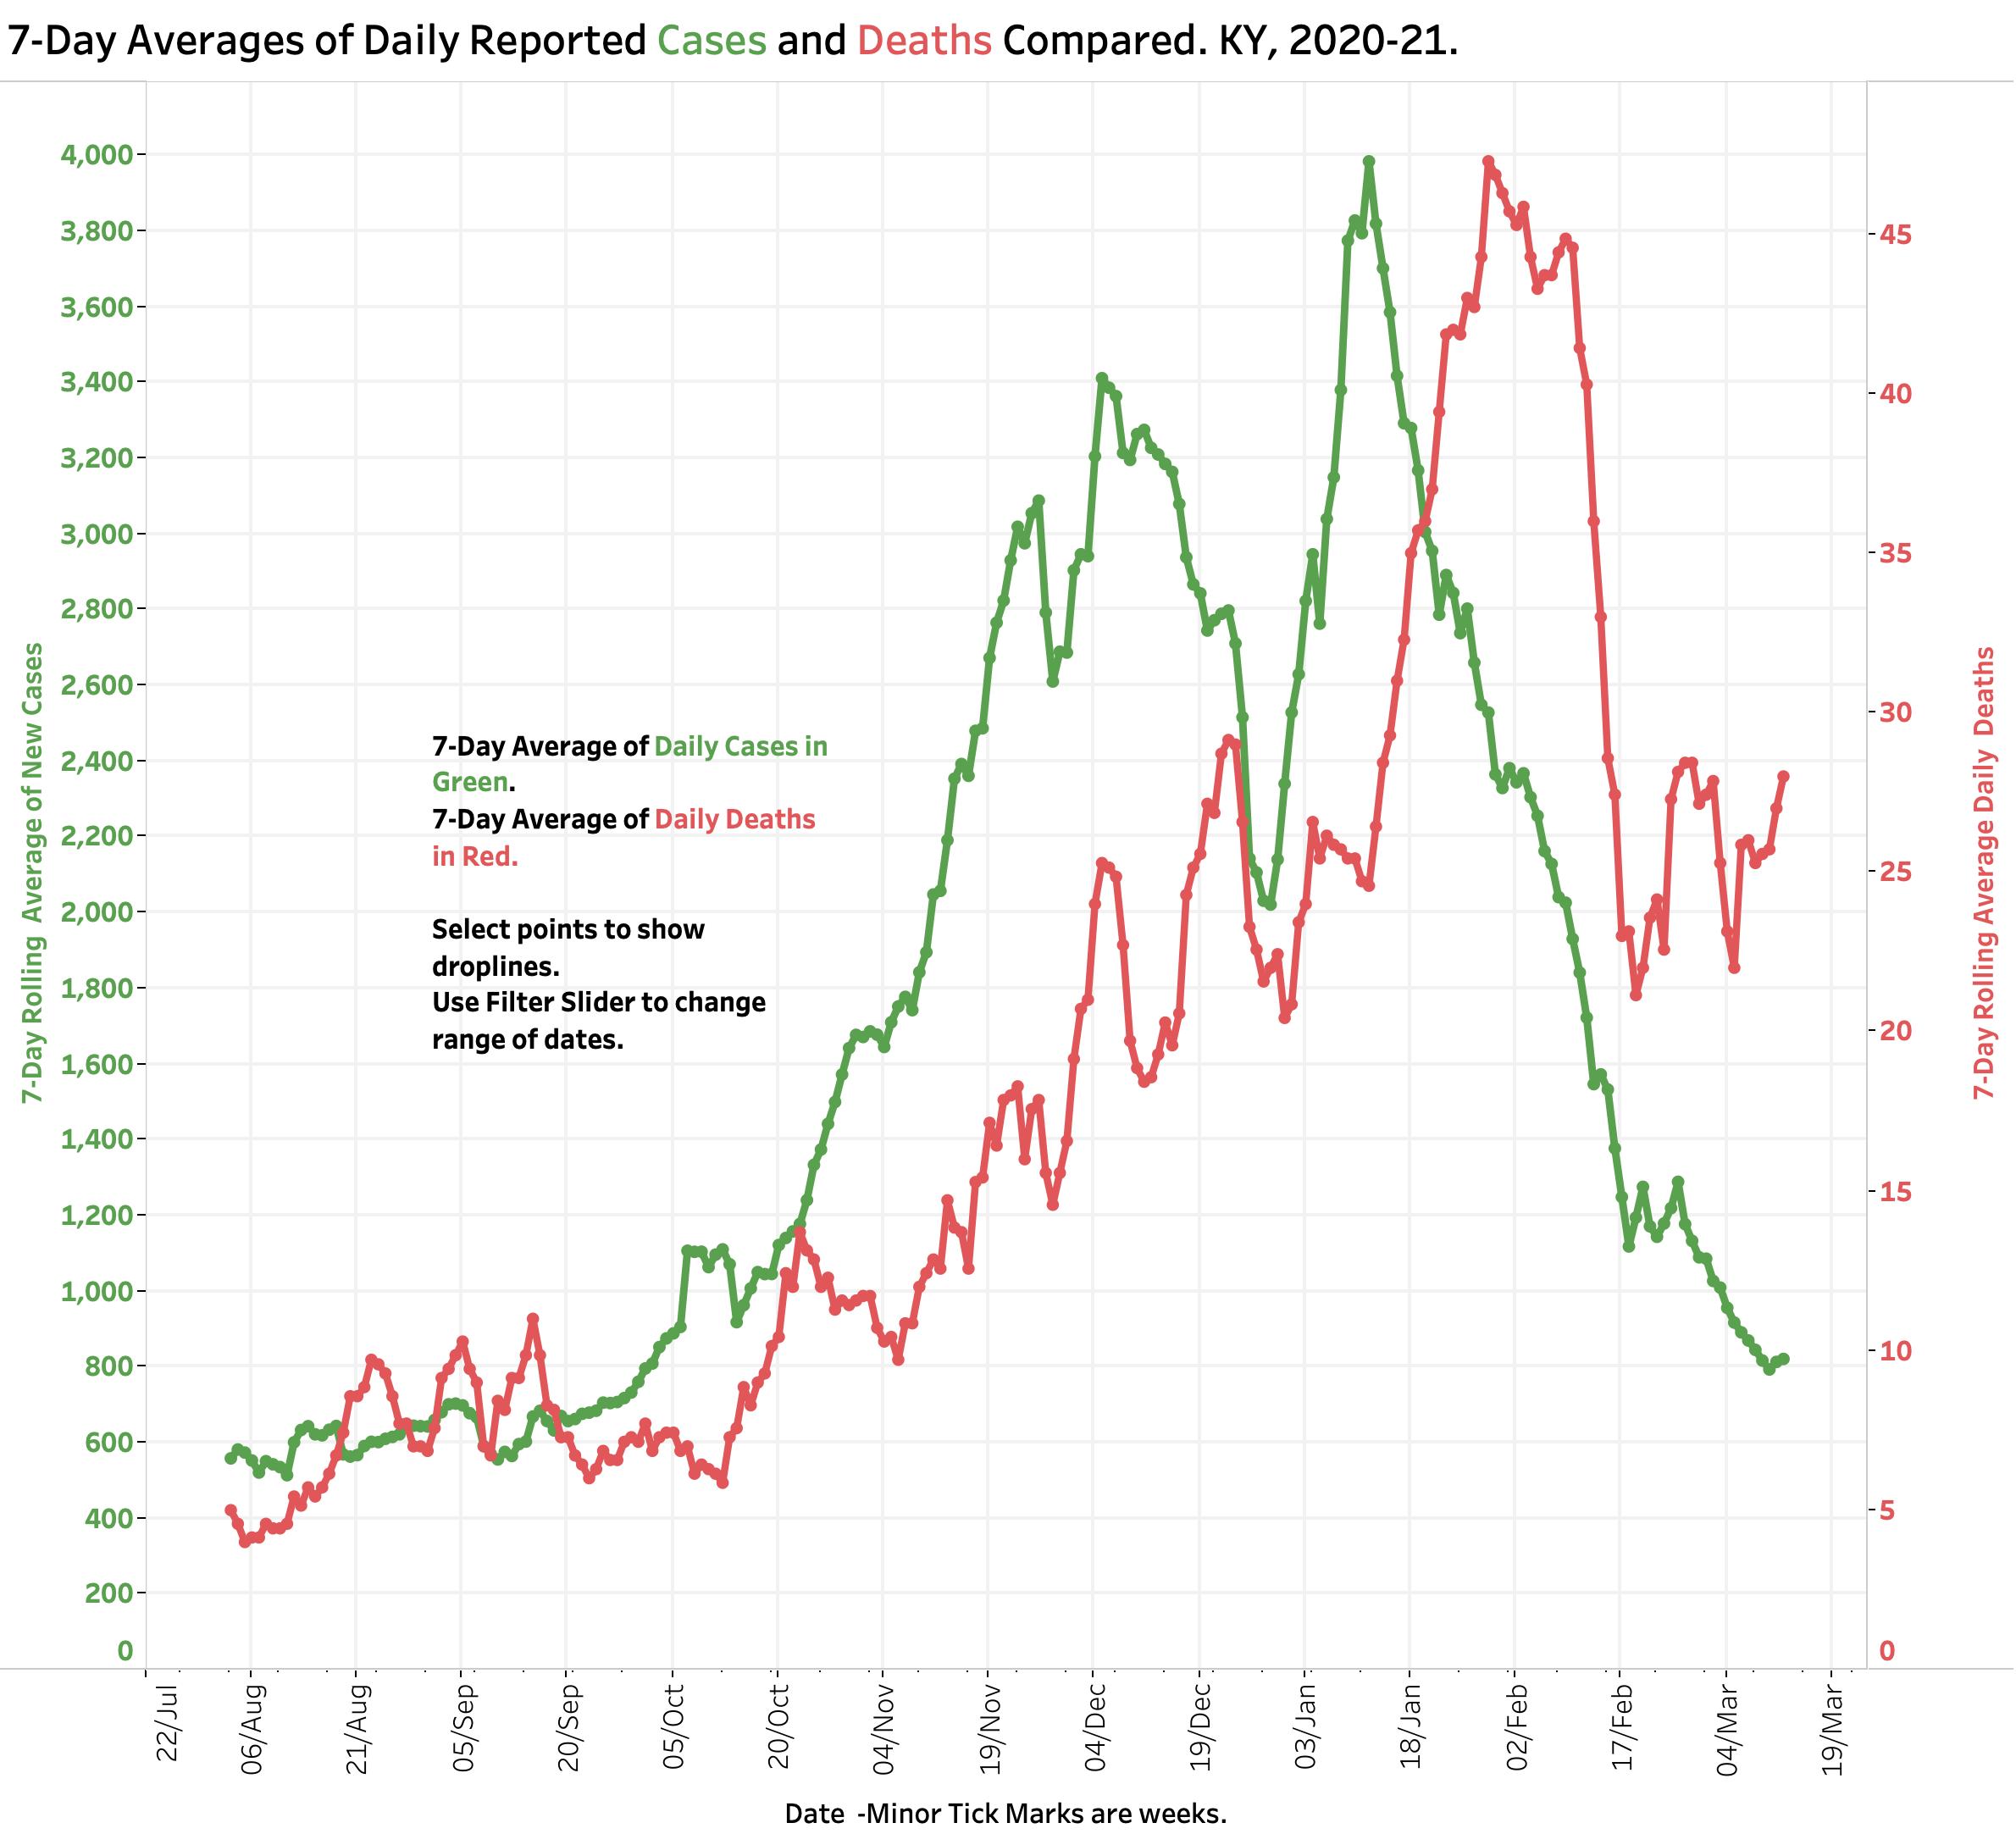
7-day Average Daily New Case and Death Counts. Because reporting systems follow a calendar of days of the week and holidays, day-to-day variation in counts swings widely. Kentucky and much of the rest of the nation no longer issues reports over the weekends. It is now customary to use 7- or even 14-day averages to identify trends, albeit delayed and after the fact. Assuming little change in reporting systems one does not need sophisticated statistical analysis to discern a relentless increase in new cases since July 1. No such increase has been observed as yet in Kentucky as has been seen in other states, but as demonstrated by the figures below, hospitalizations and deaths reliably follow rising cases by weeks not days. (Note the artifactual spikes in deaths in March and June.)
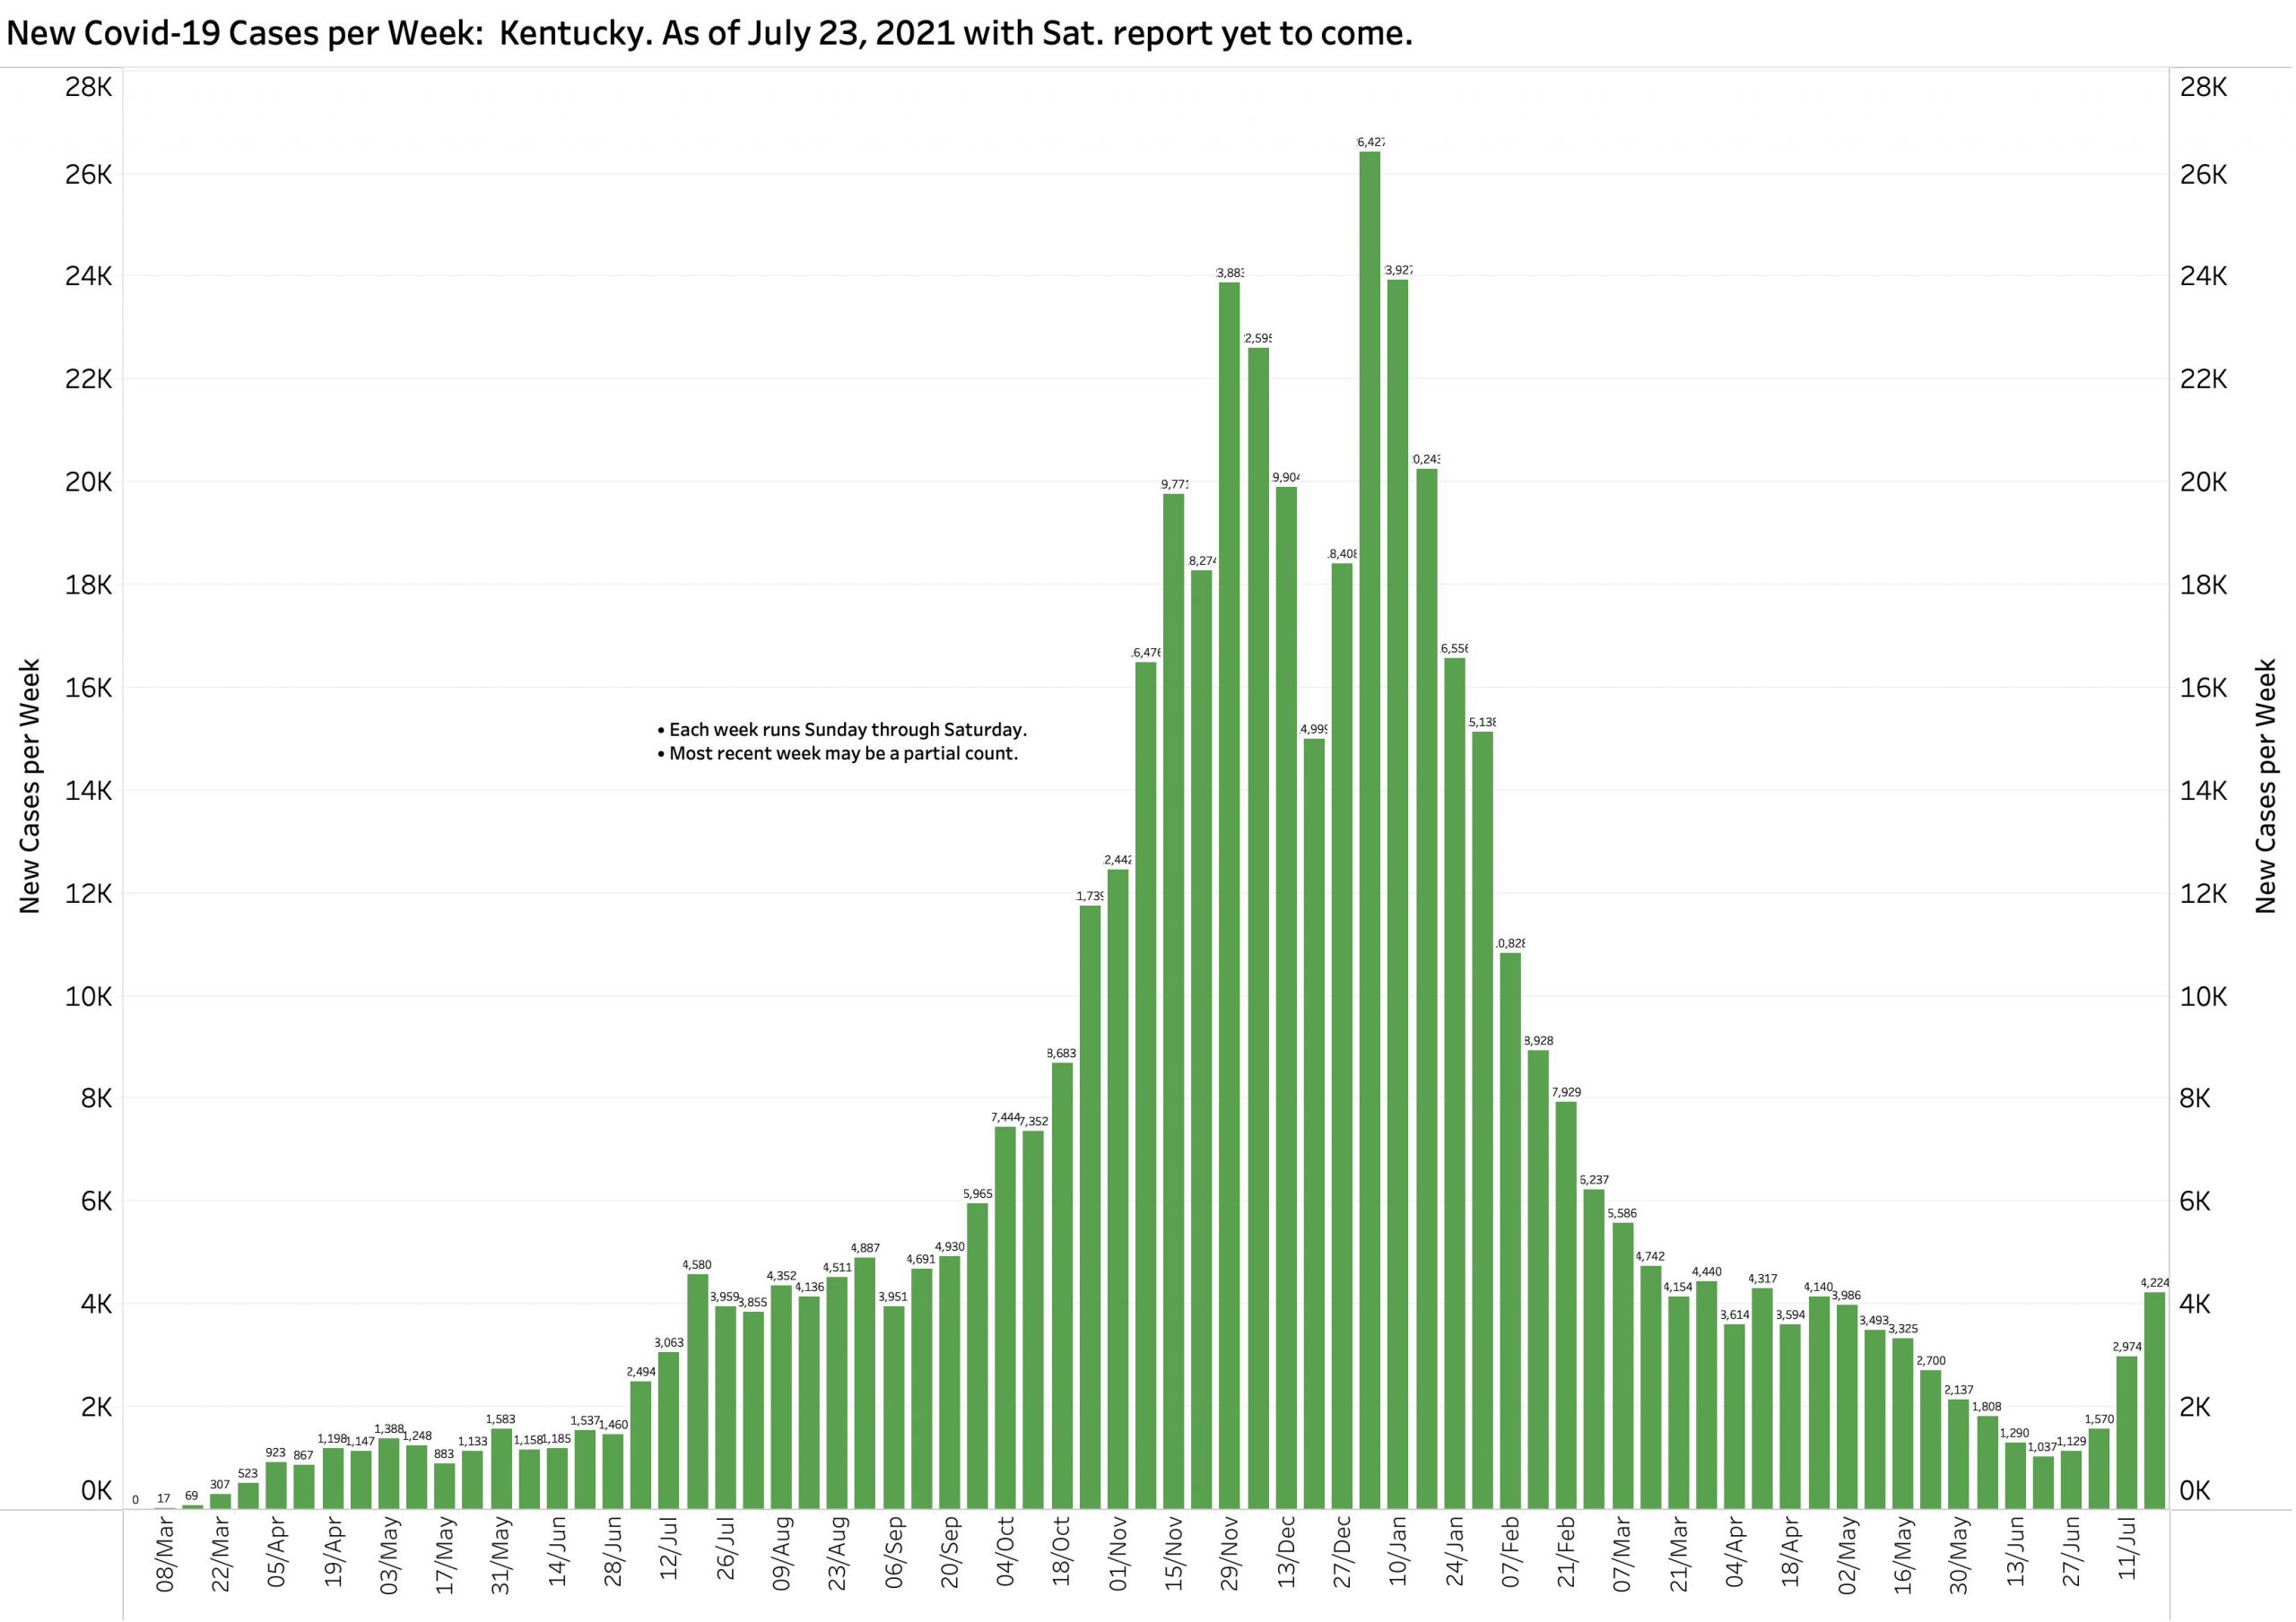
Weekly Case Counts. Another way to even out or average case, death, or test counts is to summarize counts by week or months. The figure below shows weekly (Sunday to Saturday) counts of new cases since March of 2020. The most recent week displayed of 4224 additional new cases as defined by KHPI but does not include cases from Saturday, July 24. Conservatively adding another estimated 900 cases would give a total of 5124 for the week. This is be the highest since February’s fall from our winter surge and puts us in the same place as September 2020.
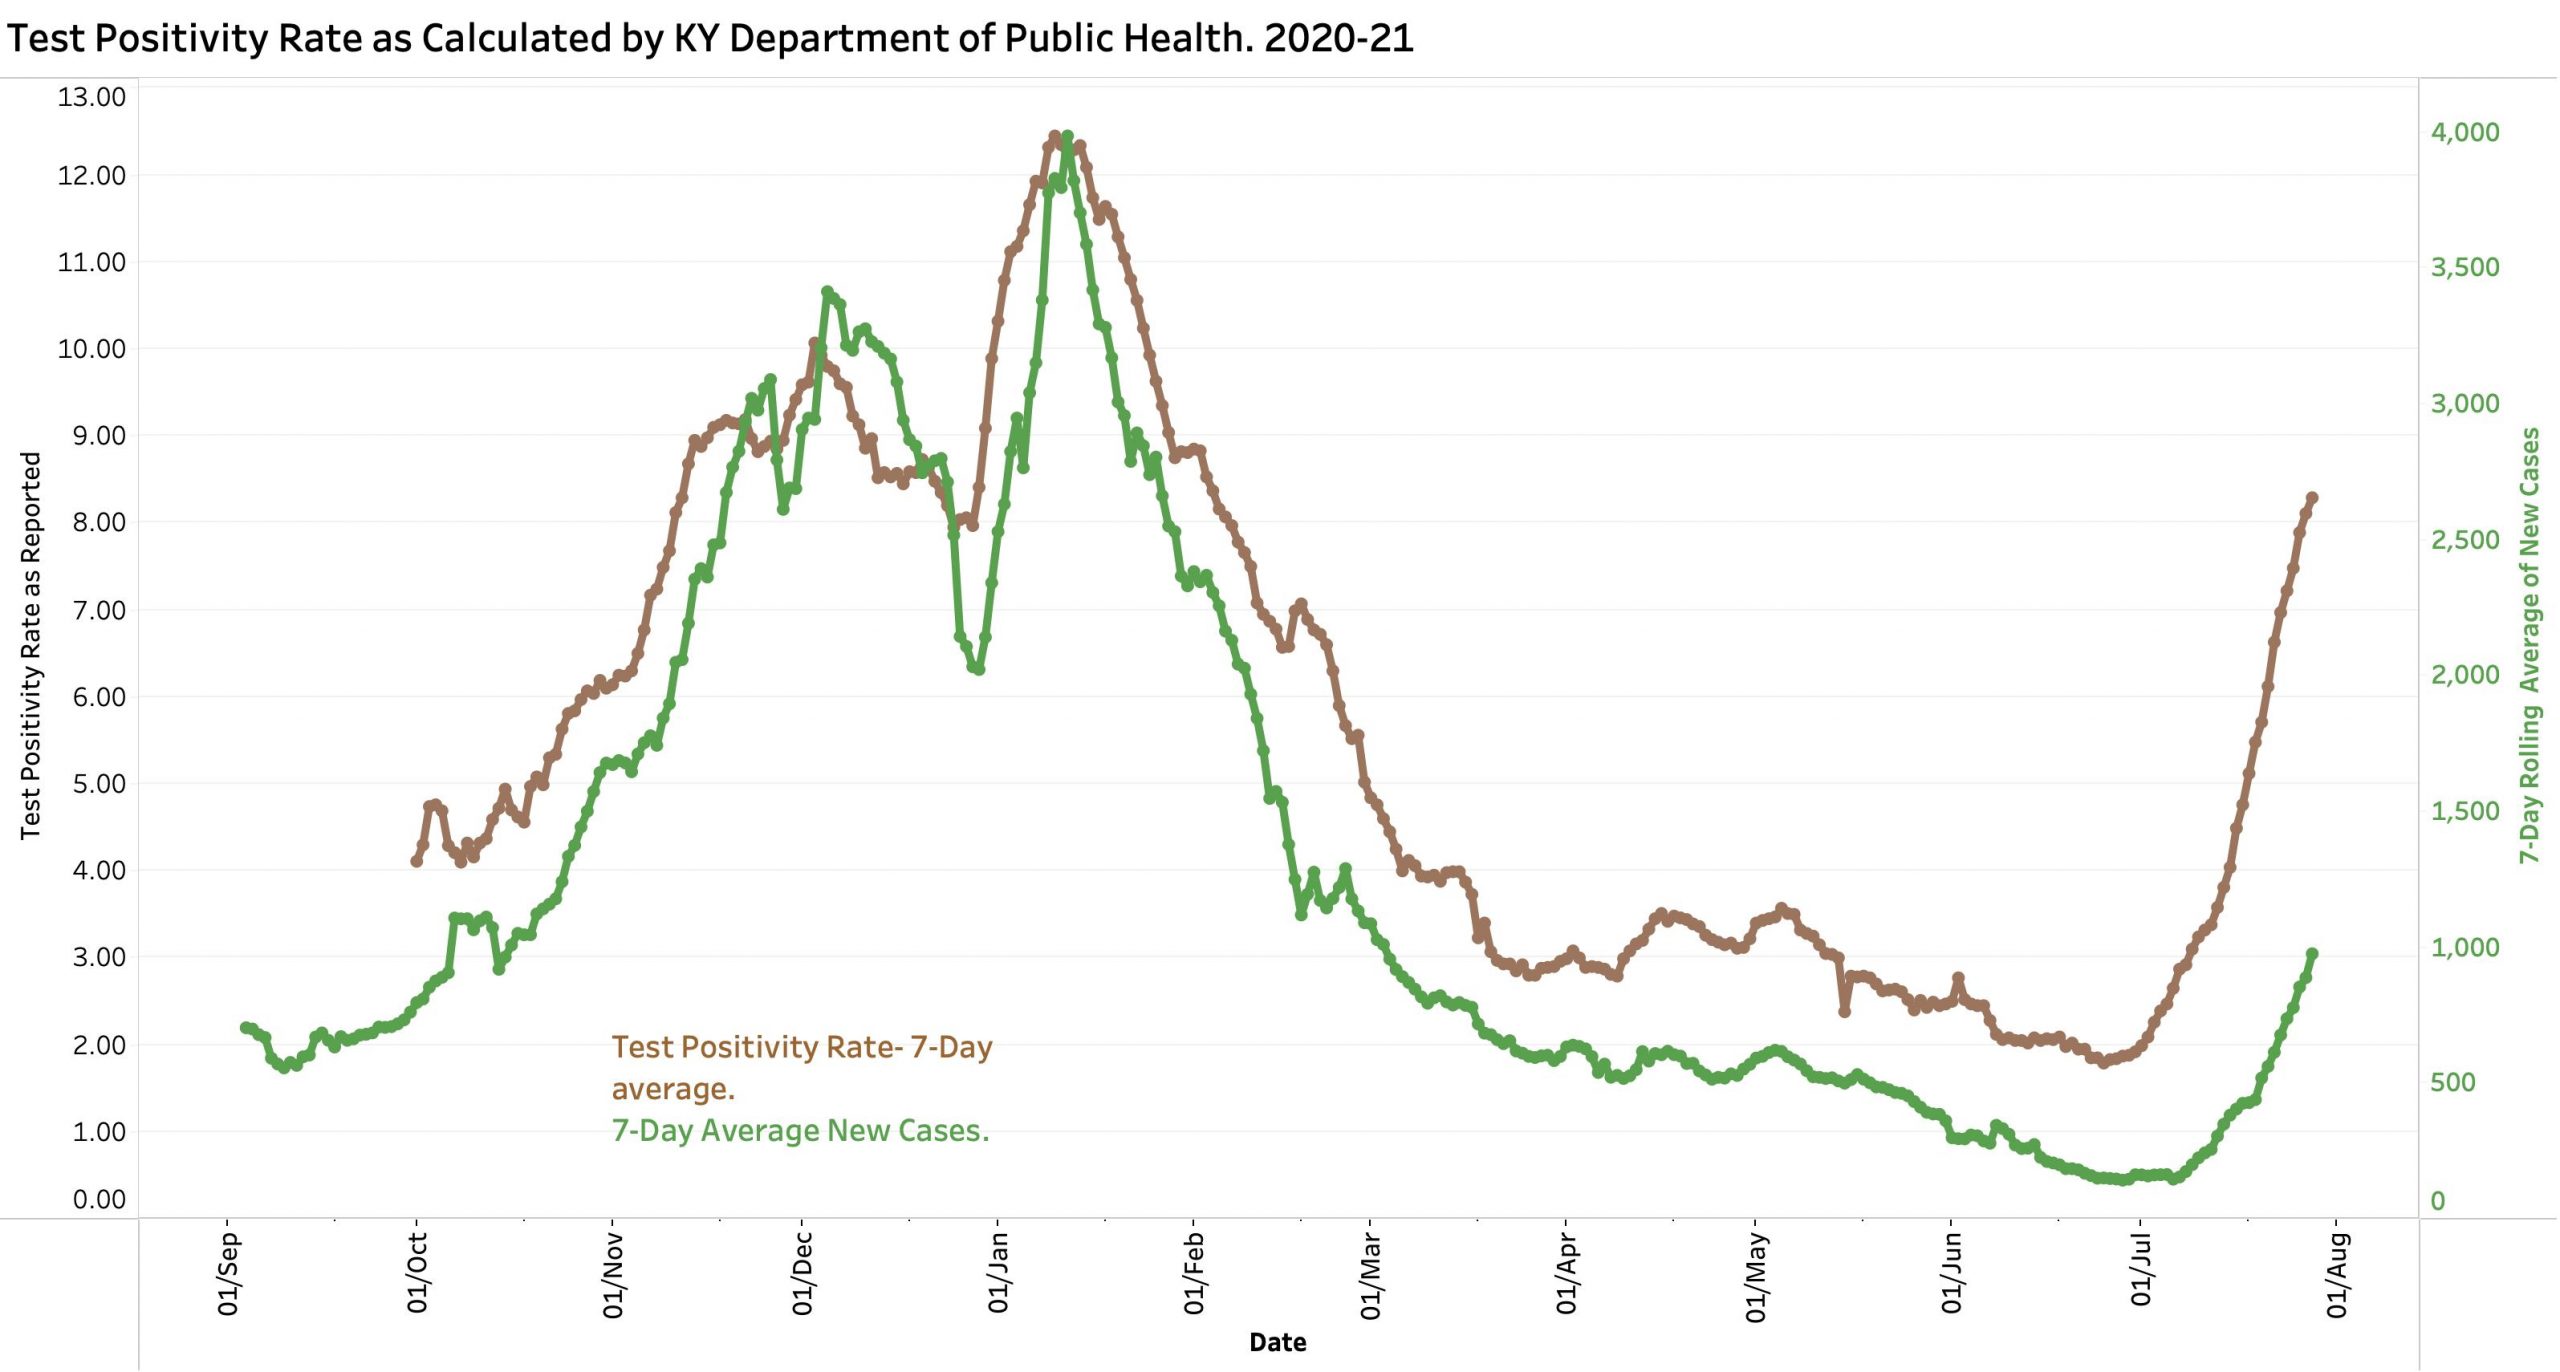
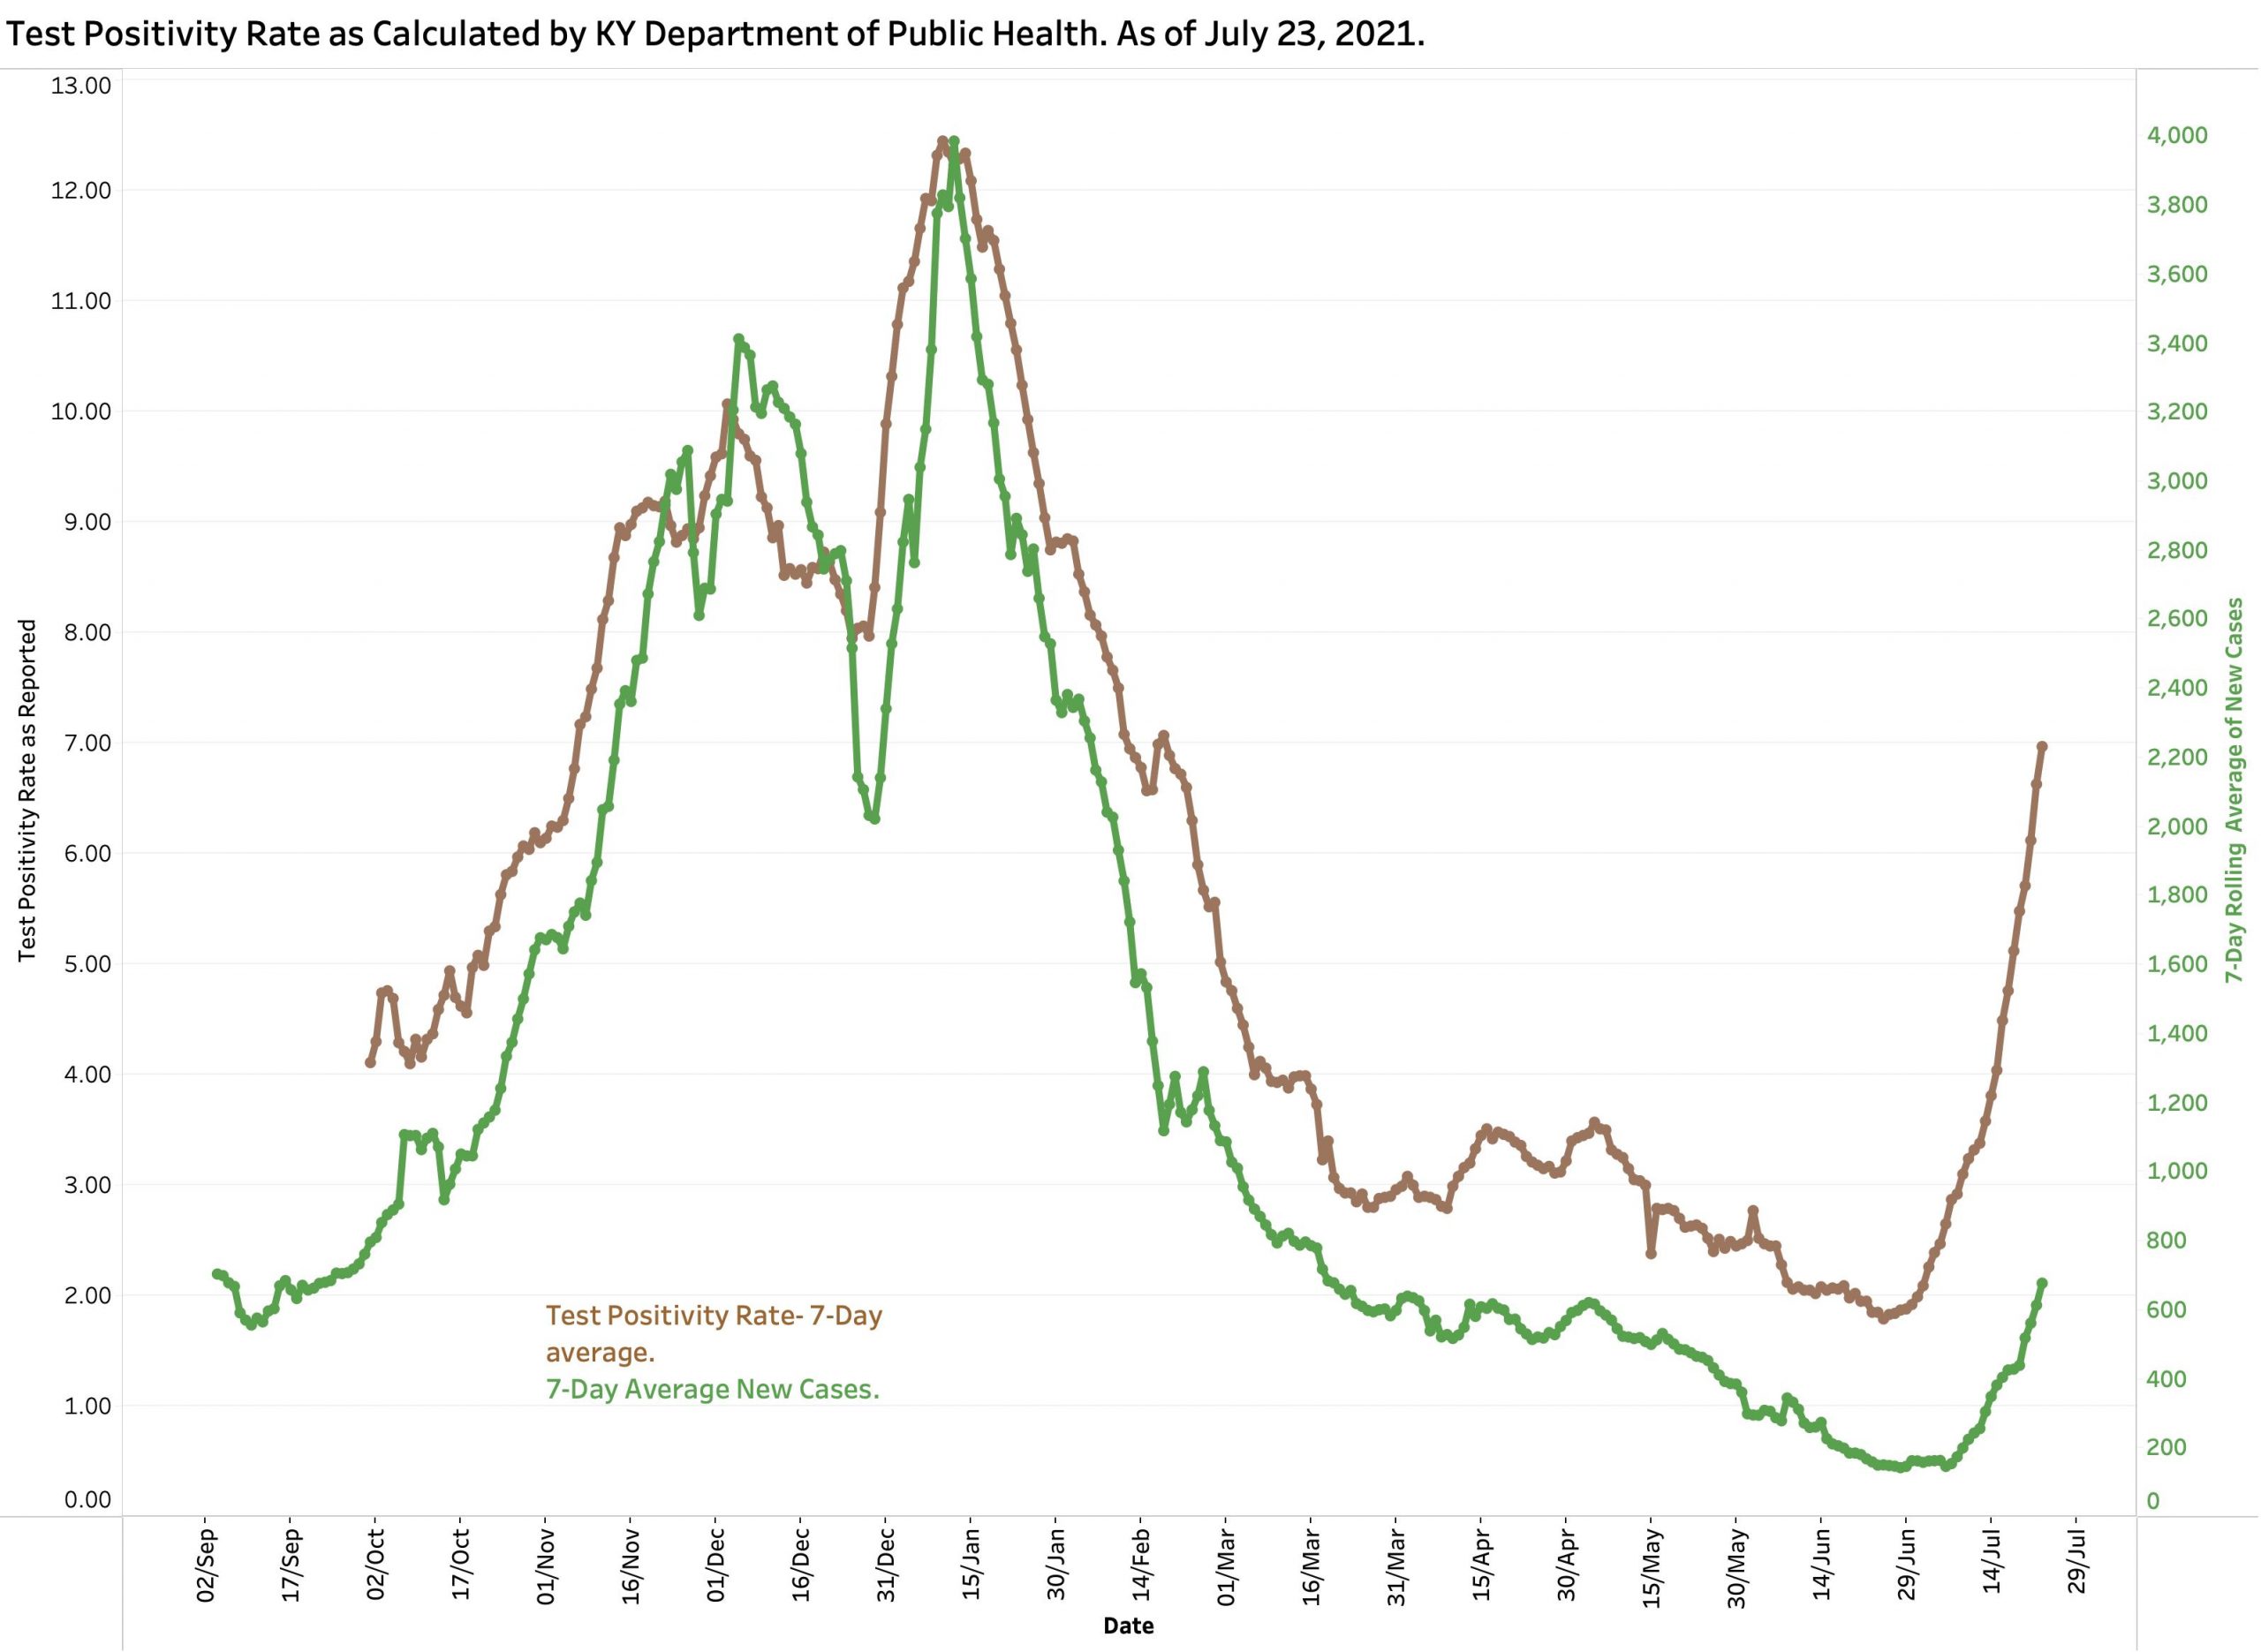
Test Positivity Rate. Kentucky uses a calculated positivity rate that is based on a 7-day average of certain electronically reported tests that are positive. This is different than raw daily positivity rates which are higher, but has the important advantage of being more reliable. The nearly vertical climb of the brown TPR curve is frankly scary. The 7-day average of new cases is dutifully following along behind.
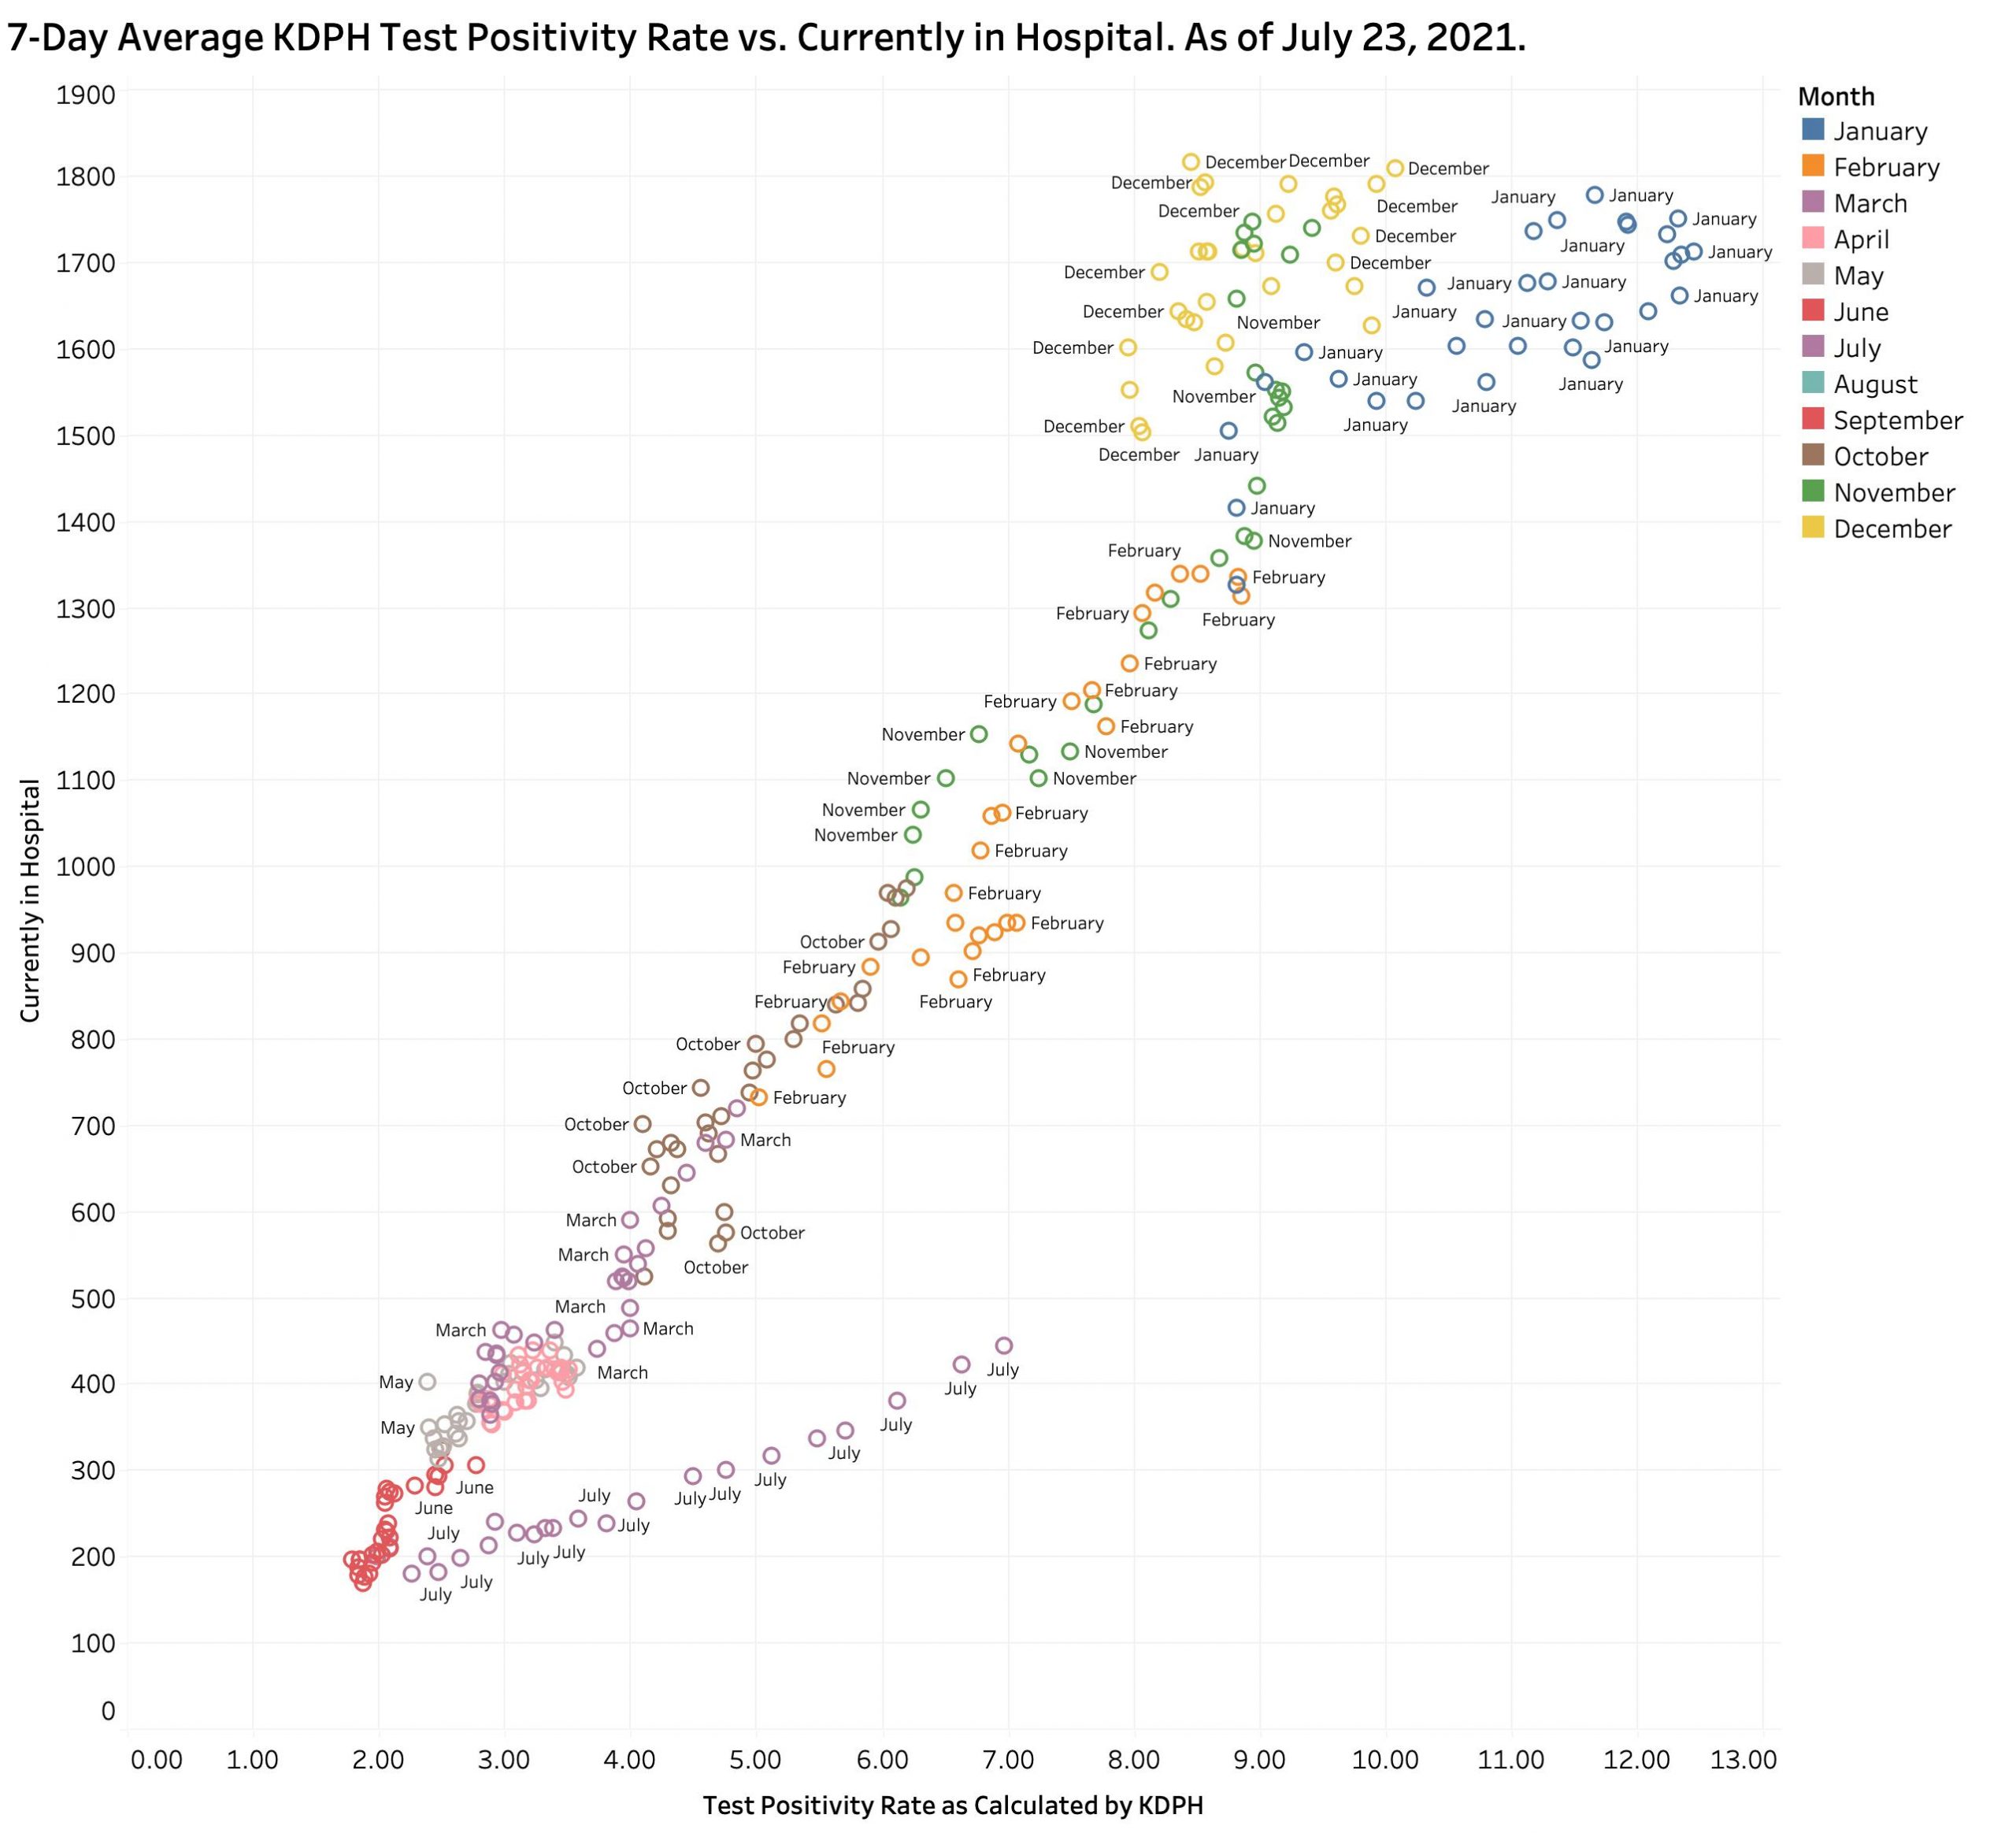
Hospital Utilization. Test Positivity Rate tracks along not only with new cases, but also with hospitalizations. The following graphic displays the relationship of TPR with reported “Currently In Hospital” counts since December of 2020 when the new method of calculating TPR was introduced. Everything was going in a desirable directing until this July. The relentless deviation upwards is not a direction in which we want to be going. (A similar plot of TPR against 7-day new cases looks very much the same.)
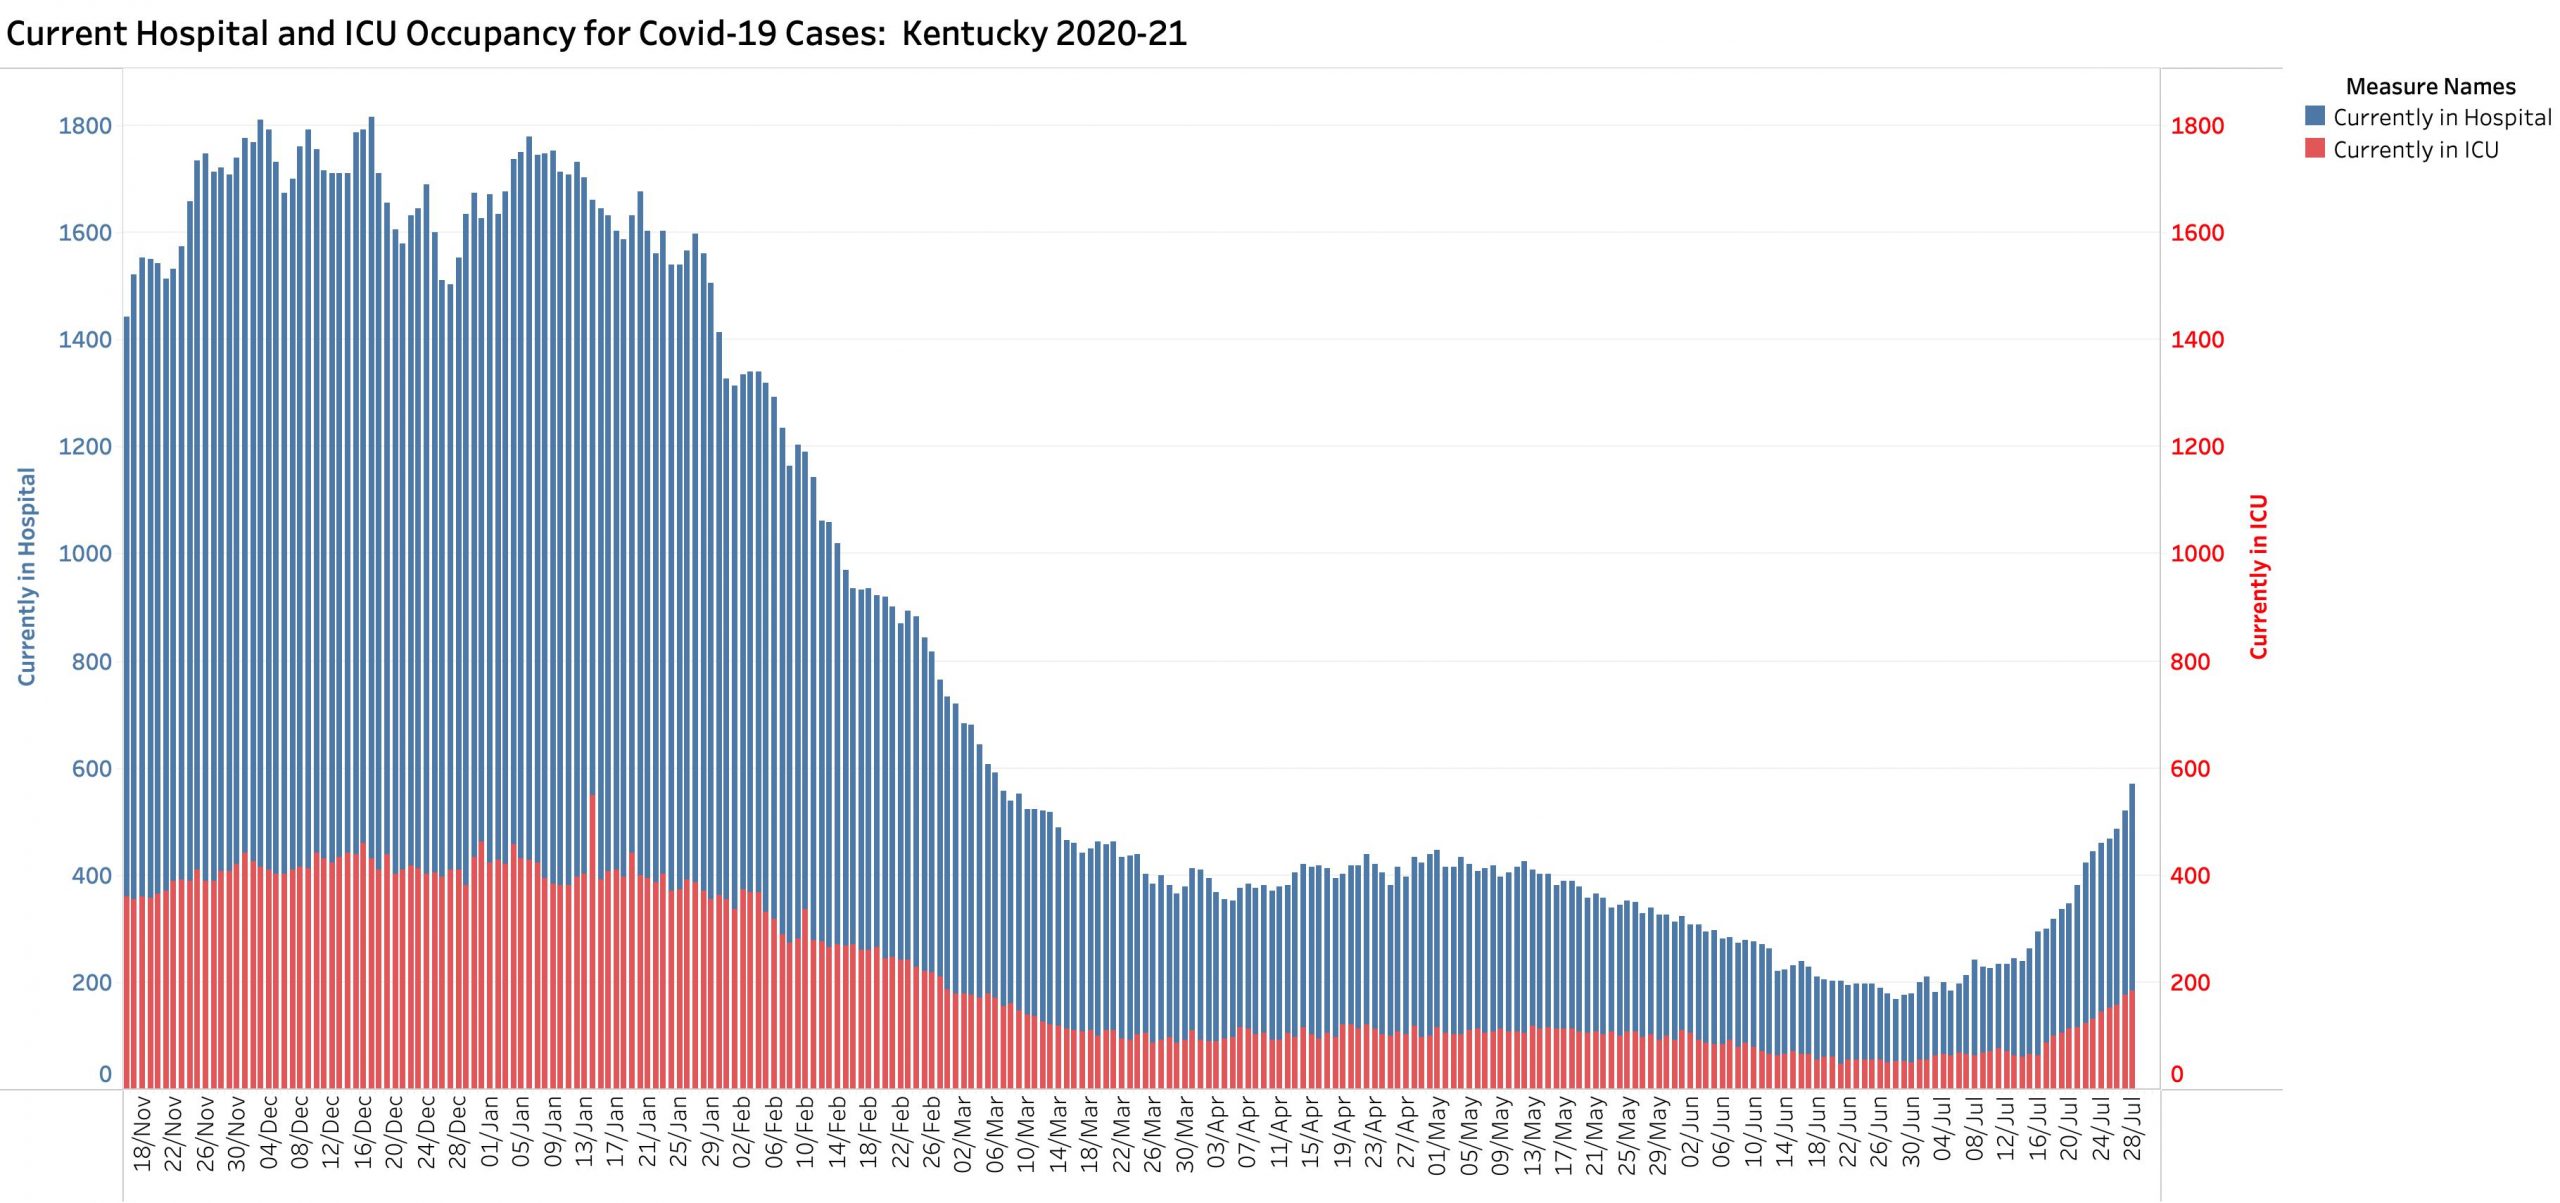
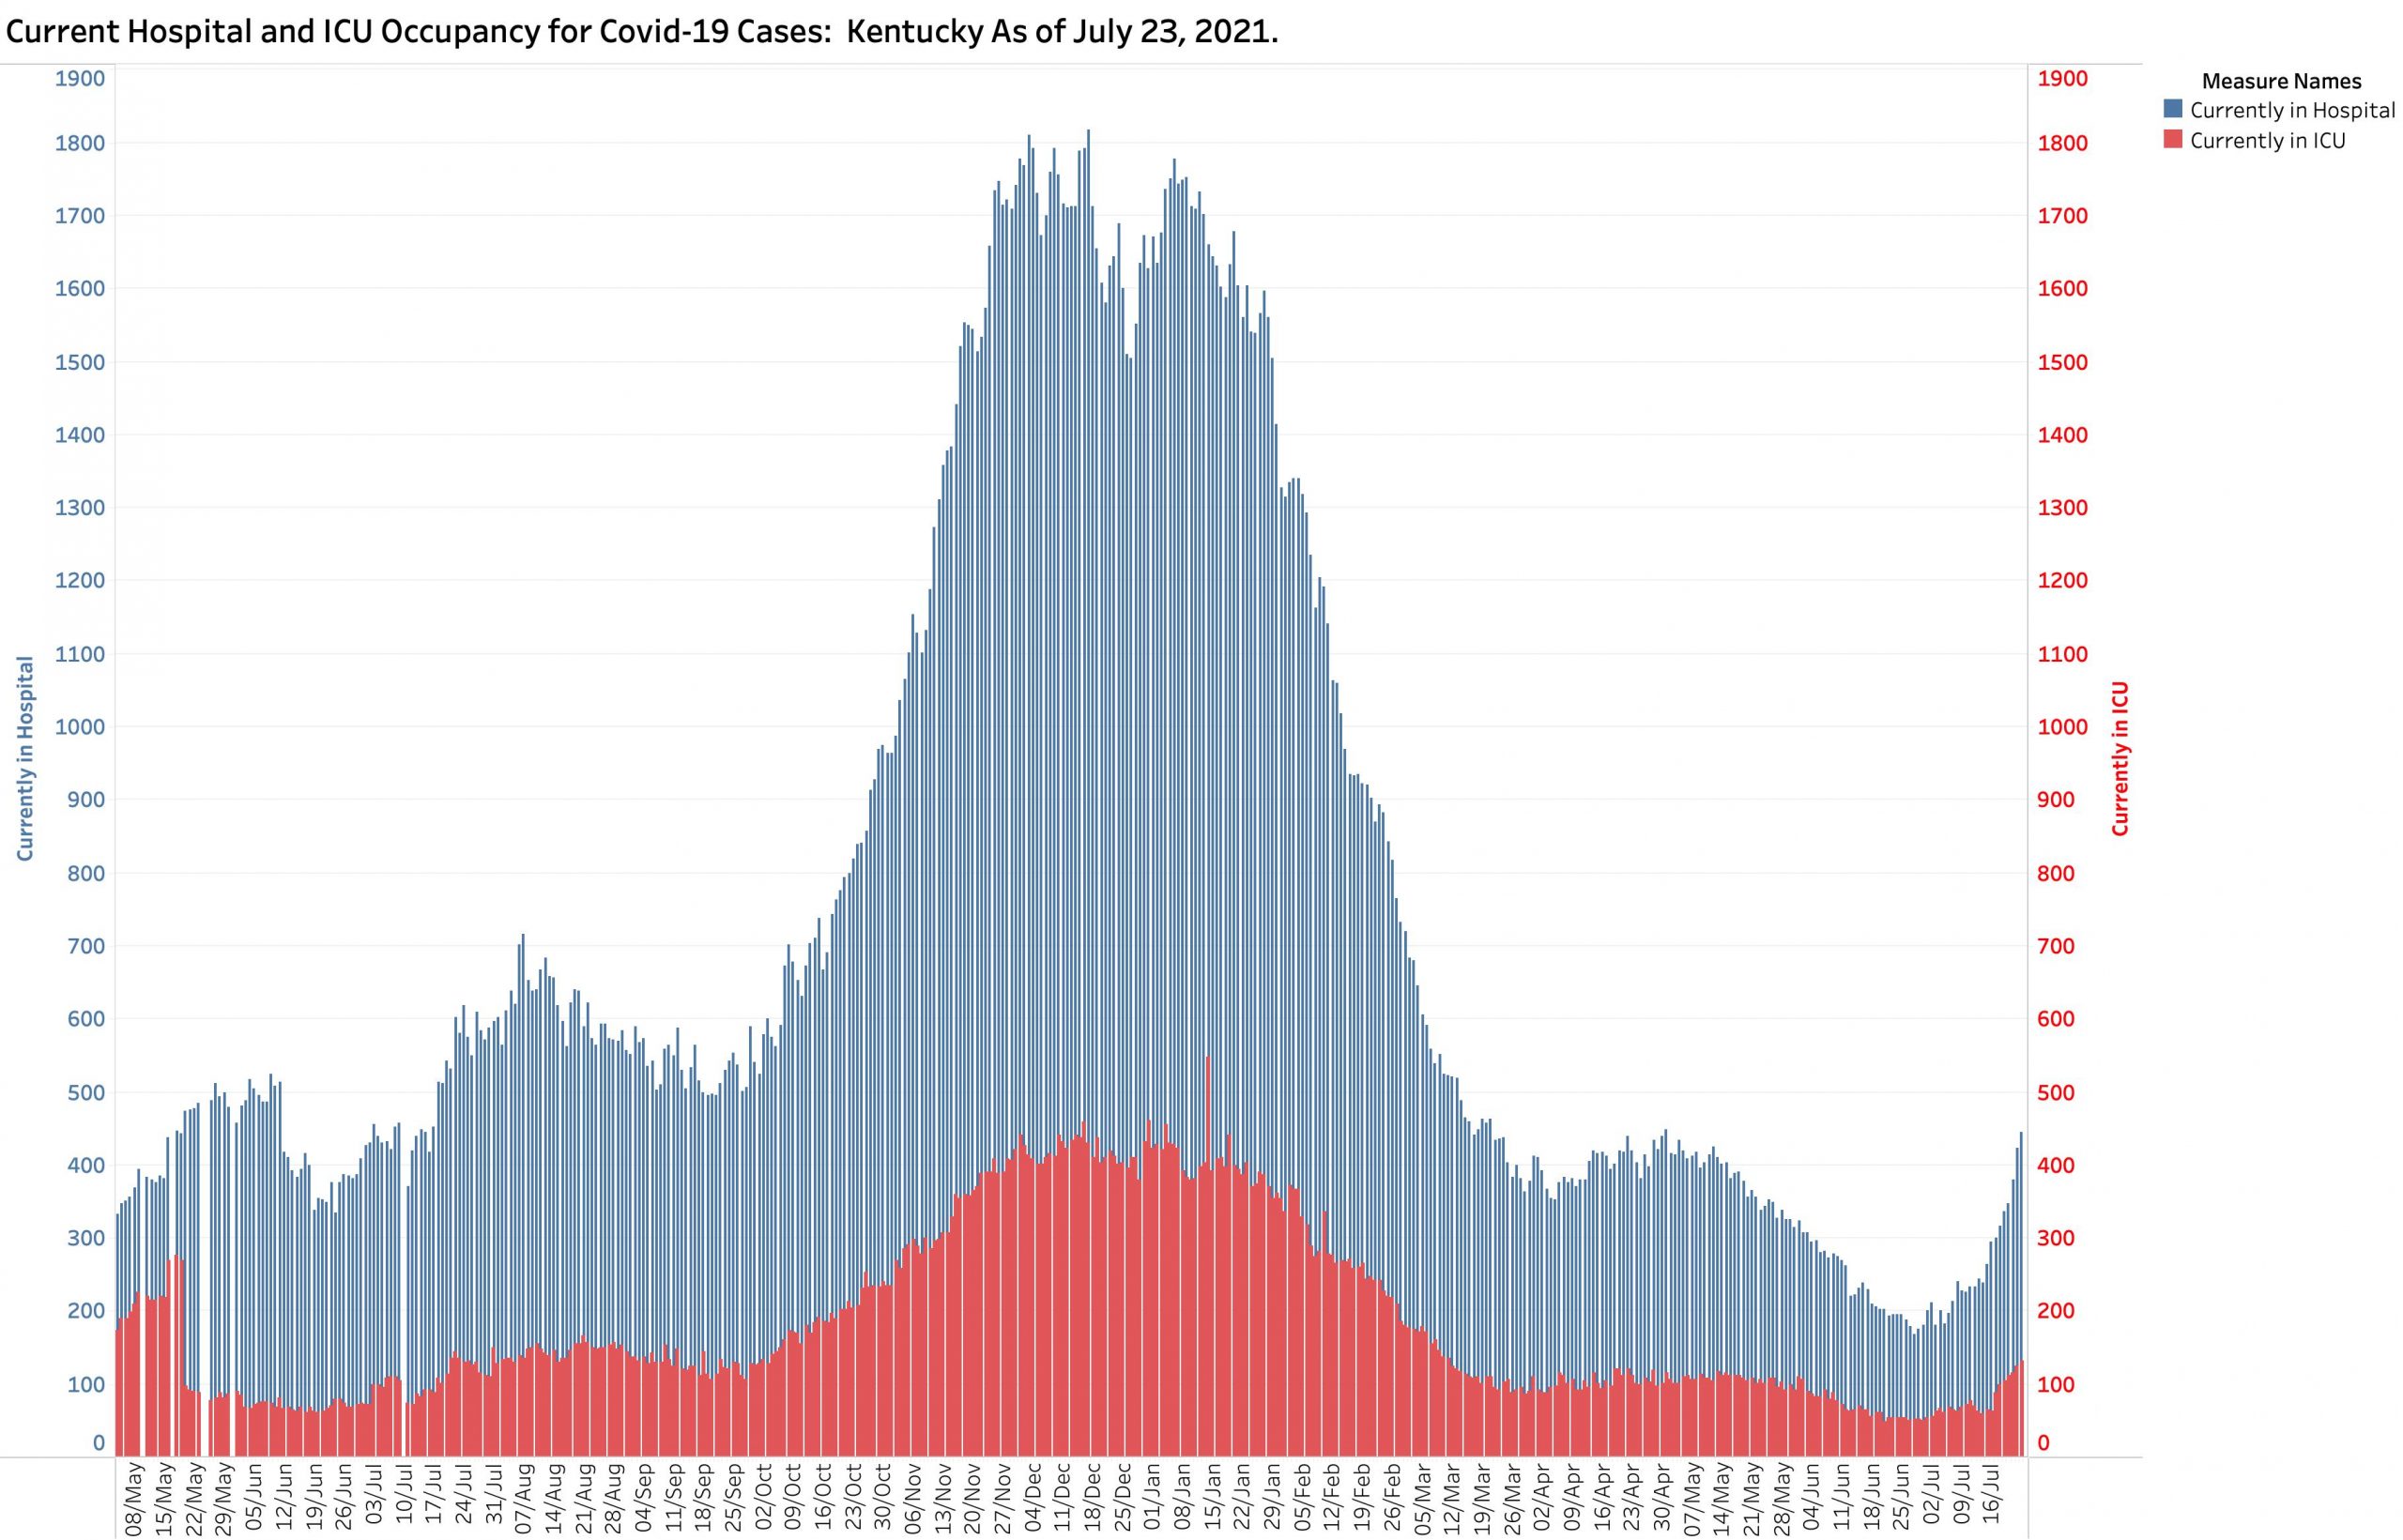
Below is KHPI’s usual graphic display of hospital and ICU census statewide. Censuses for both categories are unmistakably going up. Anecdotal reports from physician friends suggest things are worse. Note too that the majority of hospital beds are located in counties with larger populations. The new case rates in smaller counties of Kentucky with lower vaccination rates is now where the disease action putting more pressure on smaller hospitals or in counties where there is no hospital all! A few US states have currently reached full capacity. We do not want to be there.
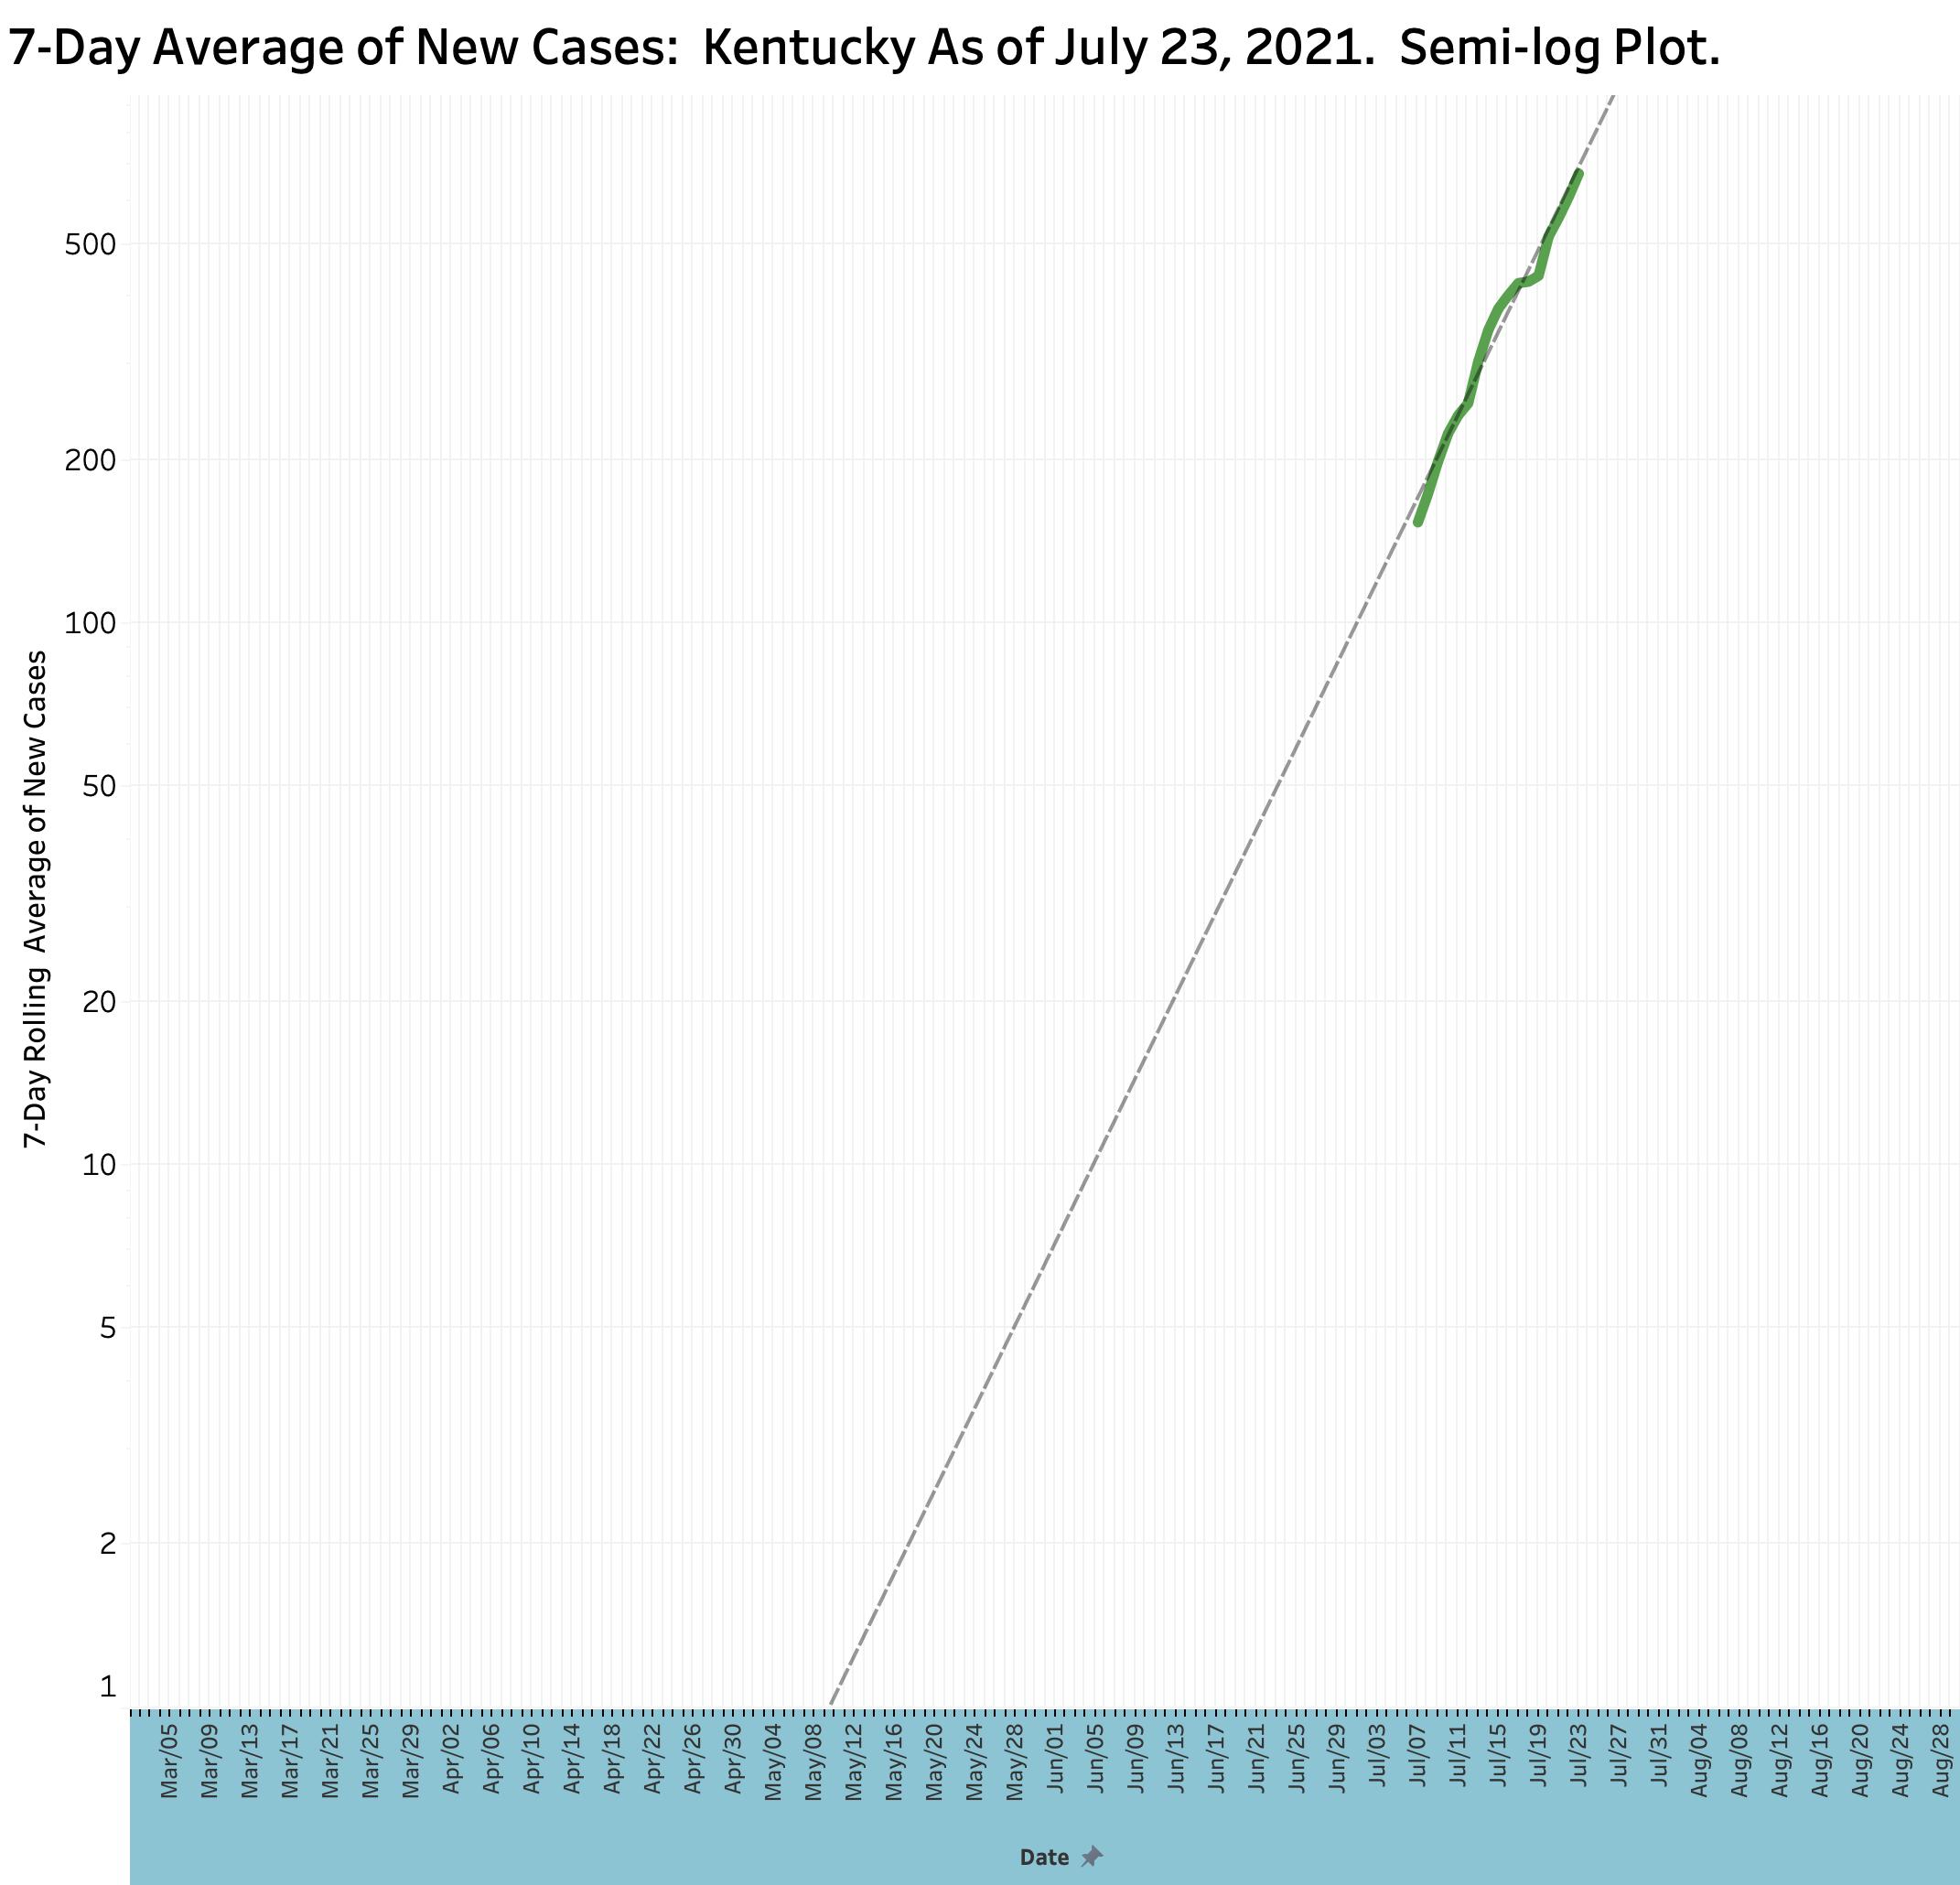
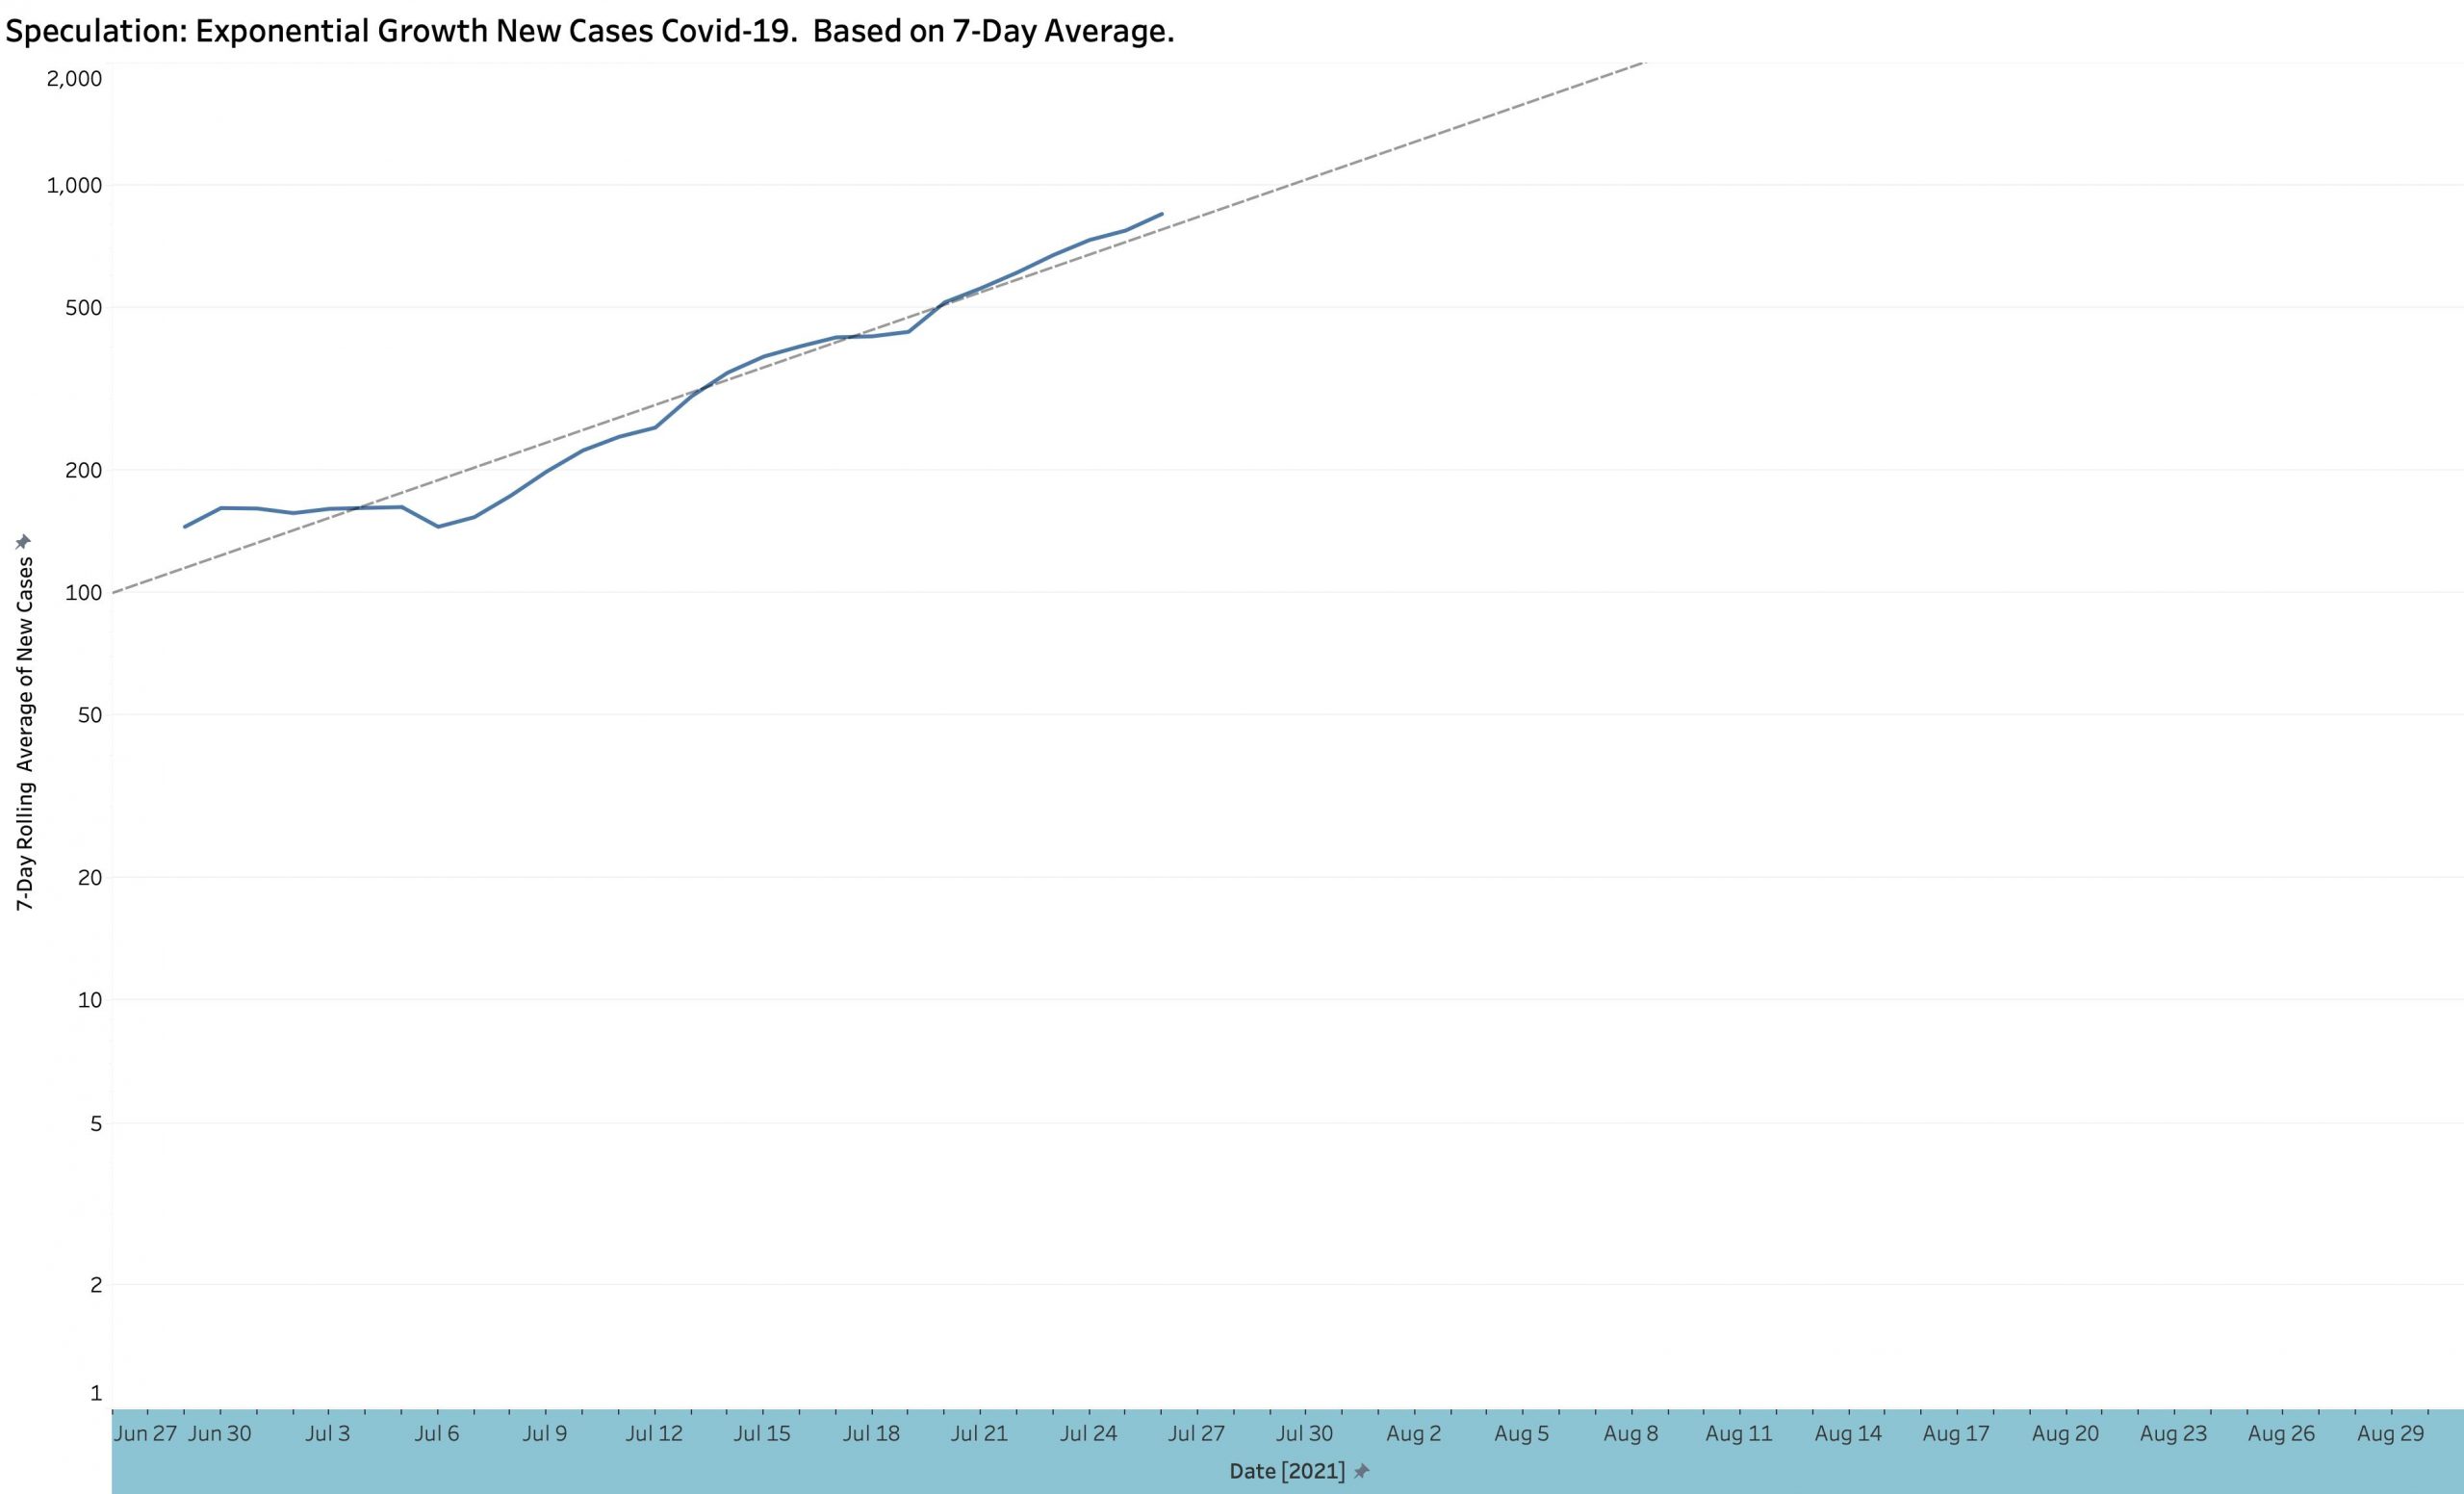
We are experiencing exponential expansion of the epidemic! These last slides depict the 7-day rolling average of new cases over time using a semi-log plot. Note that the left-hand axis in not linear, but logarithmic. This gives an advantage of allowing both small and large numbers to be displayed on the same graph. In addition, as has been explained before these pages, if the plotted points conform to a straight line in a semi-log plot against time, that the curve is rising exponentially. Ideally, raw unaveraged daily case counts should be plotted but day-to-day counts vary greatly including days with no reports at all. My best analysis of 7- and 14- day averages, raw case counts, and weekly counts suggest a doubling of every 10 days or so. Since July 1, The Test Positivity Rate has been doubling about every 10-12 days. These are not good signs in my view! If nothing else changes, we could be back in the thousands of case per day by the end of August.
What is driving these surges? A new strain of Coronavirus, names Delta has rapidly become the predominant strain in Americas and globally. It is thought to be at least twice as infective as earlier strains and seems to cause more significant disease. The vast majority of individuals getting sick with Covid-19 today are unvaccinated. Existing vaccines obviously still work but continued vigilant studies will be ongoing including the need for booster shots. Younger people continue to make up the most rapidly expanding age group with symptomatic or worse infections.
Certainly, there are non-viral reasons why we are entering a new epidemic wave. Public health measures have been relaxed. Hot weather puts people back indoors. Large-scale public events are coing back. Epidemic fatigue and a desire for the good old days drives the behavior of many. Surely the major factor involved is the fact that large segments of the population in Kentucky remain unvaccinated for whatever reason, including personal or political choice. For them, the epidemic is starting all over again where they live, work, play, or go to school. They will take their contagion with them wherever they go and keep the epidemic cooking.
Can we do anything about the firestorm that is coming? Recommendations about renewed emphasis on mask wearing have been made by Kentucky’s public health officials. Mandates about mask wearing have not been made because it is assumed that even this mild government requirement would not be effective because mandates will not be followed! I suspect armed insurrection is also a legitimate concern.
Our public health officials nationally and in Kentucky make the rational and defendable point that with the availability of vaccination against Covid-19 available in America, that we could stop the epidemic largely in its tracks. (People in less developed countries wish they had this option at all!) A reasonable person might ask the question that if vaccination is so effective and acceptably safe, why is it not being mandated just as immunizations for school are mandated? I recently read that a few bats were found around Jefferson County that had rabies. I learned that all dog and cat owners in the county were mandated to have their pets immunized against rabies in order to protect the health and safety of our human residents. What will it take to apply a parallel decision for us humans to “promote the general Welfare” against epidemic diseases? That is a discussion that exceeds the space in this article. My fear, and frankly my prediction is that Covid-19 will again have its way with us and things will get a lot worse– real fast. One can only hope that as a community we come to our senses sooner rather than later and recognize the reciprocal obligations we have to each other, individually and through our government.
Peter Hasselbacher, MD Emeritus Professor of Medicine, UofL President, KHPI July 23, 2021
The full current portfolio of KHPI’s data visualizations is available on Tableau Public. These interactive graphics enable the user to select ranges of dates or otherwise focus on selective data.
Addendum 27 July 2021: As of yesterday evening’s state Covid updates for the previous three weekend and Monday days, it is clear that Kentucky’s explosive, indeed exponential surge of its epidemic continues unabated. This is true of new cases, hospital and ICU utilization, and Test Positivity Rate. The total daily number of new tests and deaths remain stable. At the current rate of epidemic expansion, unless public behaviors or something else changes, we will hit a 7-day average of 1000 new cases per day by August 1 and 2000 cases by August 10th or so. (Raw new-case counts will reach these levels days before the 7-day average.) Peter Hasselbacher, MD
As we approach the end of this pre-Derby Week and a change of seasons, the best we can say about the status of Kentucky’s Covid-19 epidemic is that our rapid decline of new cases has ended and that our case and hospital utilization rates have “plateaued” –albeit at levels well above last Summer’s or before last Fall’s epidemiologic explosion. Of concern are early hints of renewed epidemiologic expansion. Daily new case numbers and Kentucky’s calculated Test Positivity Rate are both inching up. The 7-Day average new case number is beginning to peek above the 14-Day curve– another hint of epidemic expansion. With two reporting days left this week, we are on track to match the 4000-plus weekly case numbers of mid-March. Kentucky’s current situation largely mirrors the national situation, but we are in a better place than states and regions where the Covid-conflagration has reignited. Our vaccination programs are going well and from my person-on-the-street perspective, much self-imposed masking and social distancing practices can be seen. In my opinion however, we remain vulnerable to things we cannot control– or choose not to.
Kentucky still contains viral hotspots as judged by national criteria. New cases arise throughout the state ready to breakout again. The more contagious viral mutations roam freely among us. We are travelling and encouraging out-of-state visitors again. The fact that no vaccine or disease treatment is perfect, permanent, or risk free is likely to interrupt vaccine administration programs for those who would benefit most– and that indirectly includes all of us! We are all tired of the restrictions the virus has imposed on our lives which have impoverished us both emotionally and financially. Many of us are in denial or have given up trying to do what history and science tells us is effective to bring the current plague under acceptable control. We continue to have unacceptable differences in access to the healthcare and social support necessary to maintain social cohesion and justice necessary to maintain the health of the body politic.
Where we go from here is indeterminable. We will only know when we get there. When I was asked last week if I thought it was safe to run a proper Kentucky Derby, I did not have a supportable answer one way or the other. It was and remains my opinion that another disease “surge” is more likely than not. More to the point, we lack the tools or surveillance structure to demonstrate that a given large-scale event is “safe” or not. If cases flair again, how do we tell if it was a Derby, returning Spring vacationers, out-of-towners, new viral strains, or anything else? Certainly other large-scale events are still being postponed.
My belief is that we should continue on our present course and that it is very premature to let our full guard down. I agree with incremental steps. I could even support more mandatory vaccinations or other requirements for full participation in societal events such as school or employment. I cannot find fault with the recent CDC decision to take a close look at a rare complication of the Johnson & Johnson (Janssen) and AstraZeneca vaccines. Nothing we do in medicine, public health, or living together is absolutely risk free. It is only a matter of justice and social cohesion that we share that unavoidable risk of being alive.
I updated KHPI’s tracking data on the Tableau Public website as of April 15 for your inspection.
Peter Hasselbacher, MD Kentucky Health Policy Institute April 16, 2021
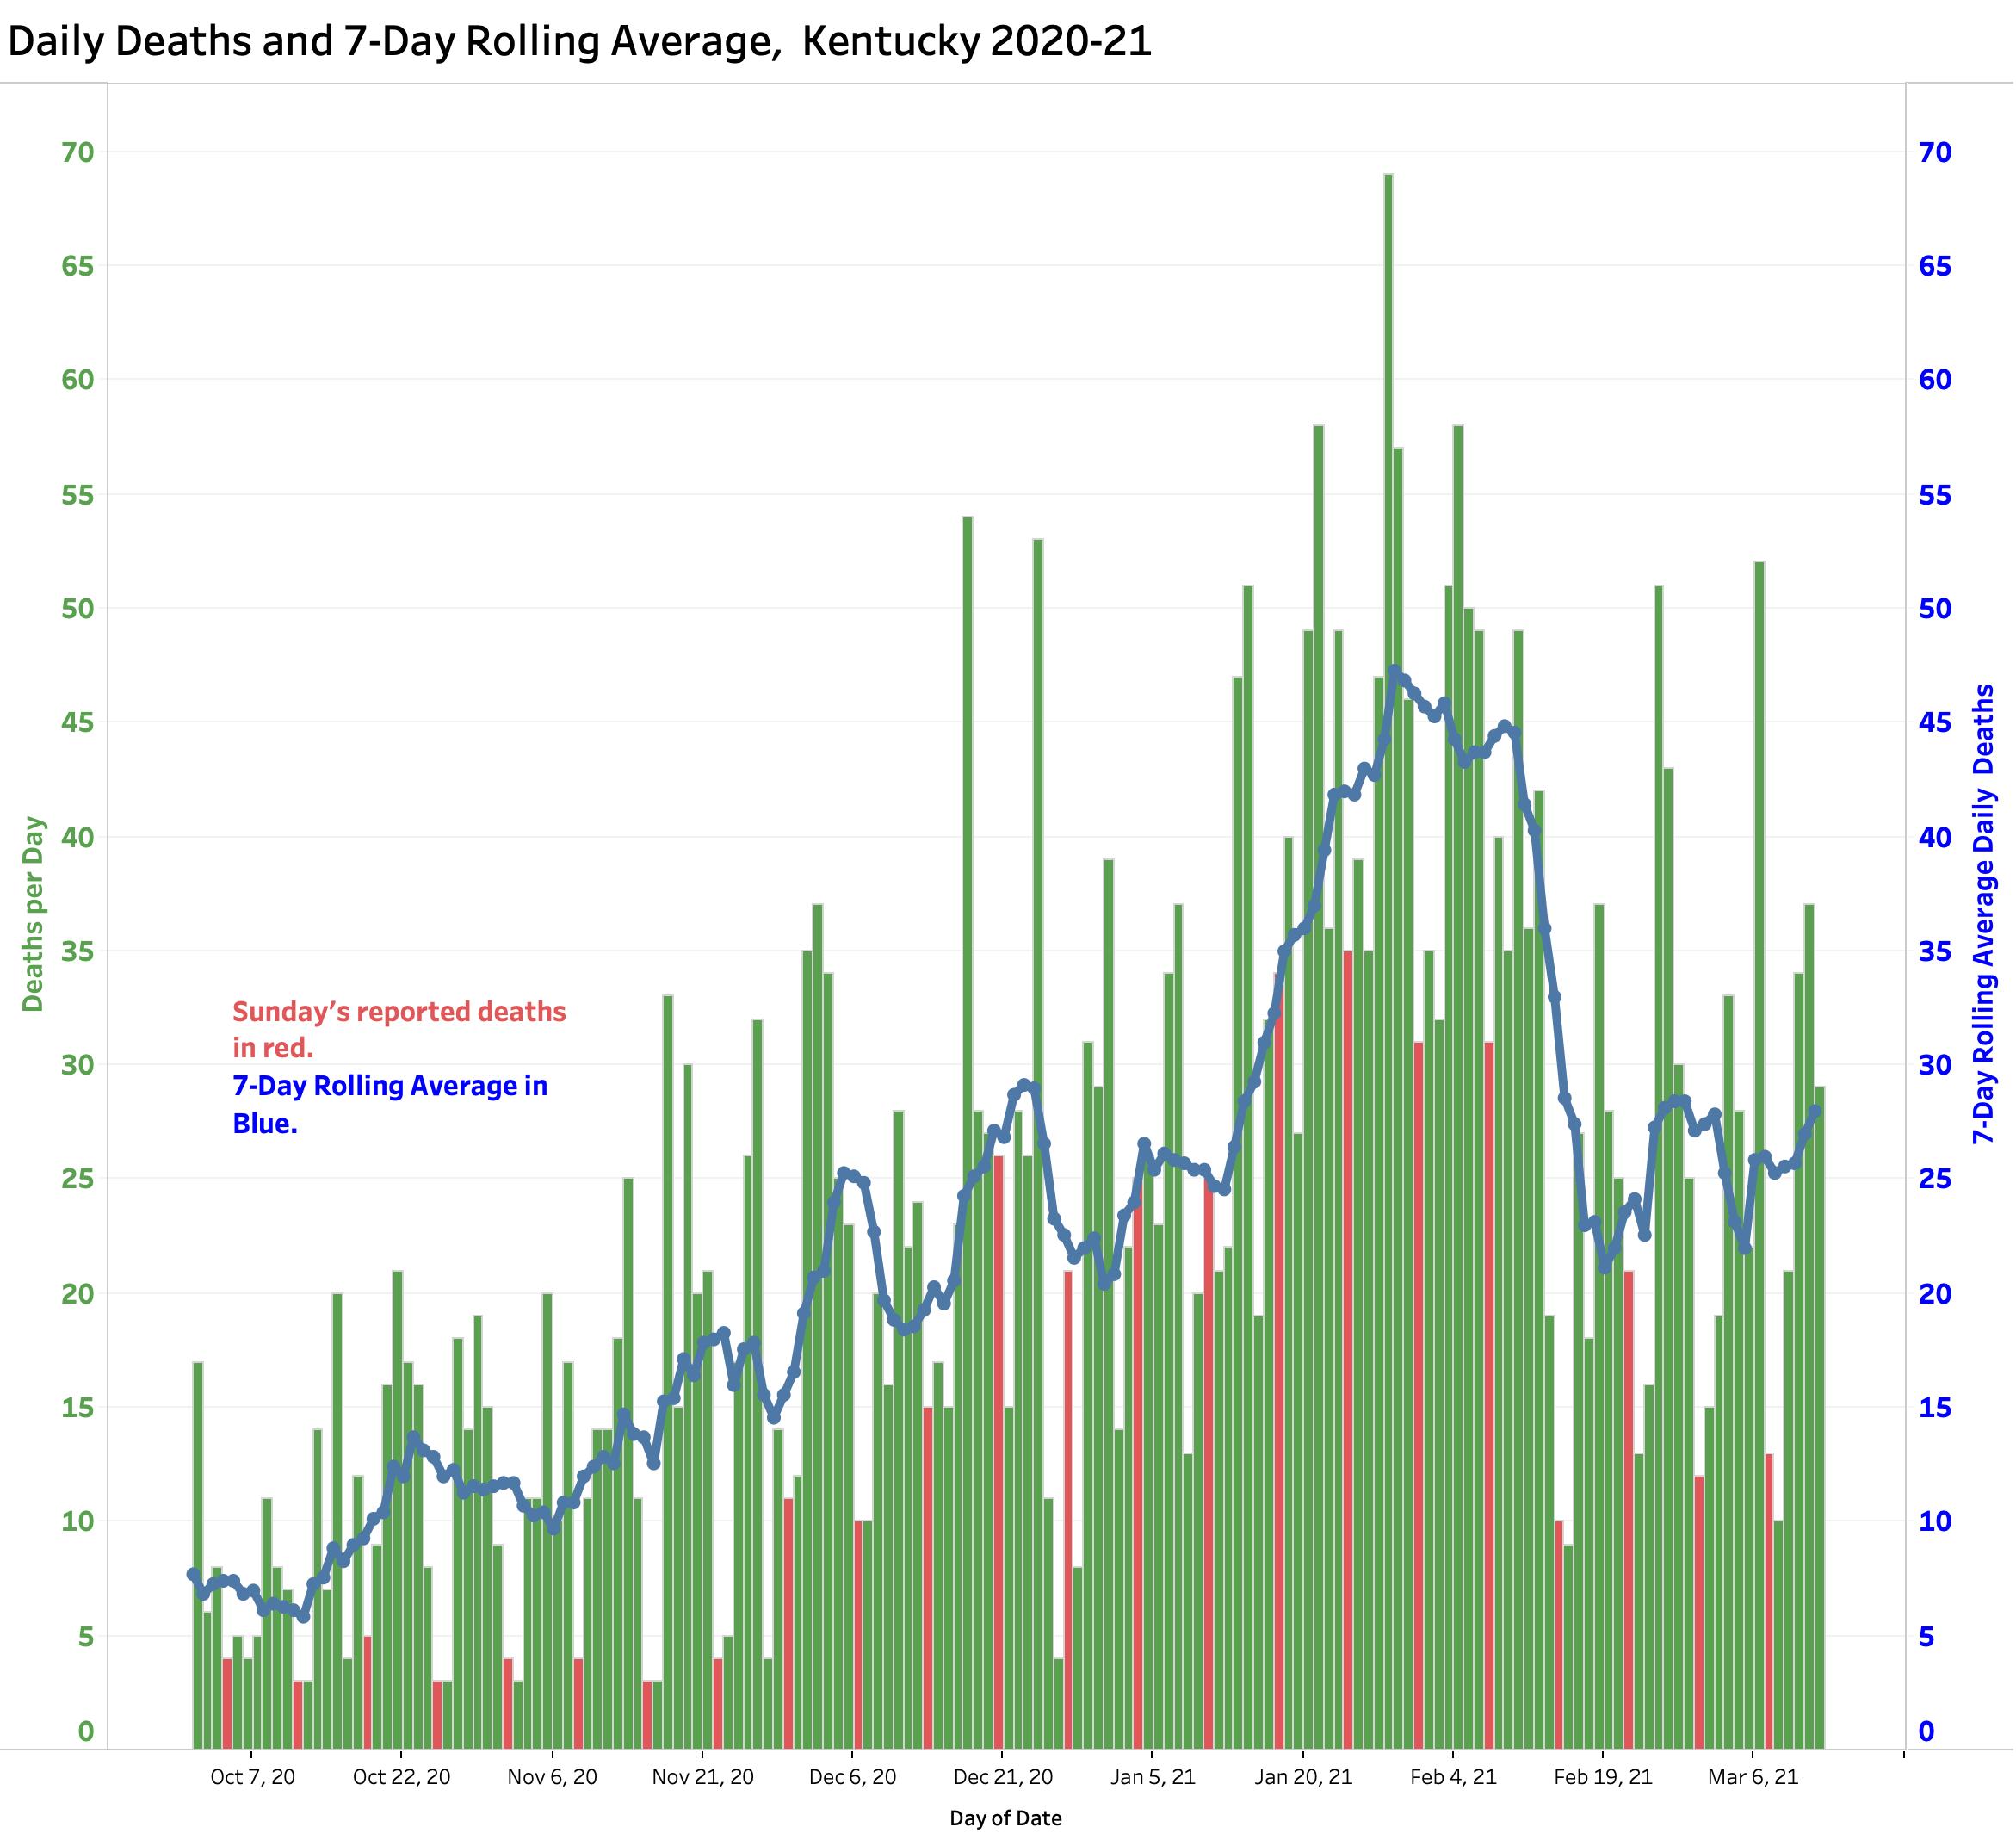
New cases declining sharply, but reported daily deaths remain at a high plateau if not increasing.
New Cases. Since its peak in the second week in January, the number of reported daily new cases of Covid-19 has been falling dramatically. There is still much variation in daily counts, but yesterday’s 7-Day rolling average of 821 cases rolls us back to the numbers of early October 2020, just before the massive midwinter surge of the epidemic. Weekly case counts have been dropping for the last 9 consecutive weeks. The drop in new cases has been accompanied by decreases of comparable magnitude in utilization of hospital and ICU beds, and the use of mechanical ventilators. This is very good news! No doubt this sea -change can be attributed in part related to implementation of vaccinations for the elderly and high risk, but my guess is that the community of Kentucky finally got scared enough to follow national and state recommendations for non-medicinal public health practices. I certainly am seeing more people on the streets and elsewhere who are wearing masks.
Cases and Deaths. 7-Day Averages as of March 3, 2021
Deaths. The number of daily reported deaths has stalled and has actually been rising since February 19th. The current 7-Day rolling average of 29 is comparable to averages reported in mid-December. I do not believe this “failure to fall” can be attributed to the predictable time-lag between initial viral infection, illness onset, and death as the natural history of Covid-19 disease unravels. Indeed, it is clear that there have been problems identifying, adjudicating, and reporting Covid-related deaths that may have been ongoing well back into 2020. The full details of the duration and magnitude of this early underreporting are unknown to me. Any reporting gap would be superimposed on the global reality that that reported Covid deaths represent only a fraction of actual number even within good public health reporting structures.
Deaths reported daily with 7-Day Average as of 3-12-21.
How will we notice more virulent viral strains? SARS-CoV-2 is the official name of the virus that causes the disease Covid-19. Given that new, more infectious, and probably even more deadly strains of this SARS relative are now spreading globally and in Kentucky, we need to be confident that we have accurate and timely handles on the numbers of new cases and deaths to guide both our individual and community behaviors. If there are mismatches between cases, hospital utilization, and deaths, we need to understand why. As European nations currently enforce new restrictions and even lockdowns, the stakes for us are as high as ever.
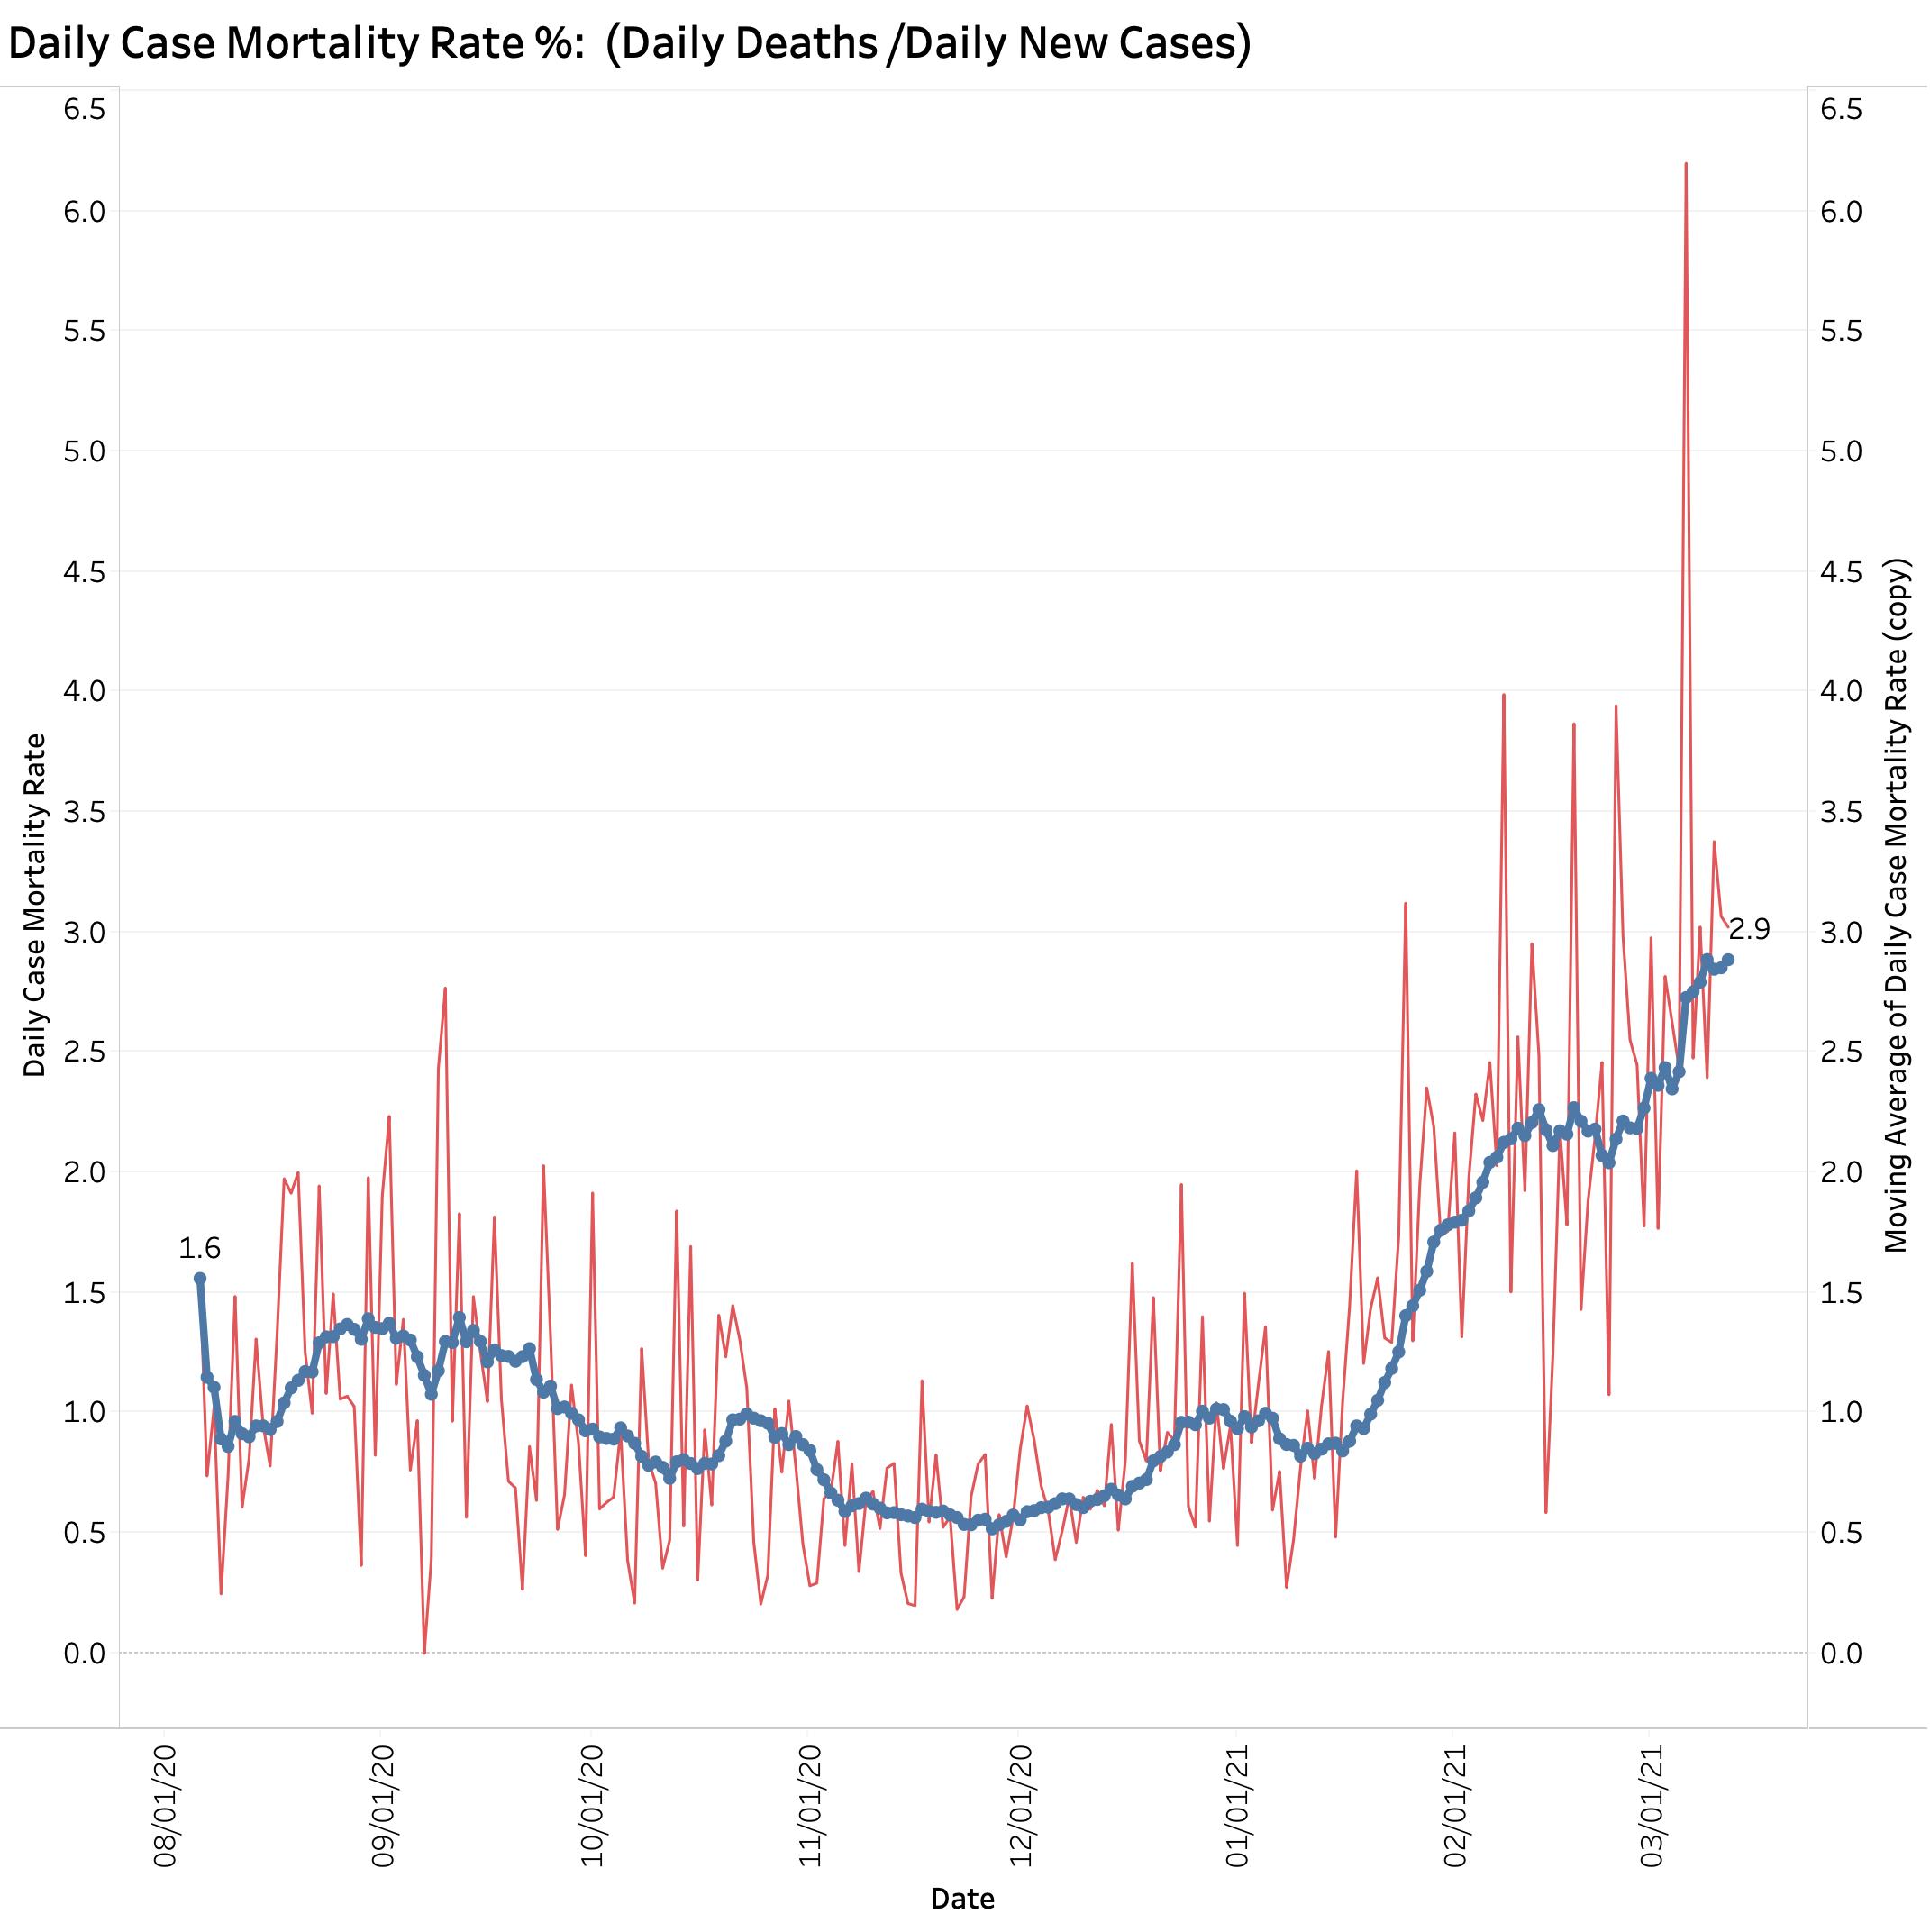
What is happening to case-mortality rates? From the earliest days of Kentucky’s epidemic I plotted a traditional epidemiological measure of observed case fatality rate (CFR) using aggregate numbers. (This is not the same as a “disease fatality rate” which will only become fully apparent as the epidemic runs its fuller course.) Using the raw total number of cases and deaths announced daily by Frankfort, I divided the latter by the former to calculate the percent of recognized cases of Covid-19 that died of their disease at that point in time. In the early days of last spring when testing was limited and identifying a death was more likely than than an asymptomatic case, this simplistic calculationvaried a great deal and to high levels. On some days before July 2020, the daily CFR was higher than 14%. As testing ramped up and under the averaging pressure of larger numbers of preceding cases, the aggregate observed CFR gradually declined to a more representative 1%. I placed this plot at the end of my data visualization portfolio and rather ignored it without comment.
Last February I noticed that the aggregate CMR was starting to trend upwards puling the mass of data behind it in that direction. A rise in aggregate CFR by this measure is apparent even using a 14-Day average.
Simple calculation of case mortality rate with 14-Day average
In a setting where there may be a mismatch between cases and deaths and when new viral strains are present, I believe it is important to understand what we are looking at. This is especially true given that deaths from Covid-19 in individuals from congregate living situations is falling sharply due to programs of aggressive vaccination. Why are deaths not falling more rapidly? I currently suspect that the calculated CFR I have been using is artifactualy high due to structural issues of data collection and reporting. Such issues are not unknown in America’s public health systems. An alternative to being an artifact of data collection and reporting might be that our brand of Covid-19 disease is expressing itself with greater virulence or mortality rate. There is concern that this latter is happening in other countries. We need to know if this is the case here at home. I do not have access to Kentucky-specific data to speculate further.
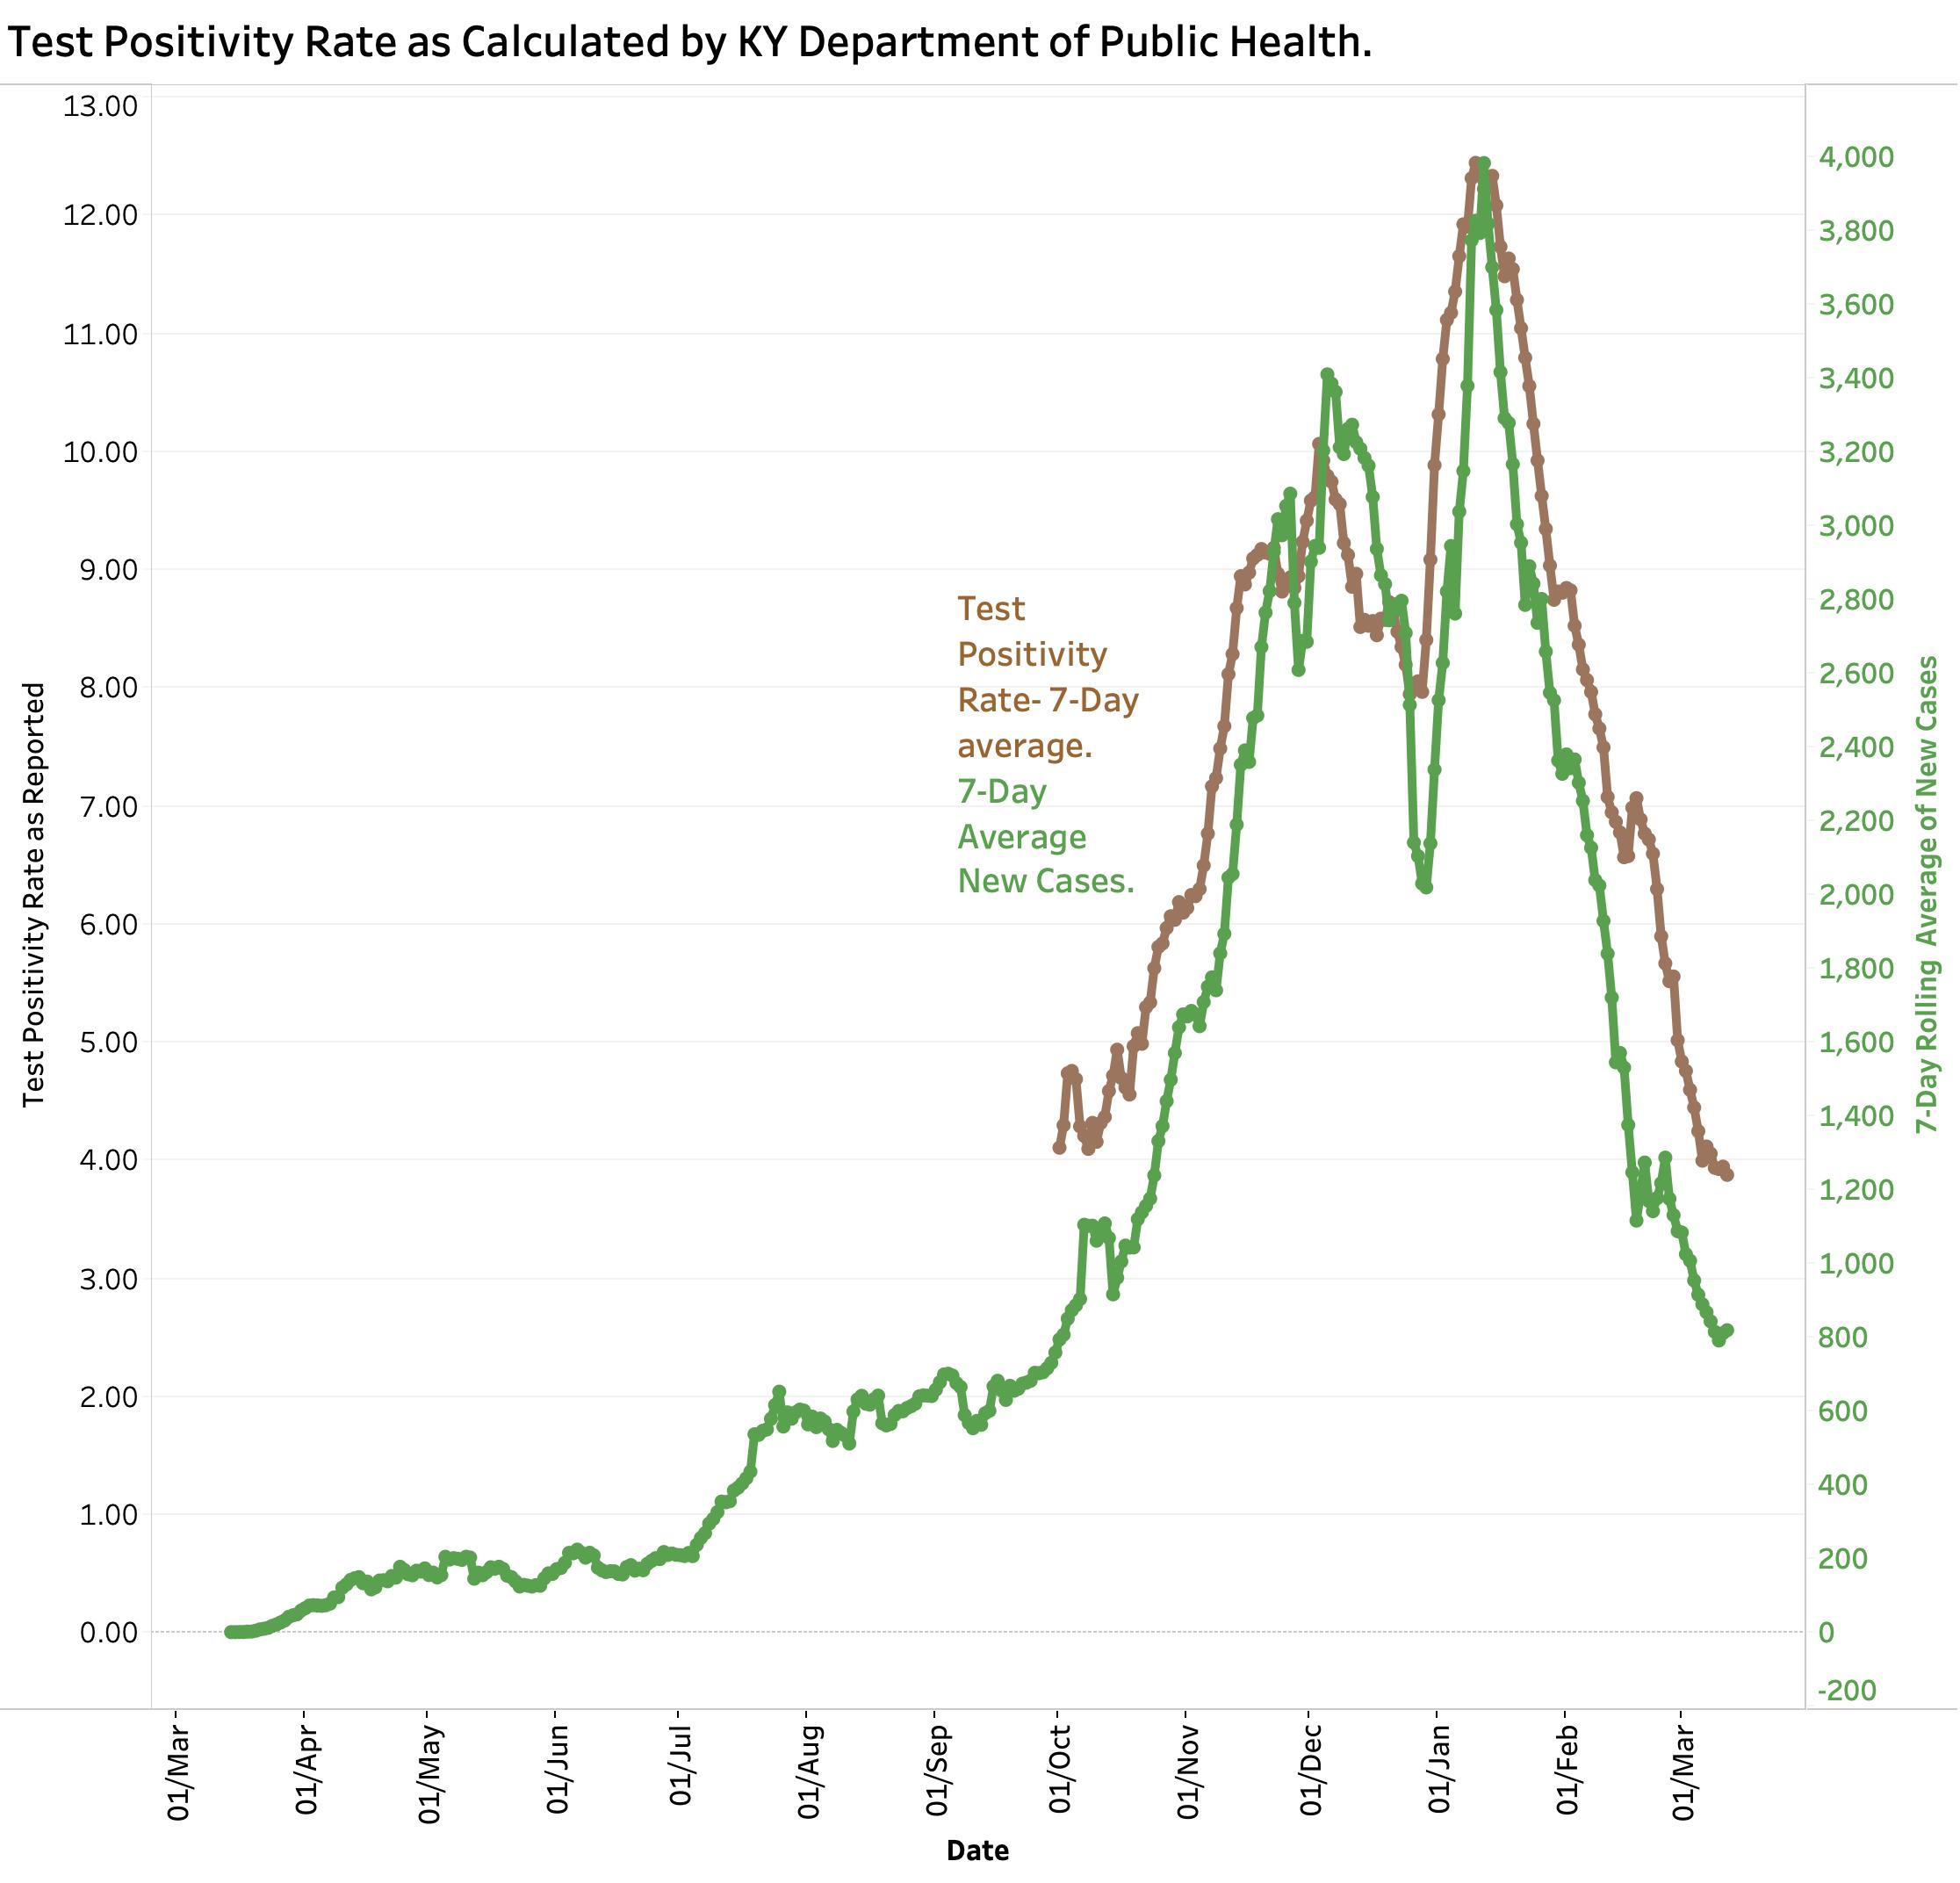
Does Kentucky’s version of Test Positivity Rate help us? Yesterday’s reported 7-Day average Test Positivity Rate of 3.88% was the lowest seen yet. That seems reassuring on the face of it! This number is one of those being used to guide the relaxing of restrictive public health measures in in Kentucky and has been advanced as a way of judging that the number of tests being performed is adequate. Imaging my surprise then when Becker’s Hospital Review on March 10 using “authoritative” data from Johns Hopkins Coronavirus Resource Center ranked Kentucky as 11th highest in the nation with a “Covid-19 Test Positivity Rate” of 9.5! (For comparison, the rate for North Carolina was lowest at 1.1, Kansas was highest at 28.6, and adjacent Indiana was 2.5.) I am not going to try to repeat the analysis. I have considerable doubts that the reports aggregated from individual states are strictly comparable. I maintain that the CDC should have the responsibility to ensure that data are collected and reported using the same definitions and procedures and that this data is made available to all interested parties.
If Kentucky’s Test Positivity Rate is calculated on a daily basis using total new tests (including both PCR-RNA and antigen tests) the result is chaotic to a degree much greater than for daily cases or deaths. Some sort of averaging is essential, but probably not sufficient. Serial testing of the same individuals is occurring in some settings such as schools and workplaces. The proportion of RNA and antigen testing varies. We have seen backlogs of test reporting and even negative corrections entered into the state’s reports. I personally experienced a breakdown in the electronic reporting system of a major test vendor to the state when I was tested. Test numbers are no longer even reported on Sundays. To be able to extract some sense from the volatility of the numbers the state rationally settled on a more predictable calculation that includes only PCR-RNA tests (from respiratory tract swabs?) and only those results that are reported to the state electronically. This parameter is reported as a rolling 7-Day Average and is plotted serially here along with 7-Day average of new cases.
Tests Positivity Rates as callculated by KDPH and new cases as of 3-12-21.
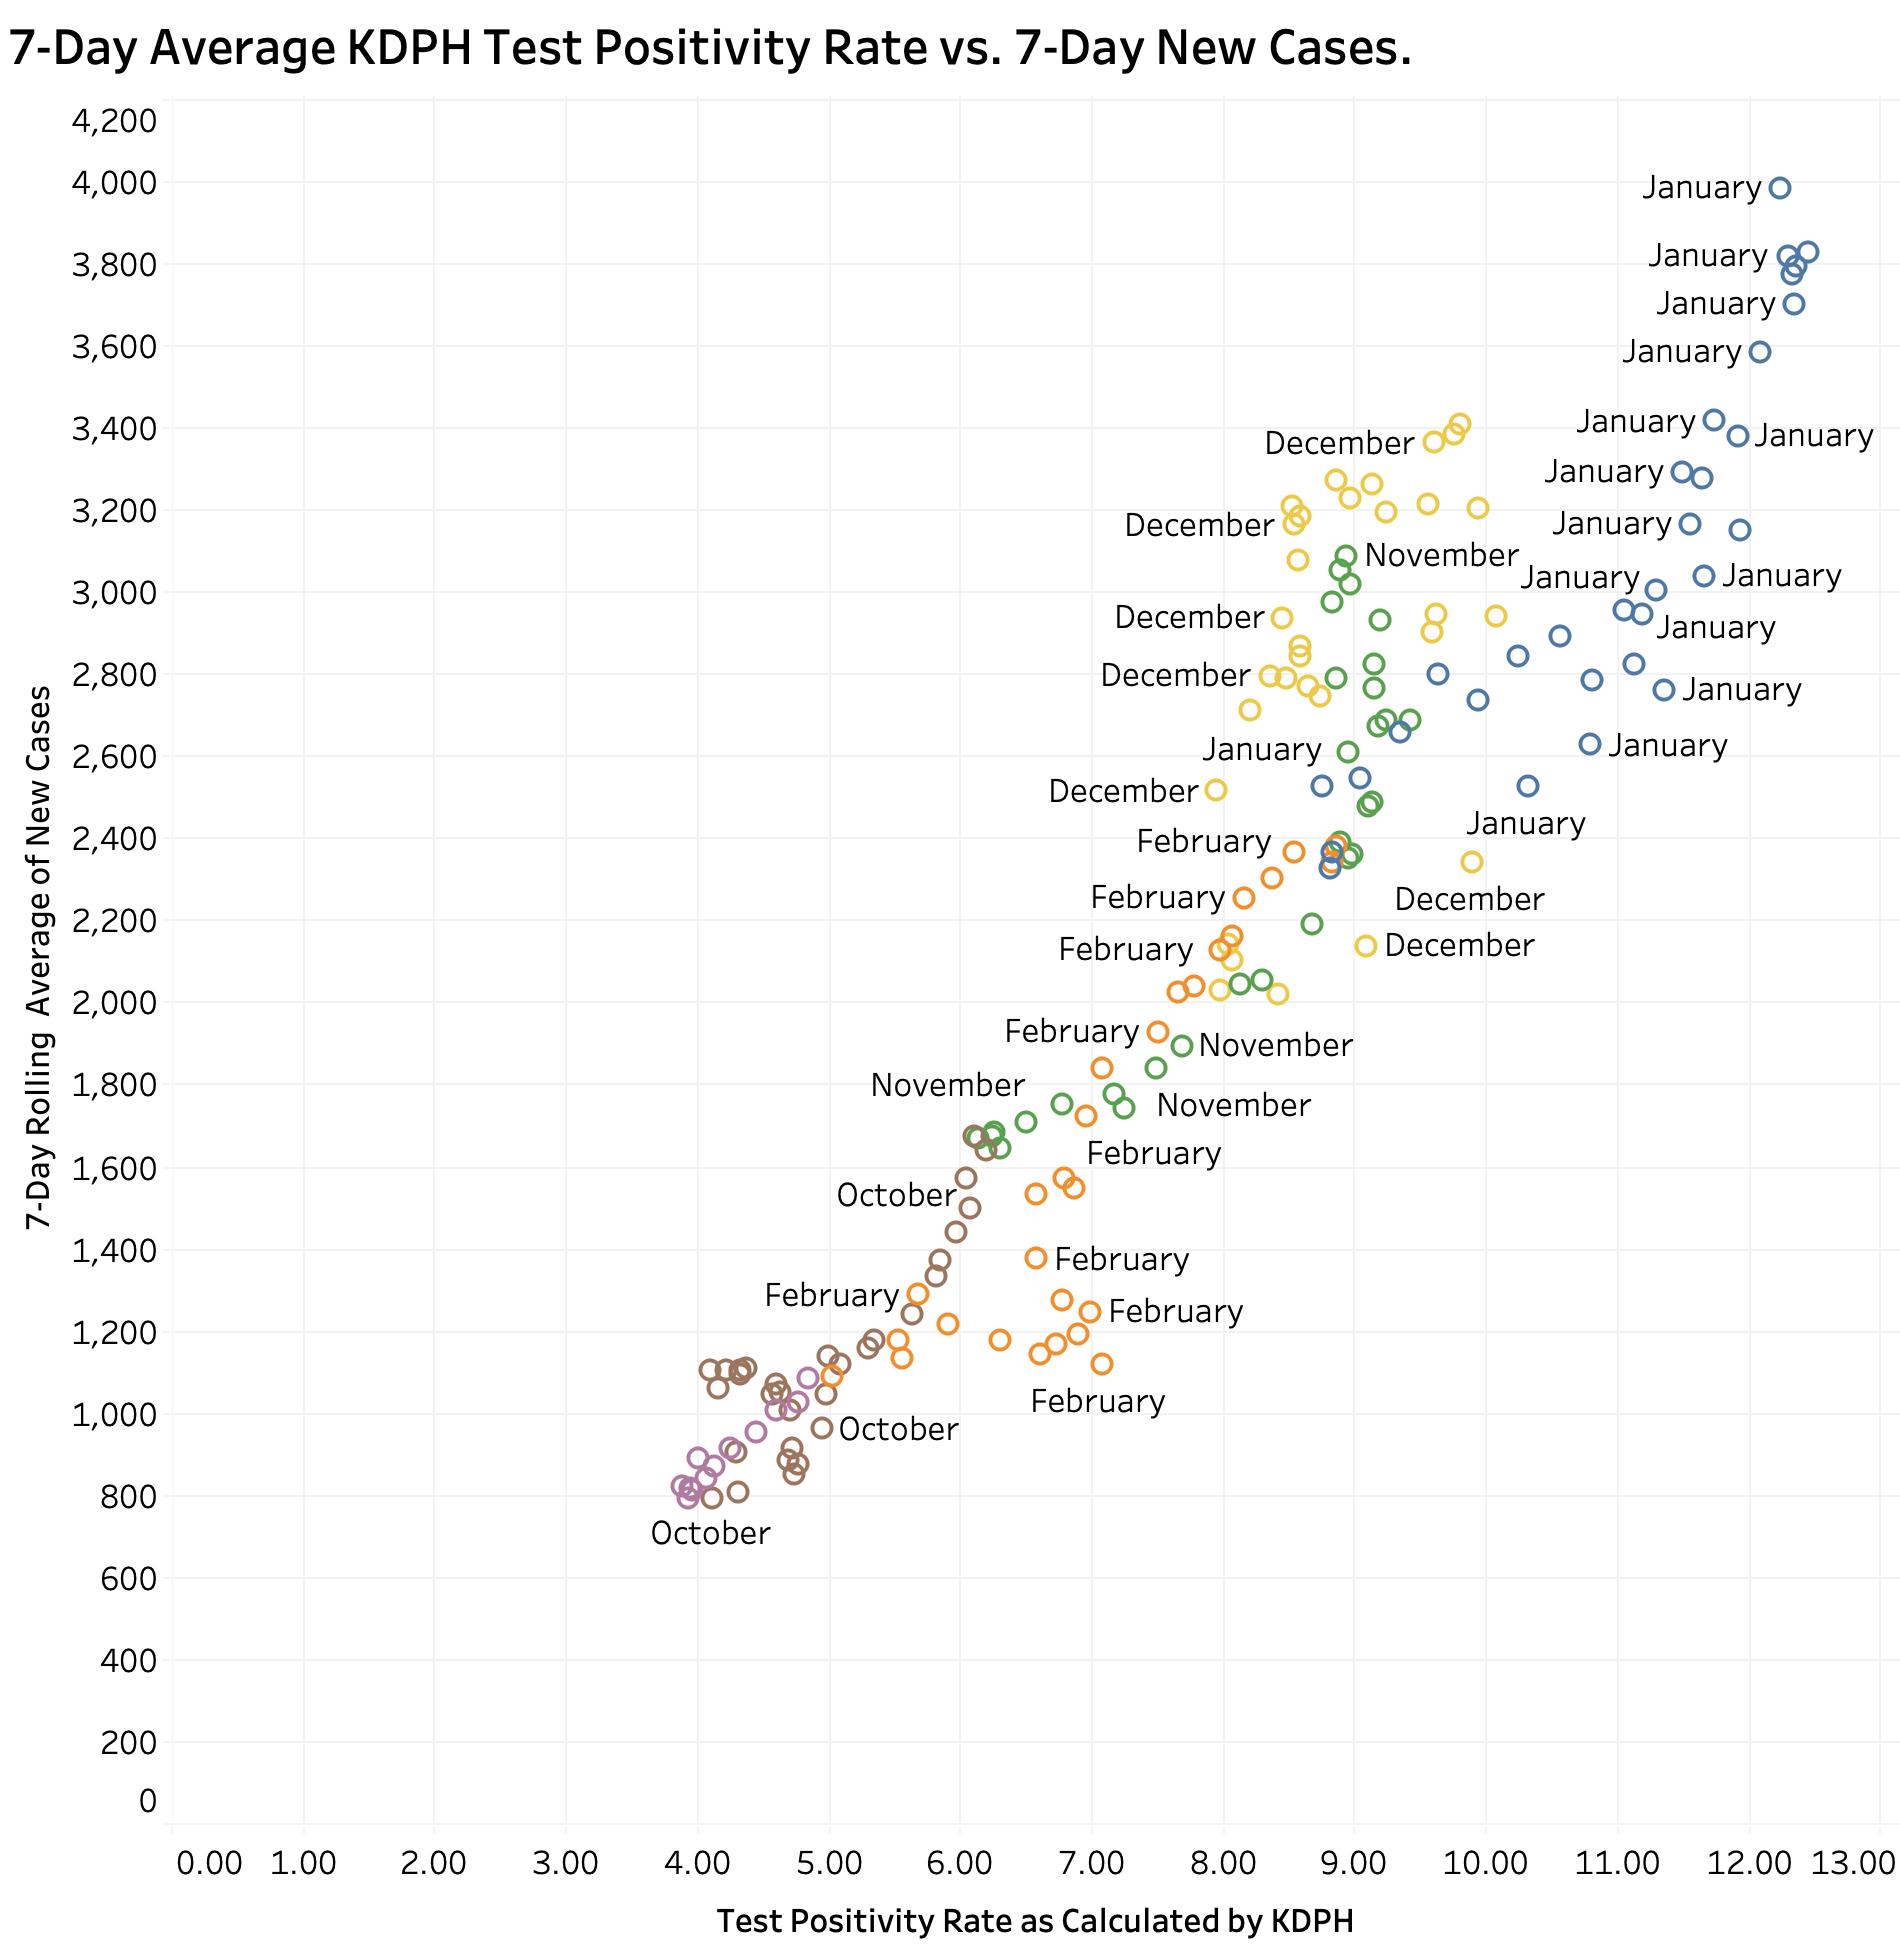
The question I would raise is what does this number tell us that the raw number of new cases does not, especially since a “case” is defined by a positive test. We expect the two to correlate. (Complicating the matter is that the number of reported total tests has been decreasing.) If the 7-Day averages of New Cases is plotted against the Test Positivity Rate (TPR) as calculated by the state, the result is a highly statistically significant correlation between the two.
Correlation of KY-calculated Test Positivity Rate and New Cases (7-Day Averages)
Both were highest in midwinter January and lowest in October and March. A similar correlation can be demonstrated between TPR and “Currently In Hospital” as reported. (These plots can be dissected by month on KHPI’s Tableau Public website.) Neither do I believe it can be conclusively said that a rising in TPR precedes new case identification. It may be that adjusting for the proportion of confirmed cases vs. probable cases, or PCR tests vs other tests might clarify their effect on test positivity ratios, but those historical data are not available to me in a usable format from the state. I still believe that our best current handle on where we are in the epidemic remains with accurate, comprehensive and timely reporting of cases and deaths with a focus on where and how those cases are acquired and the actual dates of death as opposed to the date of the report.
The over-numerous but interactive data visualizations that underlie the discussion in this series of Covid updates can be viewed here. The user can vary the range of dates displayed, the days of the weeks, and other parameters for a full year’s worth of Kentucky’s data. The pull-down menu on the left end of the header is a convenient way to navigate quickly but I also recommend clicking one’s way along the header for a sense of the internal logic of the presentations. There are other portfolios under the “My Profile” button that are relevant if not completely up to date.
I believe the state is credibly doing the best it can given the resources it inherited or became available, in the face of irresponsible political resistance, and with a less than fully-cooperative community response. We got over the mid-winter third surge because we listened better as a body-politic to more responsible state and federal public health experts. Where we go from here remains to be seen but it is not over yet.
Peter Hasselbacher, MD Emeritus Professor of Medicine, UofL 12 March 2021