It’s January all over again in August– except for the temperature!
Tuesday’s New Case, Test Positivity Rate, and Hospital data continue their sharp rises equaling or exceeding the worst days of the epidemic in January. There are no reliable signs of things slowing down.
New Cases. The number of new cases reported yesterday was 4,638. Of these,29% were in children and teenagers 18 and under. This was by far the highest number of Tuesday cases since the beginning of the epidemic, higher even than the 4,127 cases reported last December 1. Similarly, Monday’s new case count of 2,596 was the highest ever for that day. The counts of the previous Thursday, Saturday, and Friday were in the range of the worst of last winter’s surge.
Without further changes in public behaviors, at this rate of epidemic expansion, Kentucky can hit 10,000 new cases per day by the end of August.
Yesterday, Friday August 13, there were 4009 new cases of Covid-19 reported in Kentucky. The last time more than 4000 cases were reported was January 14 when we were still in the worst of Covid times of the Commonwealth. The highest daily report of new cases to date was 5705 on January 6. Review of daily case reports, test positivity rates (TPR) and Covid-19 hospital utilization all reveal that we are circling back from the lowest indicators of epidemic activity back to the highest in a matter of only 6 weeks.
The usual displays of daily, weekly, and monthly cases, deaths, and tests are available on KHPI’s Tableau website. Below are three different data visualizations that show were we have been, and where we appear to be going.
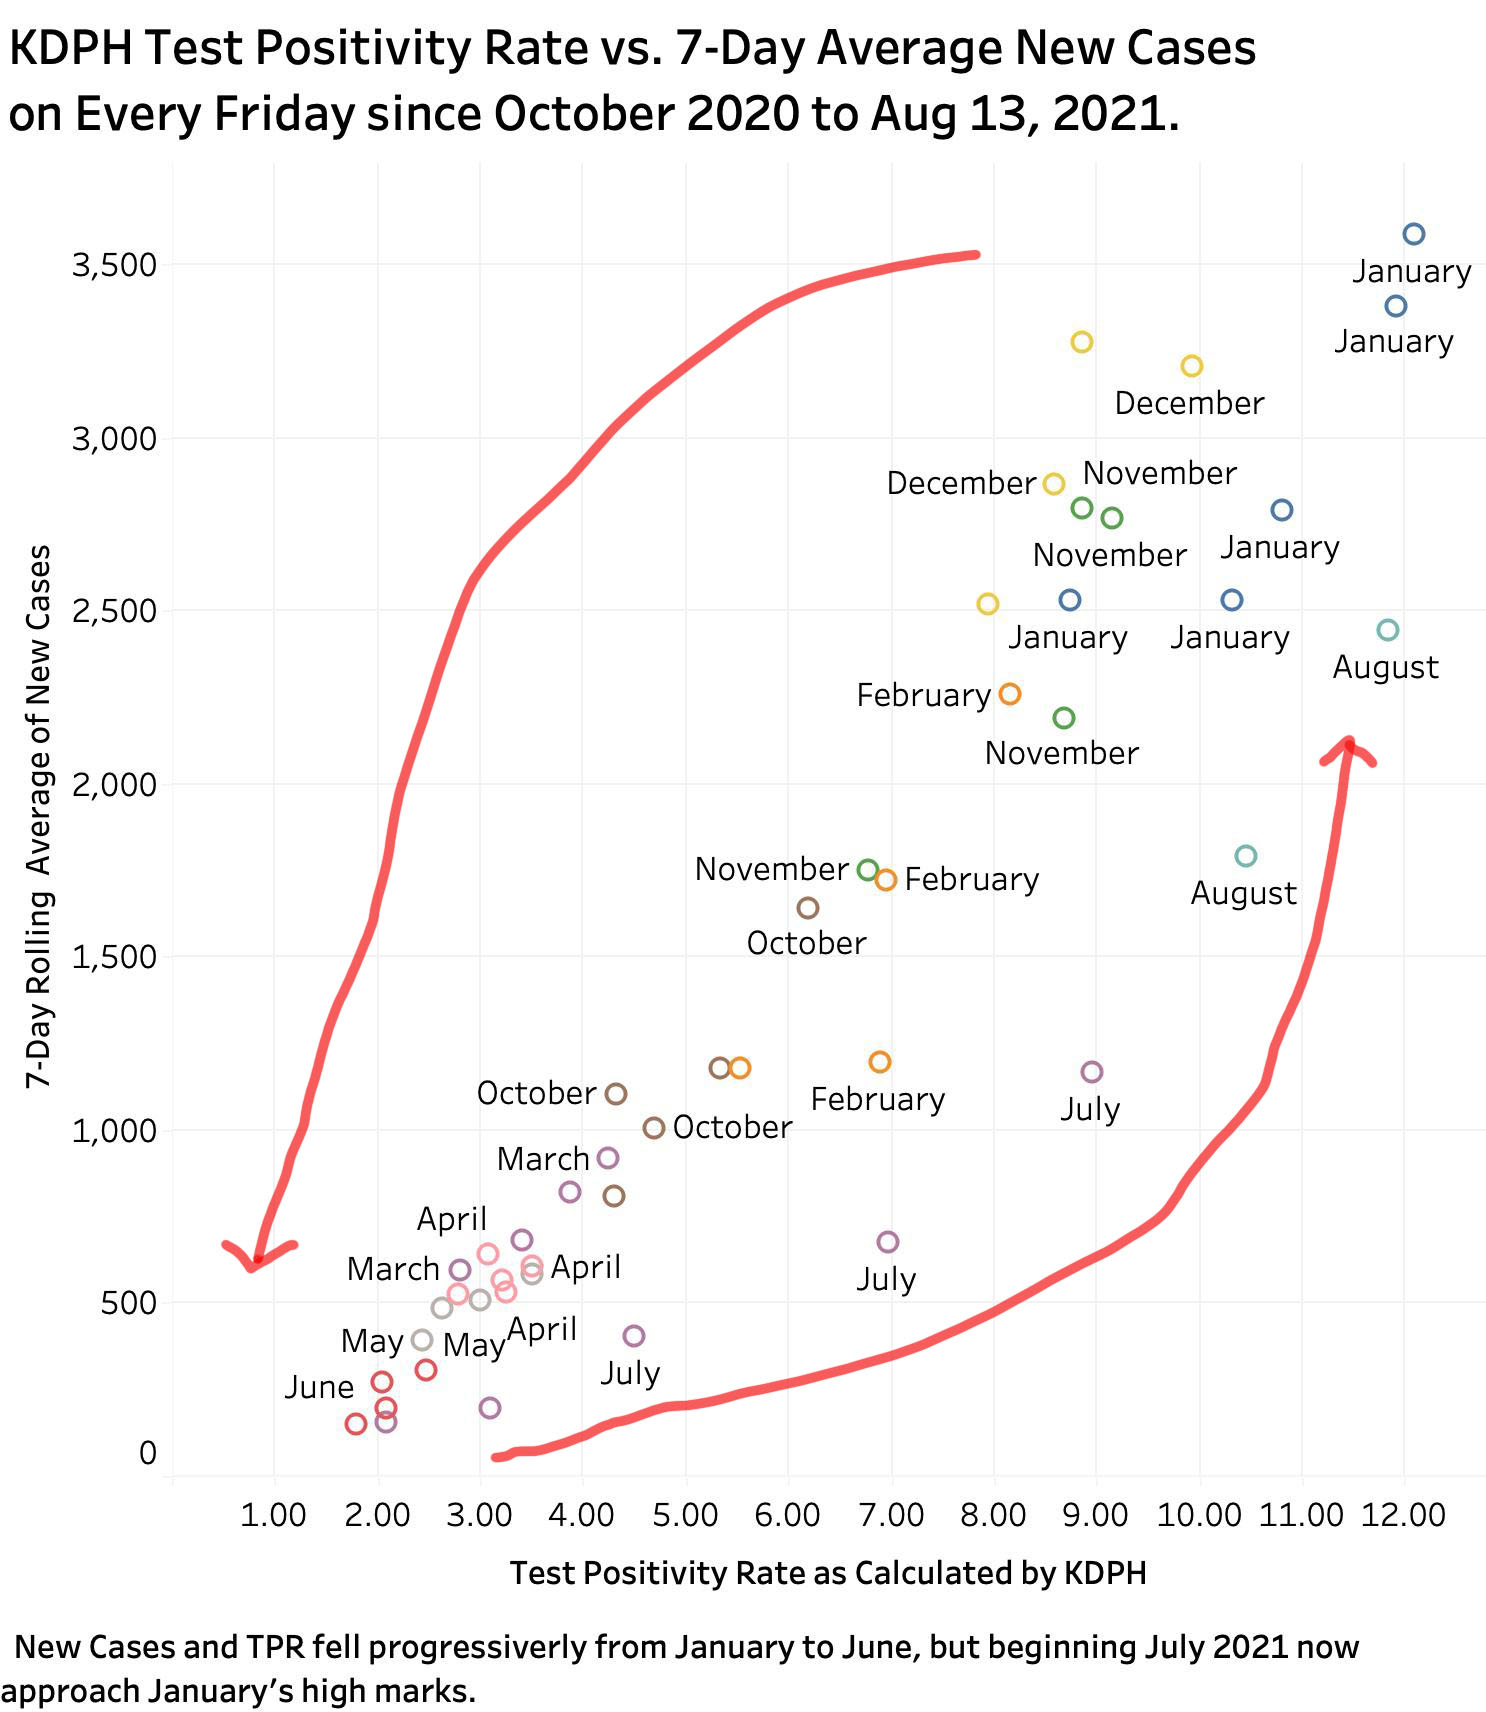
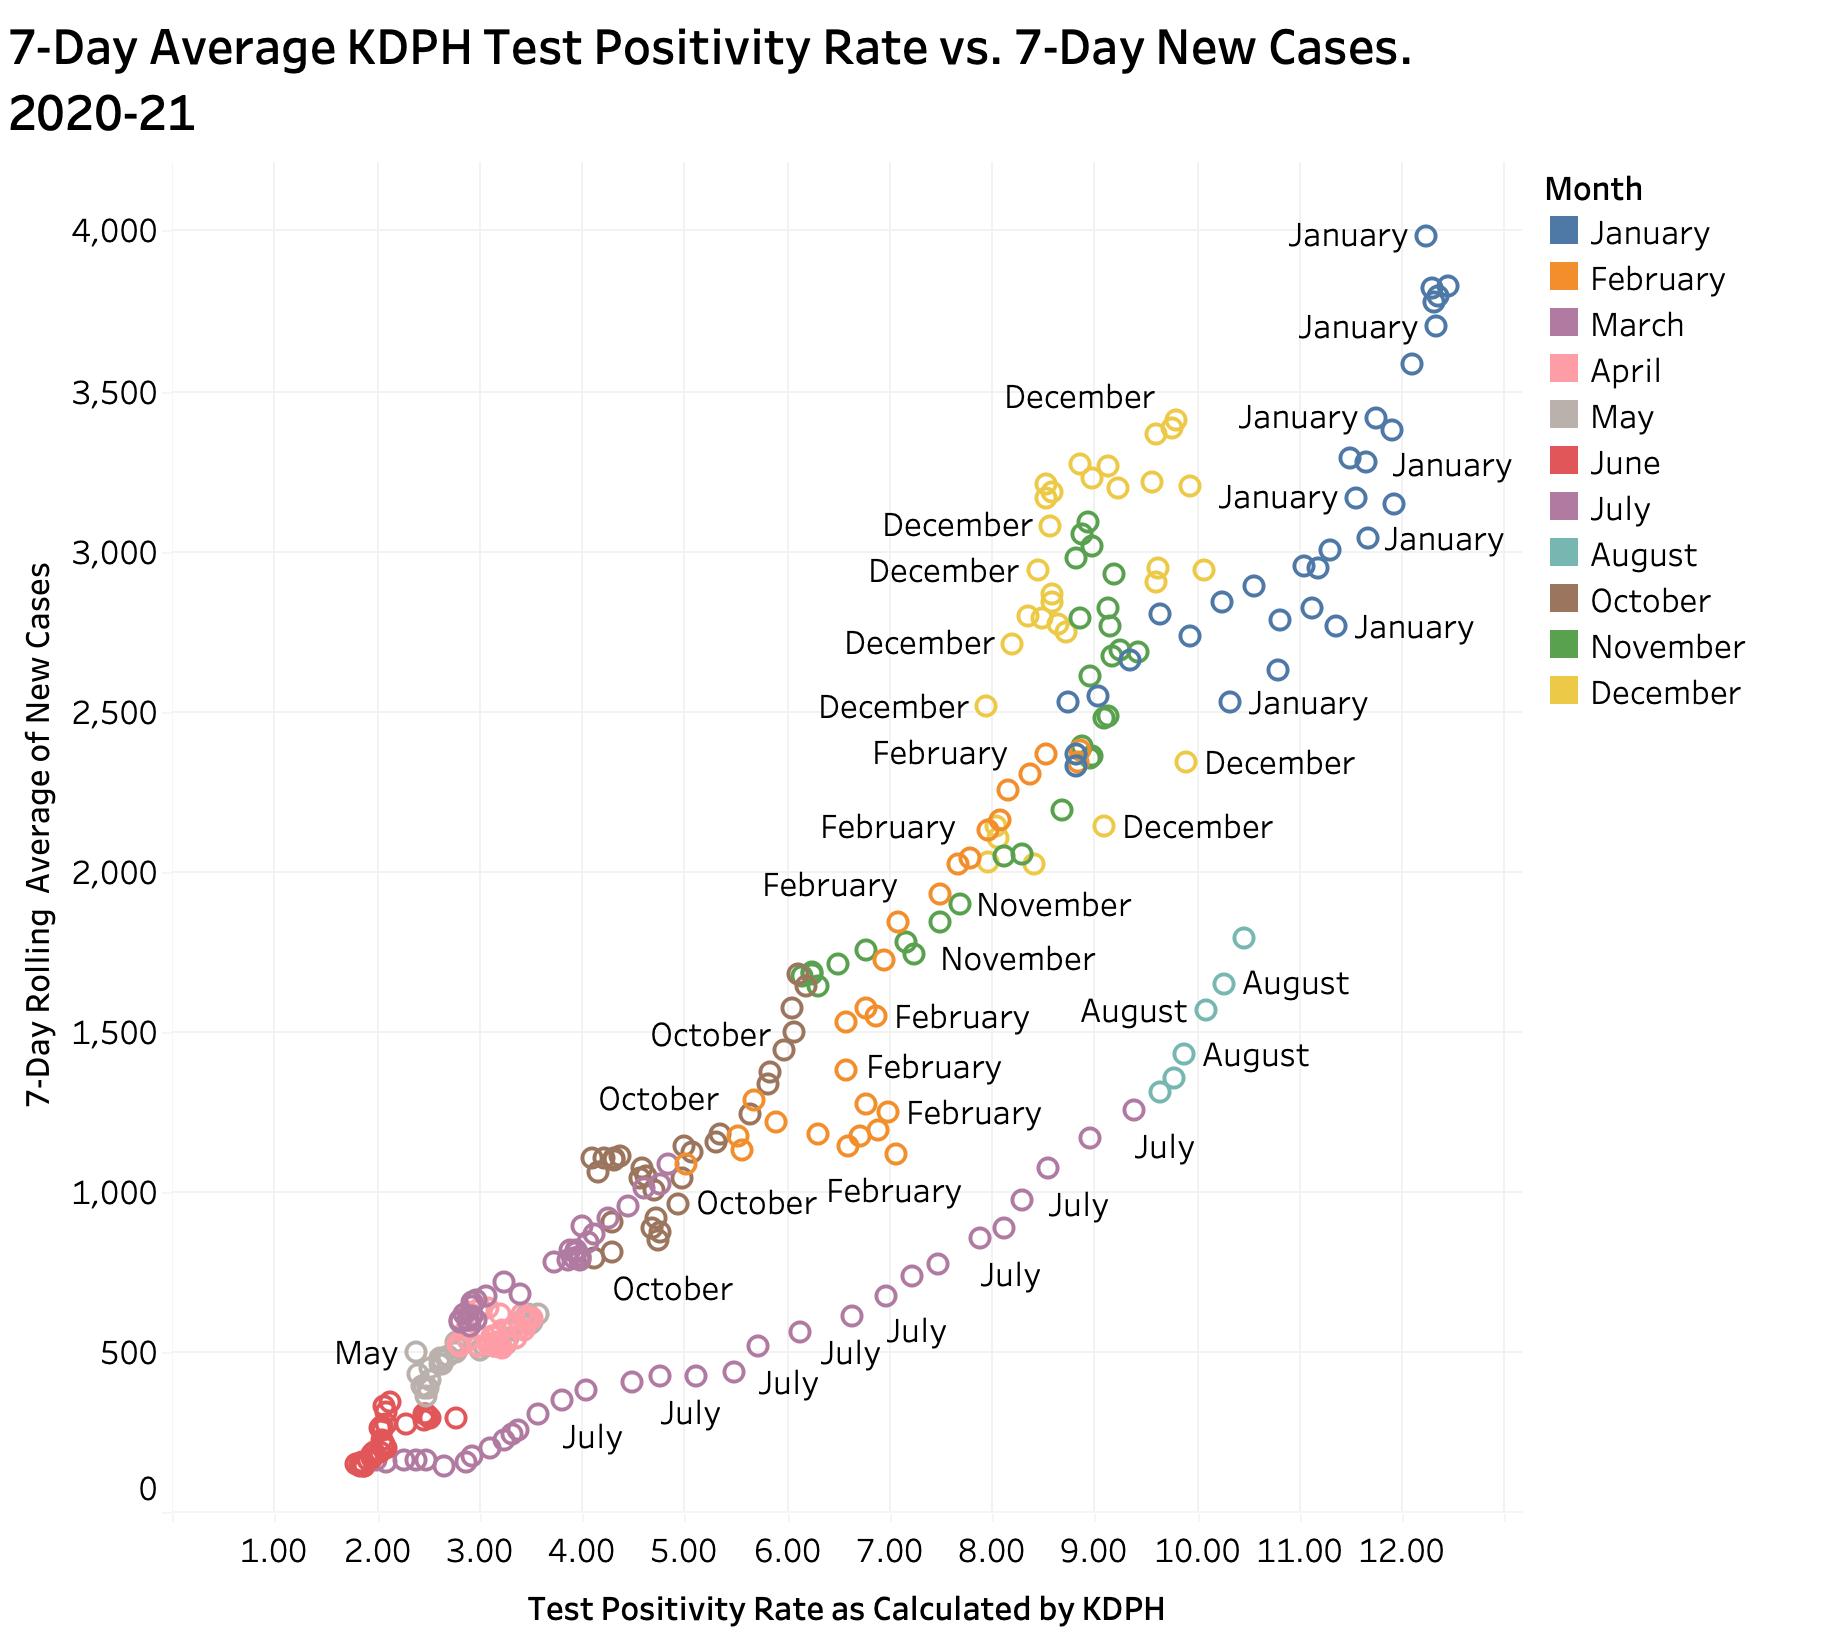
Relationship of 7-Day average new cases to Test Positivity Rates, KY.
Beginning last October, both TPR and new cases rose to their peak values in December and July of 2020-21. By June 2021, the availability of vaccines and at least some adherence to public health measures drove both measures down to the lowest levels of the entire epidemic. We were feeling good about things. Masks came off, people got together, vaccinations stalled, and the Delta variant entered the scene. Much faster than most of us (including me) could imagine, we have in the span of only 6 weeks rocketed back to the worst of our Kentucky epidemic experience.
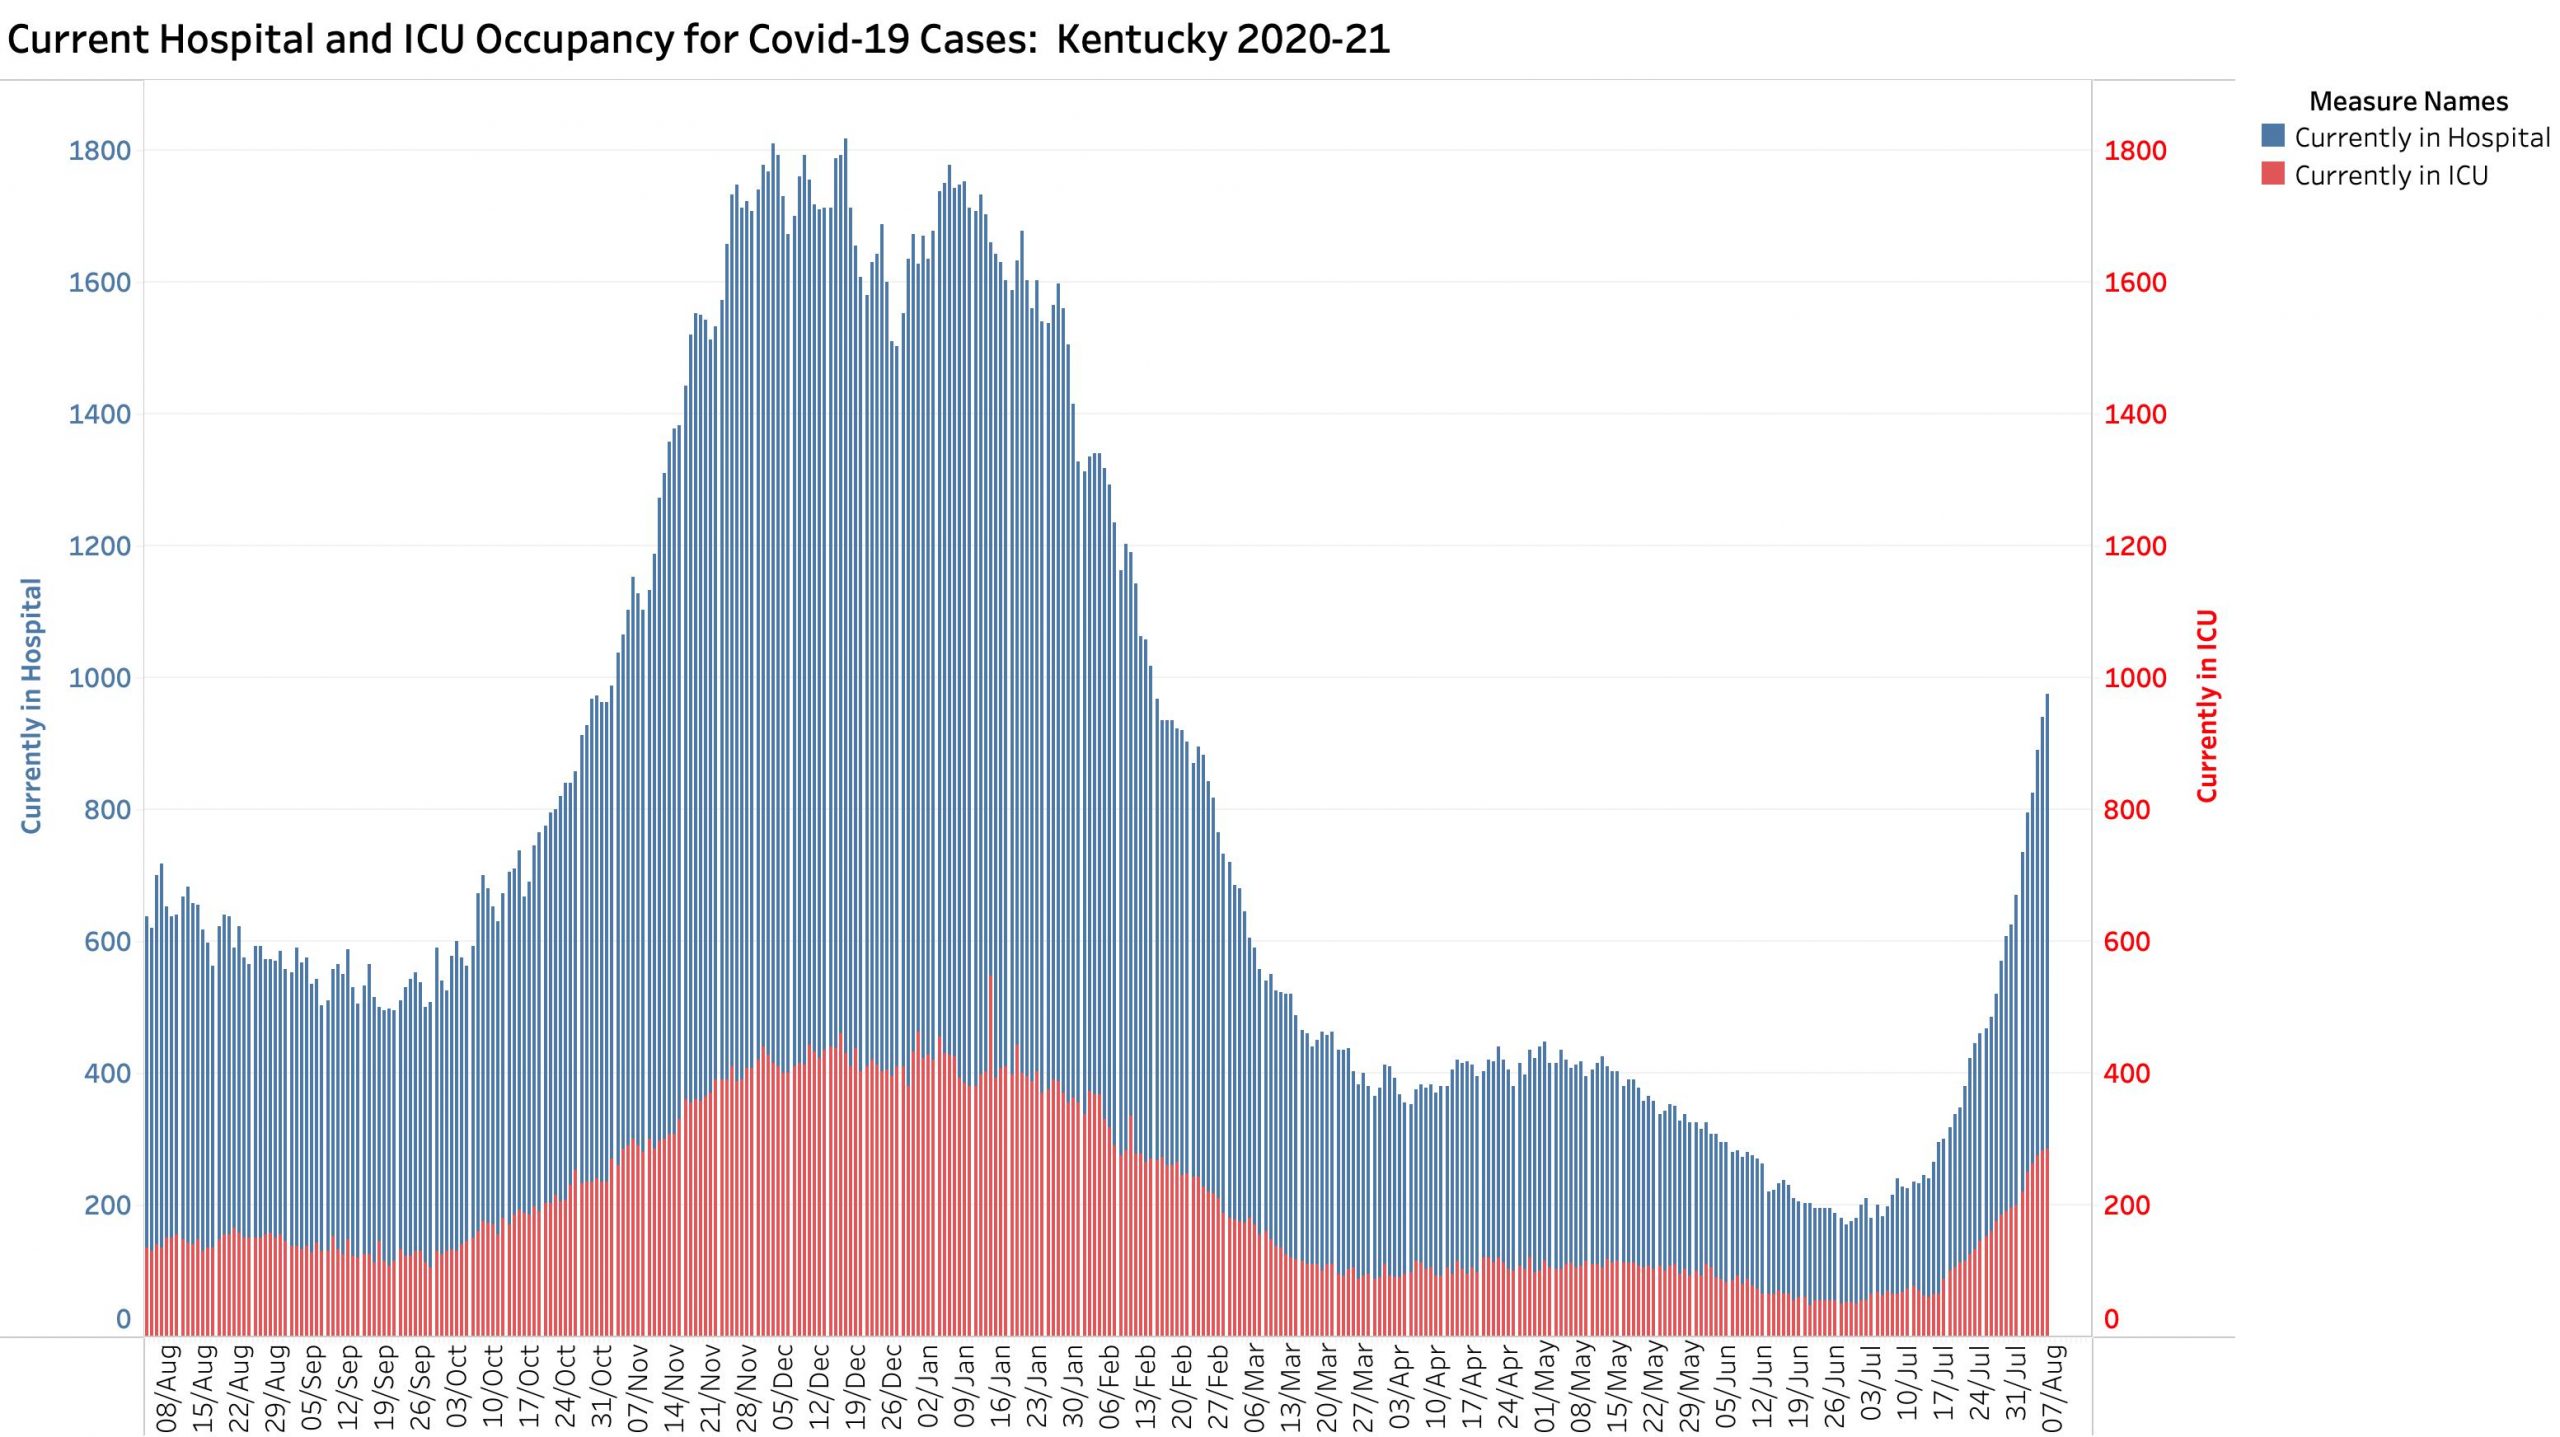
Our hospitals are getting clobbered. The corresponding plot below puts us right back into December-January territory. This is going to hurt!
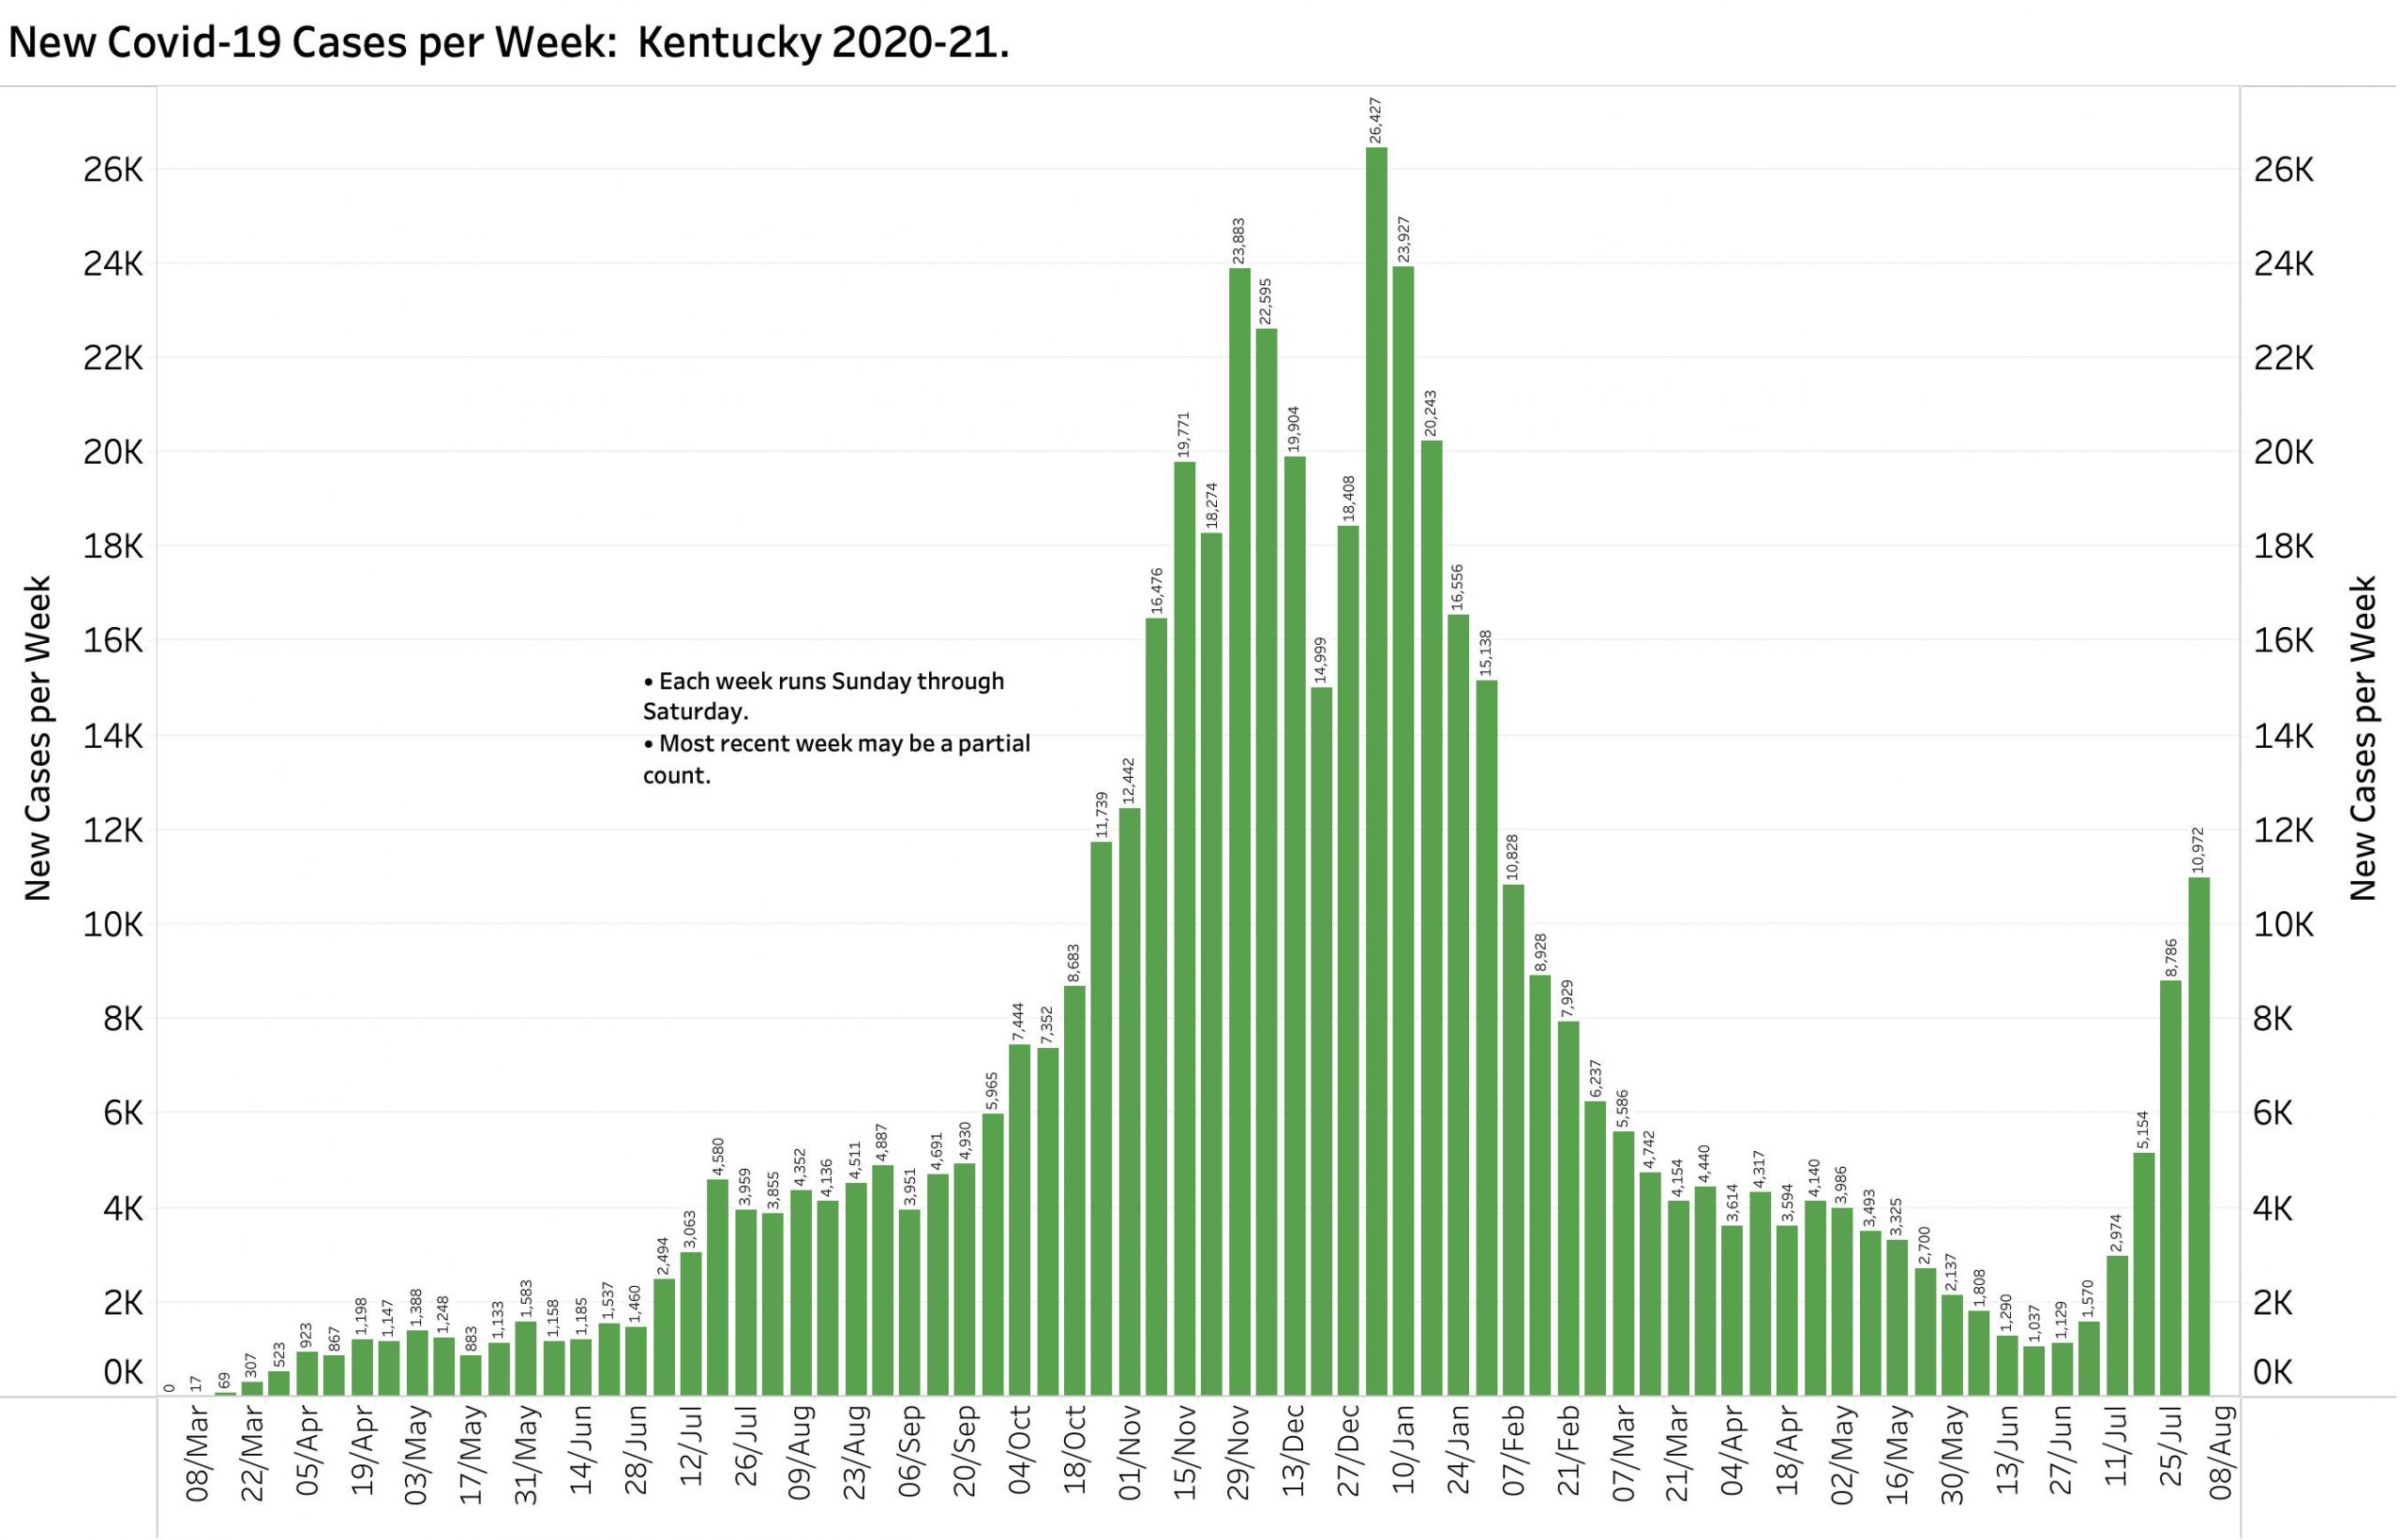
Kentucky’s Covid epidemic, already awful, marches across the state seemingly unchecked. KHPI’s analytic week runs from Saturday to Sunday. Therefore, we will not have today’s case counts or other statistics until next Monday evening. Even so, with 10,972 cases added to aggregate case totals in only a six-day week, Kentucky is already back to our disastrous November of 2020! The same can be said of current hospital utilization and Test Positivity Rates. This explosion of cases is especially dramatic because the current pool of vulnerable Kentuckians is smaller than in November! Vaccination and previous infection/recoveries make new or reinfections much less likely. Indeed, it is said by Public Health authorities here and nationally that the great bulk of new cases are occurring in unvaccinated individuals. At this point in the pandemic, this means we expect to see a larger proportion of children and younger adults getting sick. Such vulnerable folks are well seeded throughout the Commonwealth where non-medicinal public health measures are applied to widely varying degree or not at all!
Some public health and preventative behaviors are changing. More people are getting vaccinated and tested. Ominously however and based on actual new-case counts since July 1, 2021, unless public behaviors or other factors change faster and extent, KHPI projection estimates that Kentucky could hit 5000 new cases daily as early as August 17. I want that to be in error, but earlier KHPI projections over the past year and even the past month have on or near targets.
The reader can view KHPI’s trimmed down portfolio of data visualizations on Tableau Public. Here are a few examples.
Weekly cases Covid-19 in KY. Most recent week of 6 days is incomplete.
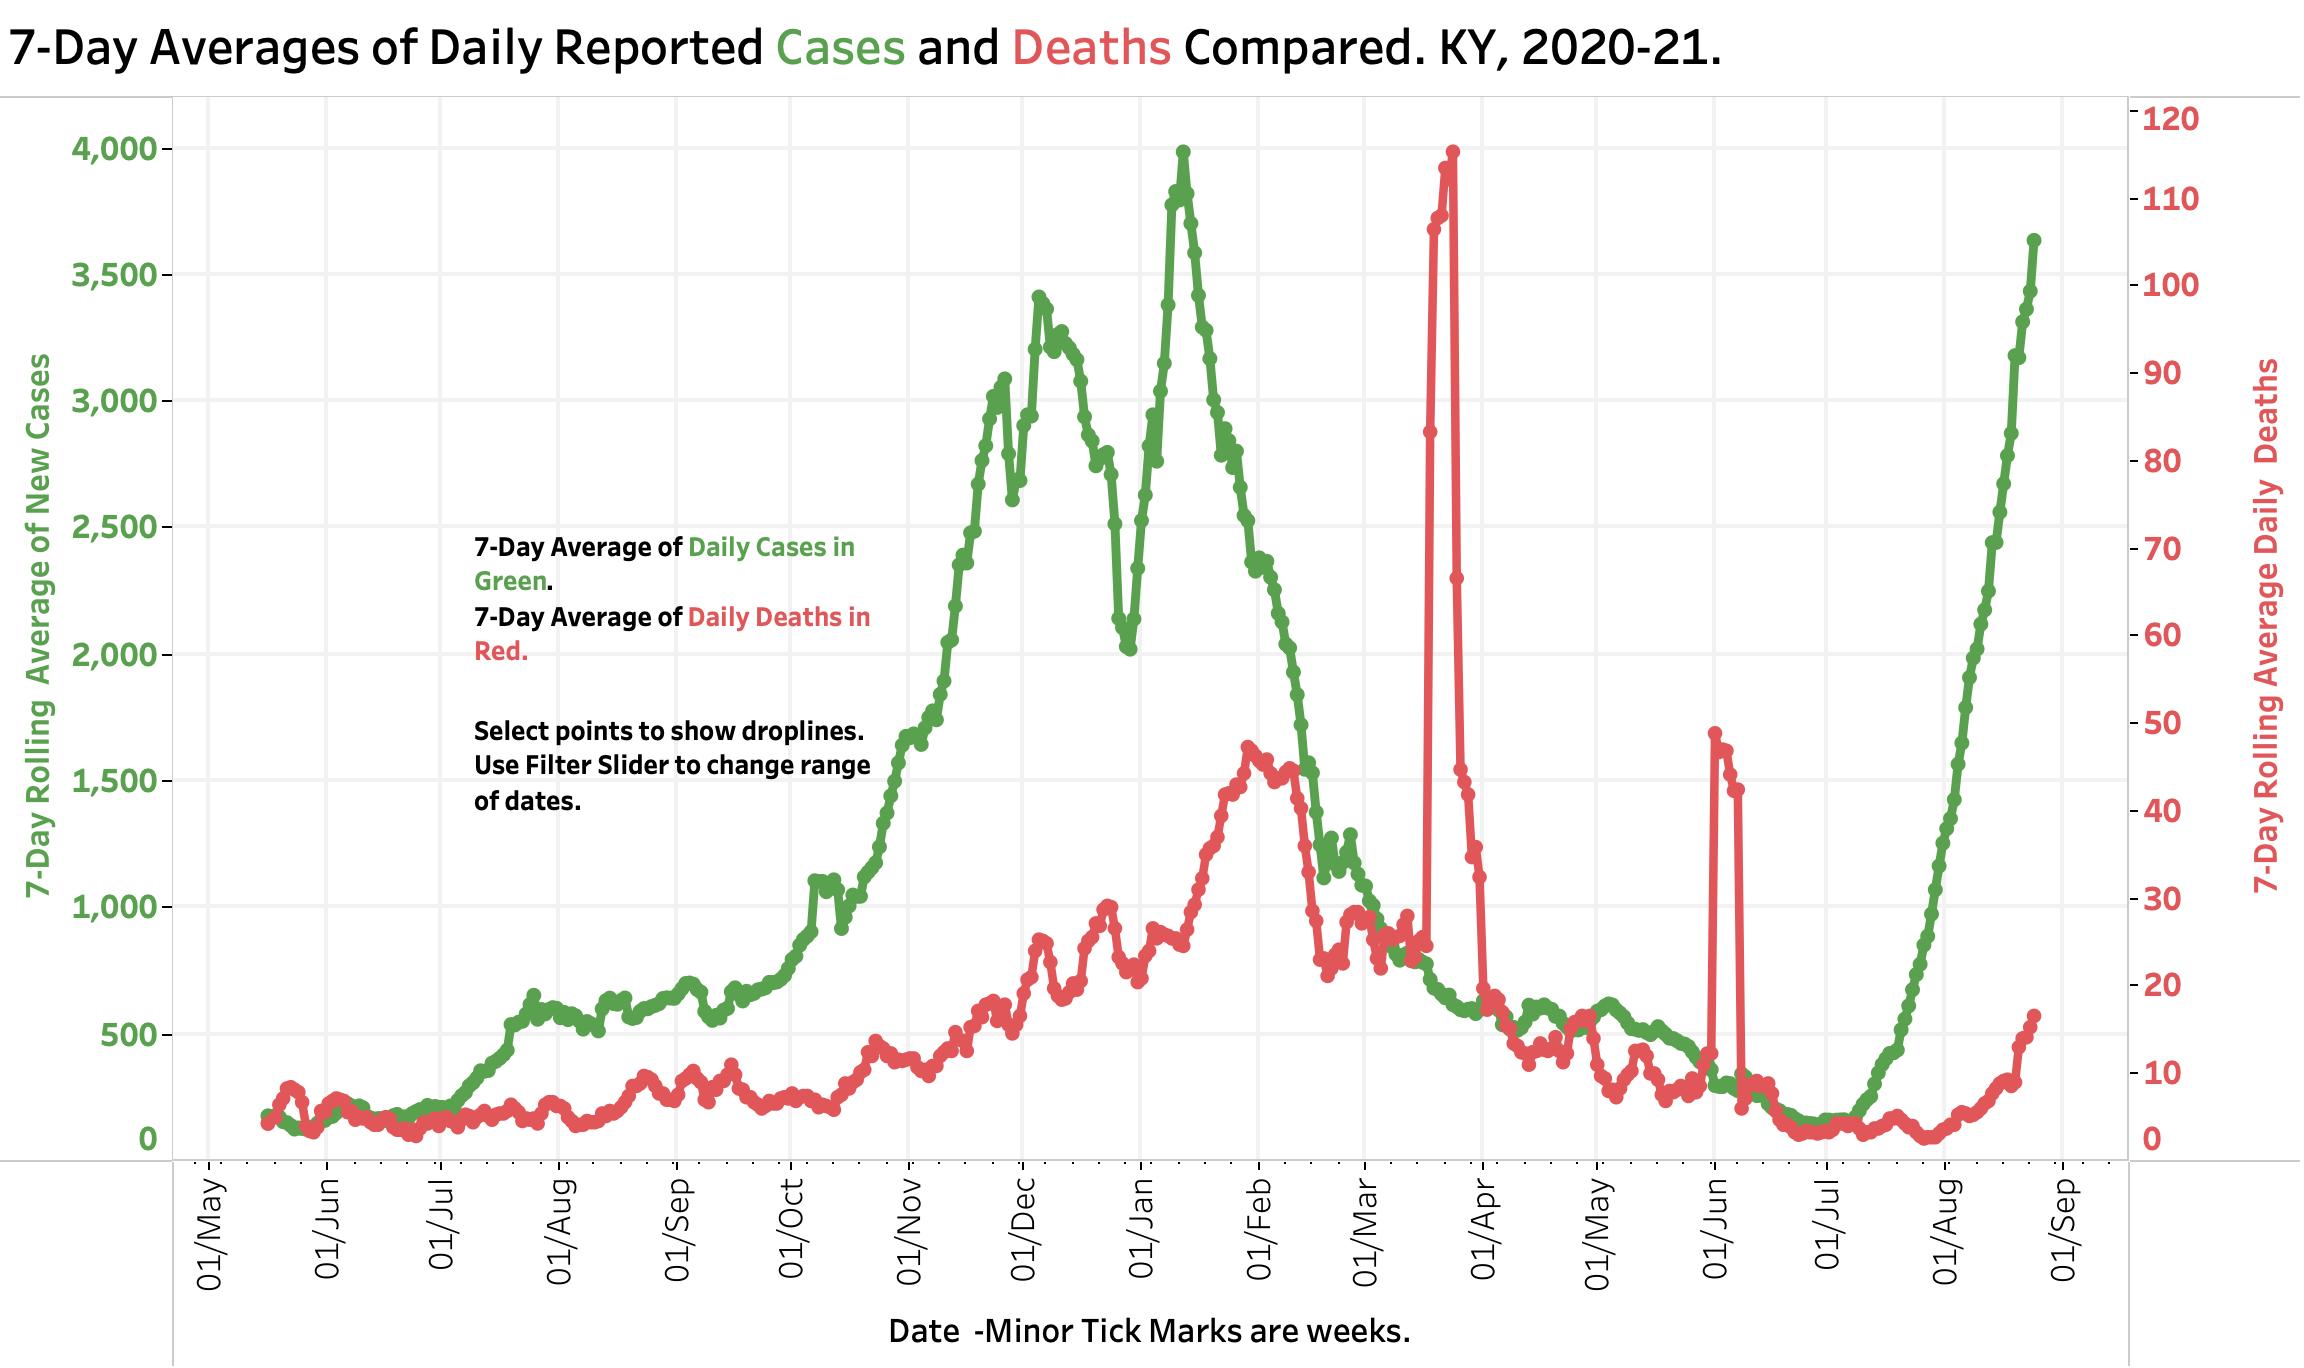
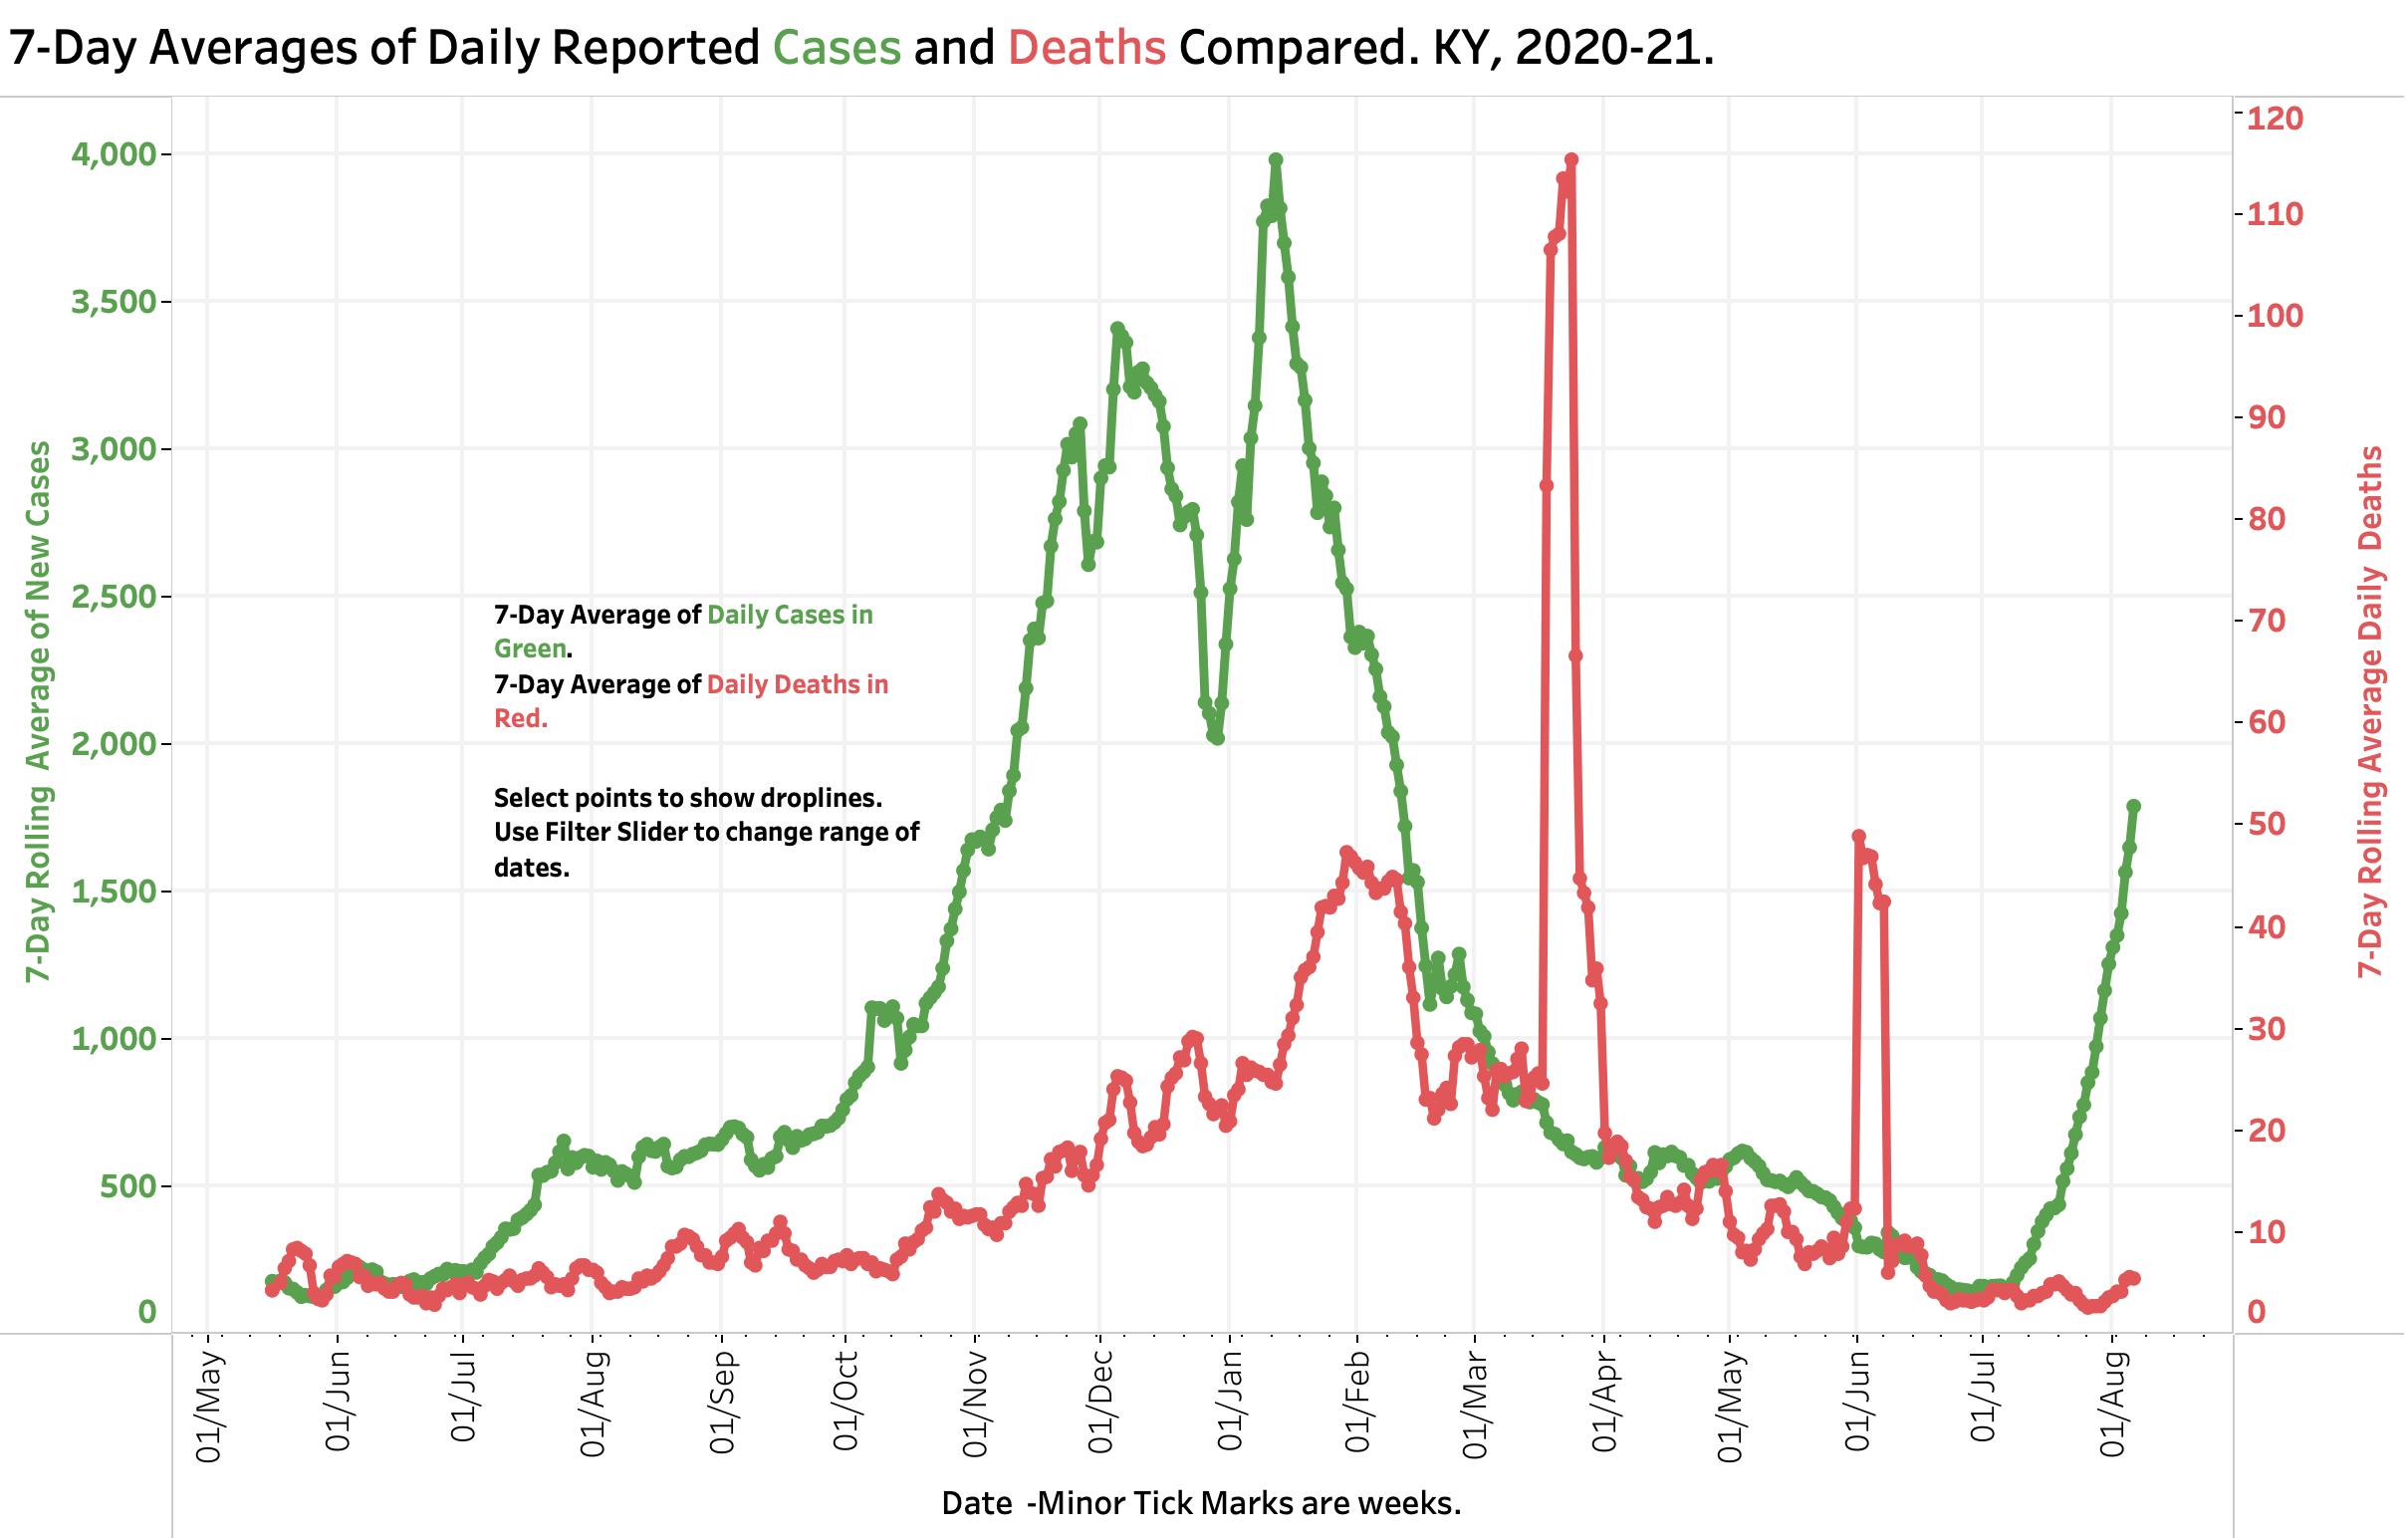
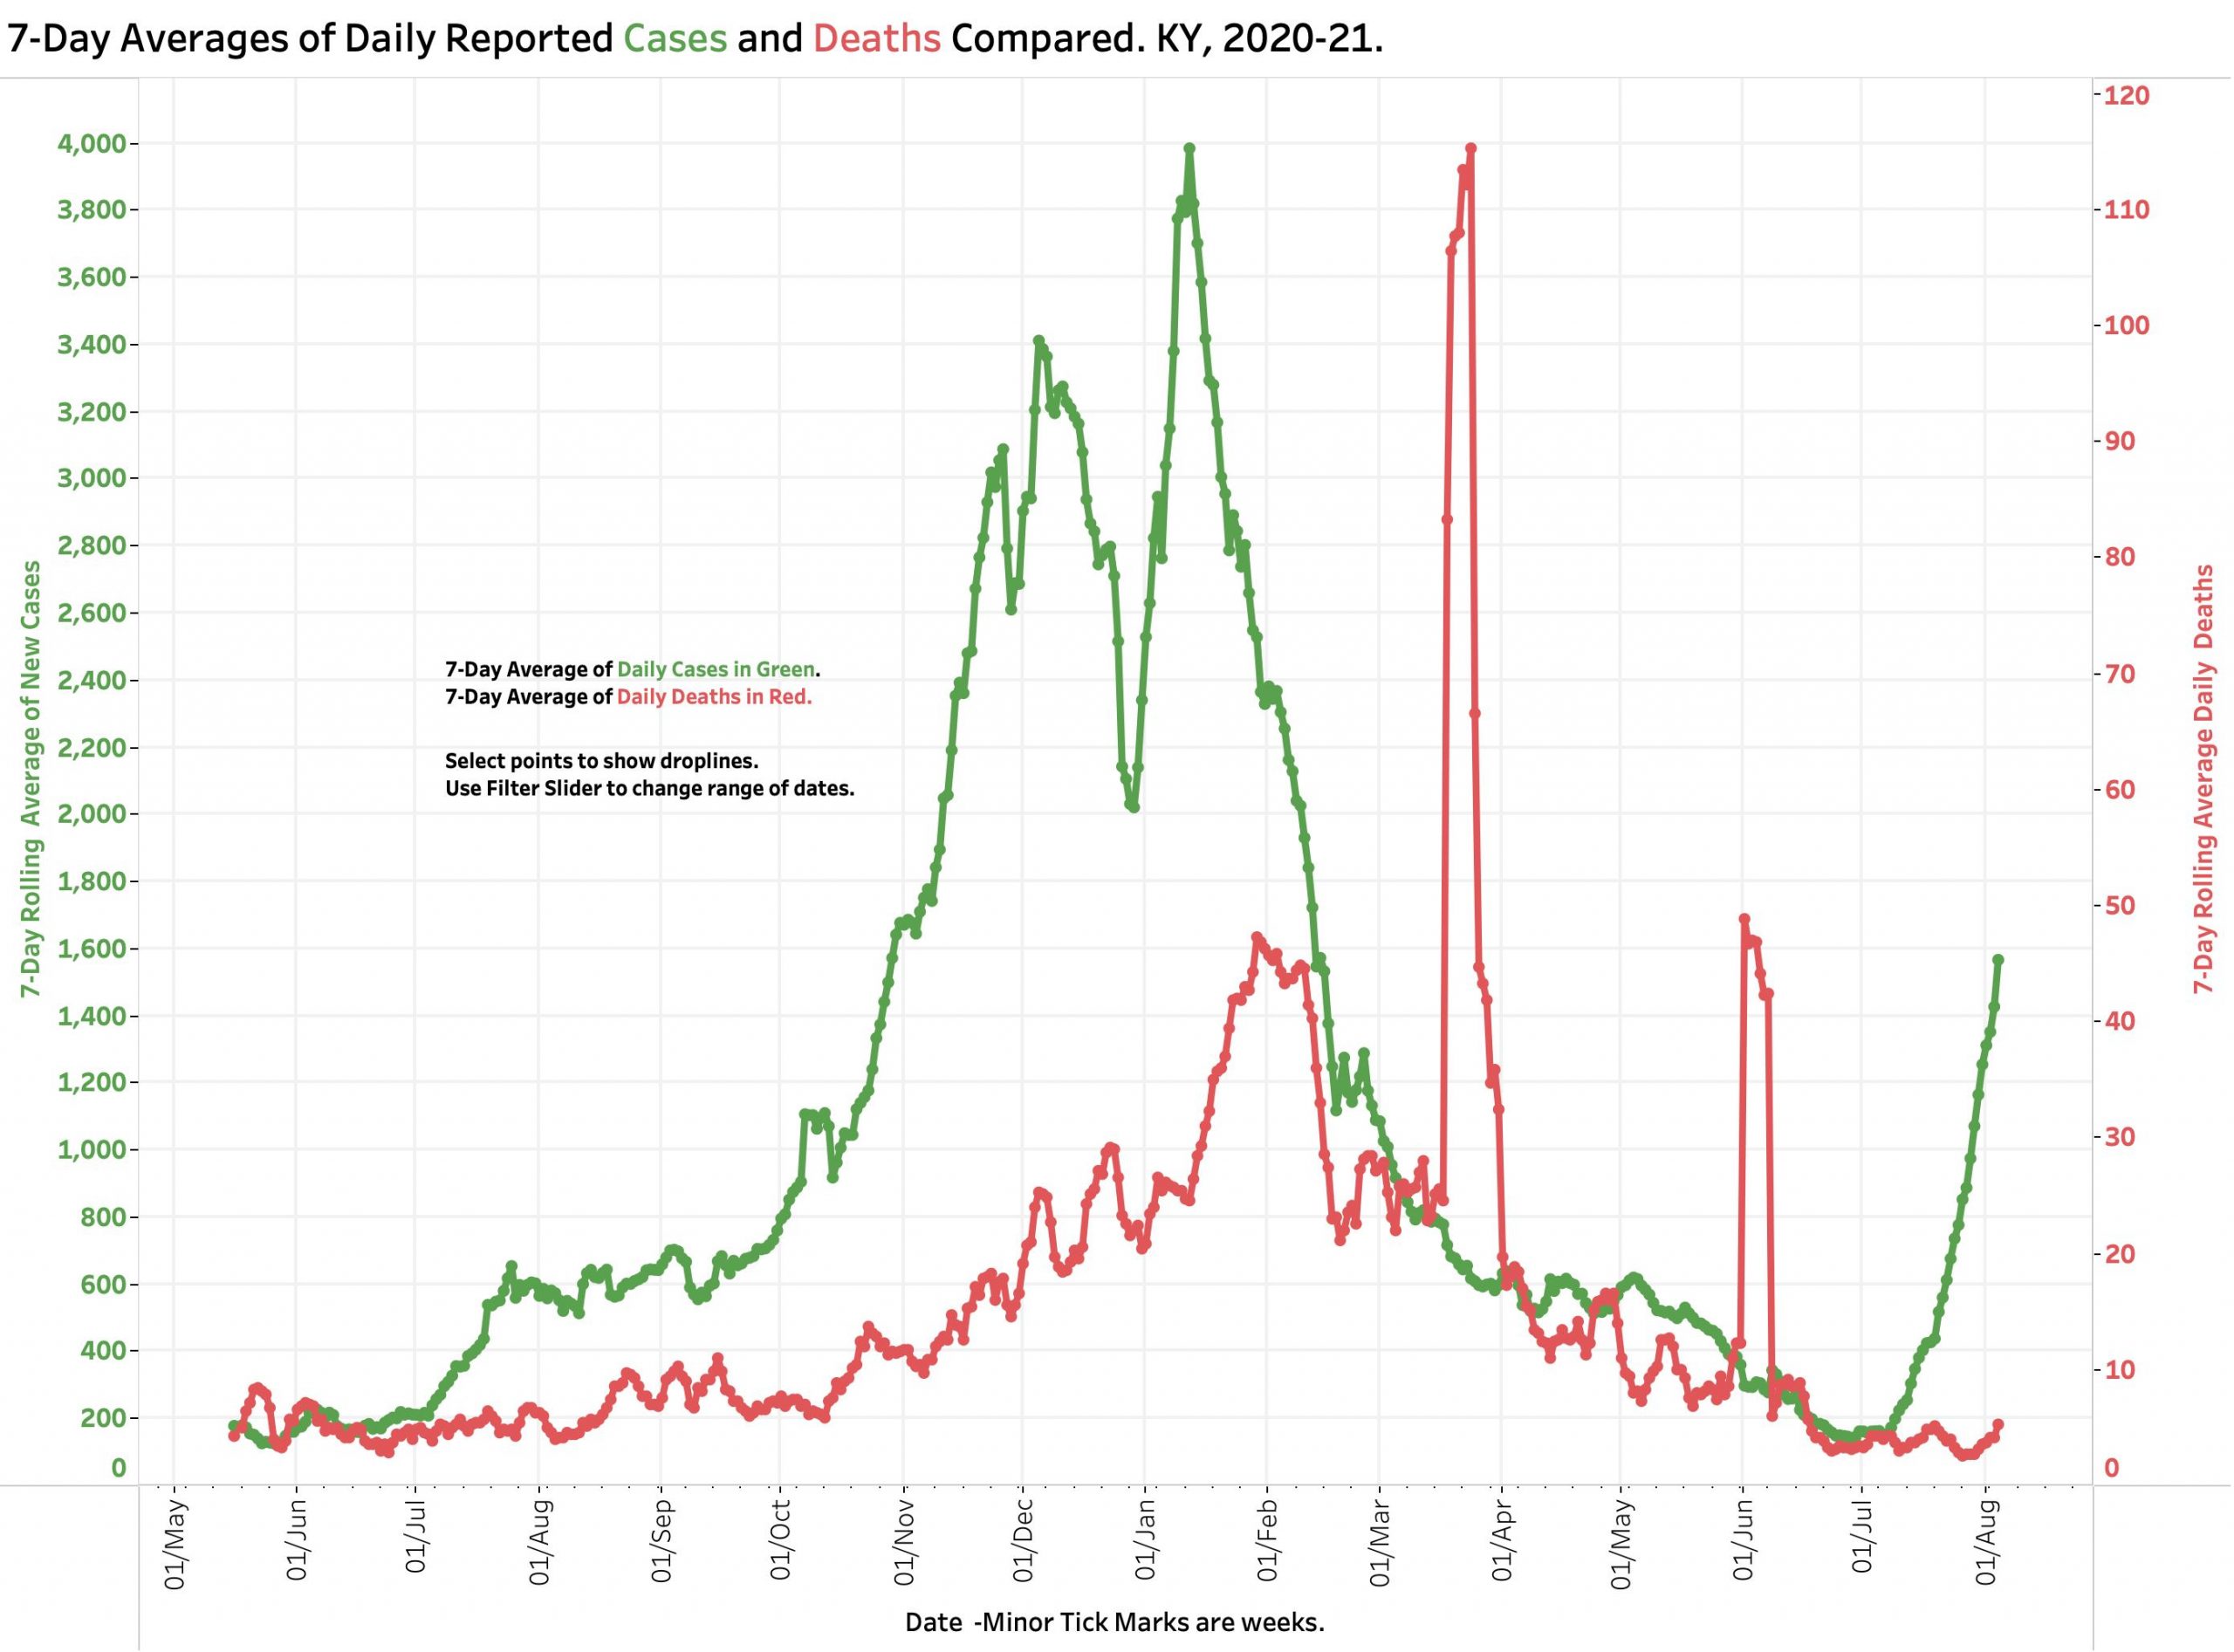
Cases and Deaths. Covid-19 in KY. As of 8-6-21.
Hospital & ICU Utilization. Covid-19 in KY. As of 8-6-21.
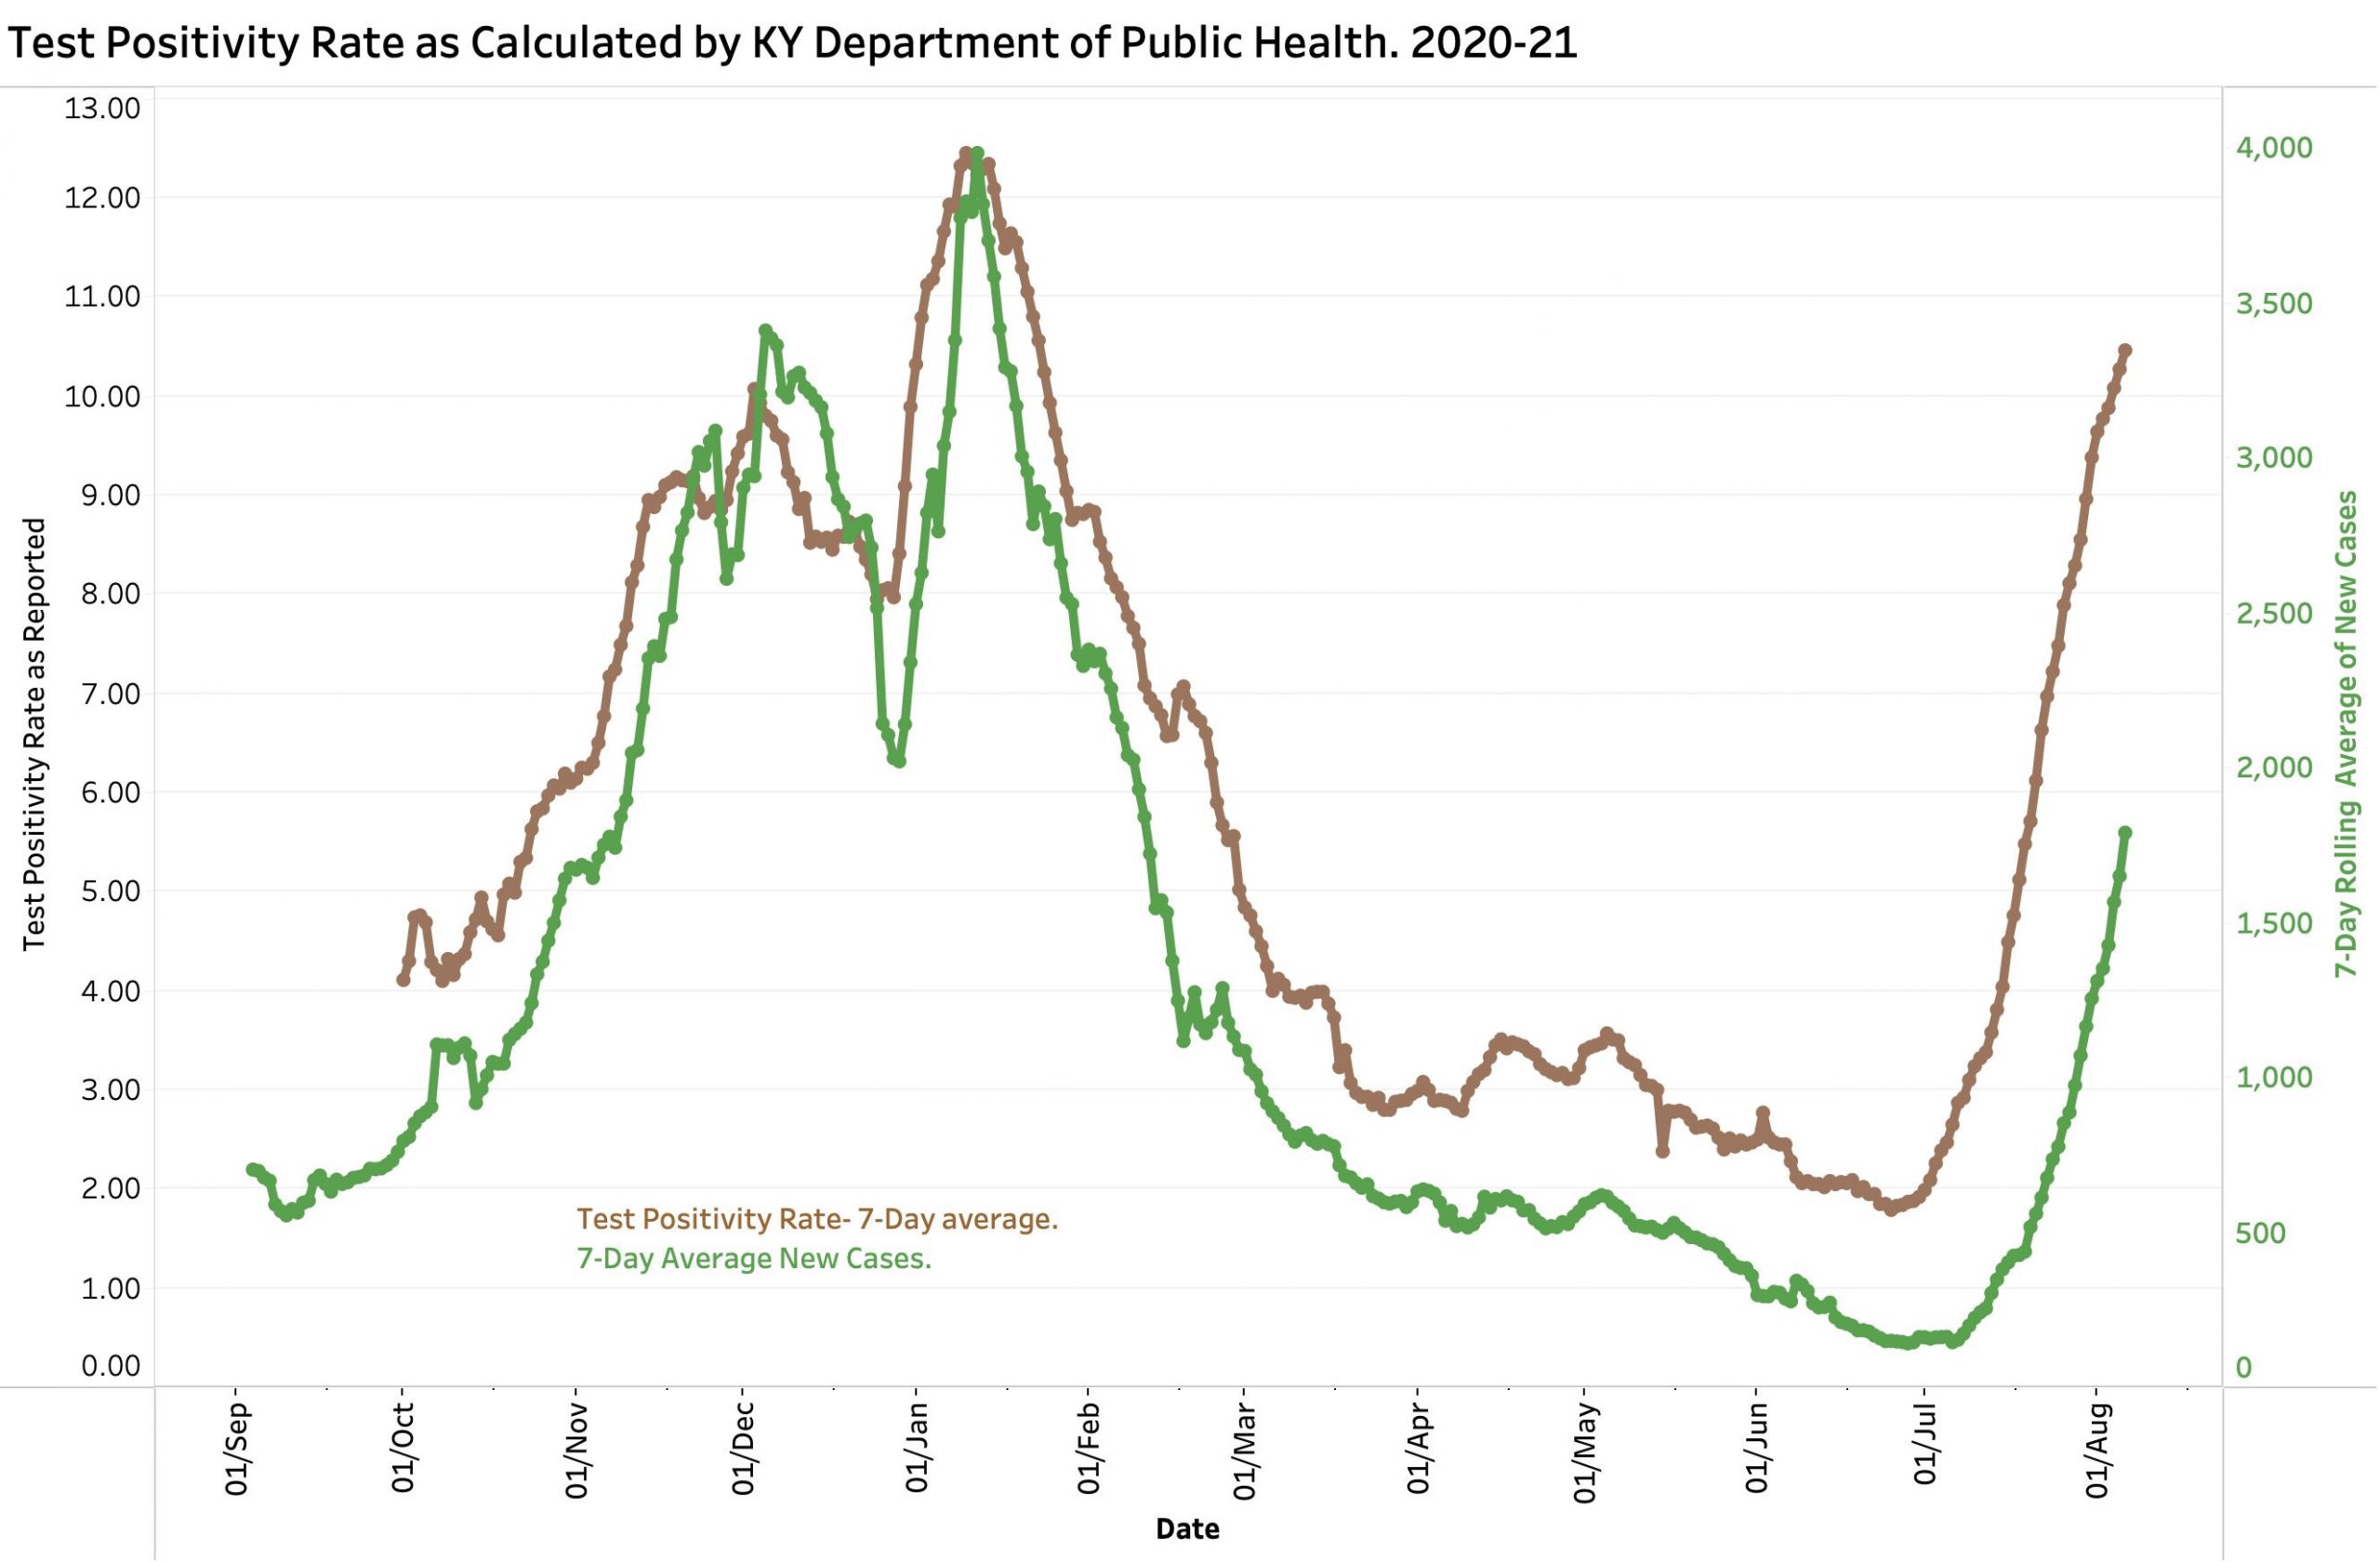
Test Positivity Rate. Covid-19 in KY. As of 8-6-21.
This next visualization displays the relationship of Test Positivity Rate and 7-Day new case rate for each day since October 1, 2021. The string of data points running across the bottom labeled July and August displays the values since July 1, 2021. We are aggressively approaching the same relationships as in January 2021. A companion display shows the relationship between TPR and hospital utilization. (The viewer can see both and adjust the range of dates displayed on the interactive Tableau Public website.)
Test Positivity Rate & 7-Day Case average and Covid-19 in KY. 10-1-20 to 8-6-21.
I have little more to offer this Saturday morning. Get vaccinated as soon as possible. Wear masks whenever abound other people you do not live with, especially when you do not know of their vaccination status. Avoid situations where there are a lot of people either inside or out. Listen to Governor Beshear and Doctors Stack and Fauci. Support and protect people and entities who are doing the hard things asked of them. This includes our hospitals and healthcare workers who are getting both swamped and burned out. Why wait until things get even worse?
Peter Hasselbacher, MD Emeritus Professor of Medicine, UofL President, KHPI Saturday, 7 August 2021
Kentucky’s Covid-19 statistics were updated last Monday evening closing out the weekend days of Saturday and Sunday. All three of those days had the highest numbers of new cases reported for their weekday since the waning of the winter’s epidemic in early February, 2021. The numbers reported on Monday were dwarfed by Tuesday evening’s report of 1,803 new cases and today’s of 2,583. Current hospital and ICU utilization are similarly rocketing upwards with totals and at rates matching those of last November’s prelude to December’s epidemic disaster. Current numbers, including the Test Positivity Rate are also increasing in an exponential manner with doubling times measured in days, not weeks. Today’s Test Positivity Rate of 10.08 is headed for January’s high of 12.45. The 7-day average of new cases exceeds the 14-day average by the largest measure since January also indicating rapid epidemic expansion. Deaths are beginning to creep up with 10 this evening. It is not an exaggeration to use terms such as “on fire,” or “explosion” to describe the current state of Kentucky’s Covid-19 epidemic.
KY Covid-19 Cases and Deaths as of 4 Aug 2021.
Our state does not make historic county data available in a usable digital form to the public, but I must assume some of our counties are feeling a greater impact of expansion than the Commonhealth as a whole. It gives me little comfort to consider that some “hands off” states like Florida or Texas are in a much worse position. We know what is happening to us. The issue is what are we going to do about it as individuals and as a community? Let nature take its course? We can do better. I argue that we already know what works to mitigate the immediate and long-term damage of Covid-19 but lack the commitment to each other to stand united.
The reader is invited to review KHPI’s portfolio of data visualizations on its Tableau Public website.
How about that Delta virus? Much is being written about how the CDC, other government entities, and business organizations are handling issues related to masking and other non-medicinal public health measures to combat the Coronavirus. Some private entities now require immunization for employment or access. Although it should not have been necessary as nationwide case data was speaking for itself, an analysis of a July Covid-19 super-spreader event in Barnstable County, Massachusetts put the issues right on the table. A preliminary report by the CDC in their regular publication “Morbidity and Mortality Weekly Report” (MMWR) was made available to the public on July 30. This and a slide deck of related internal CDC discussion are available to anyone. Let me know if these links do not work for you.
Summary of the CDC report of July 30, 2021. Barnstable County includes all of Cape Cod which is famous for its Fourth of July parties and other celebratory activities that draw participants from all over. During the month of July, 469 cases of Covid-19 associated with multiple summer events were identified among Massachusetts residents. Of those discovered to be infected, 74% were symptomatic. These infected persons reported attending densely packed indoor and outdoor events that included bars, restaurants, guest houses and rental homes. An initial outreach from the Massachusetts Department of Public Health revealed secondary transmission to at least 22 other states– so far! This outbreak epitomizes the definition of a super-spreader event that was largely focused in a single party-town.
Other observations from this outbreak have considerable relevance for the rest of us. Of the 133 patients in whom the analysis was performed, 89% were due to the Delta variant. Some 74% of cases occurred in fully vaccinated individuals! Of the 274 vaccinated patients with these “breakthrough infections,” some 79% were symptomatic with the rest presumably asymptomatic carriers. The viral RNA test used to diagnose Covid-19 disease or identify viral carriage can provide a measure of the amount of virus in the nasal cavity. It was demonstrated that there was no significant difference in the amount of viral RNA in the noses of those who were vaccinated or not. There were only 5 known Covid-19 patients who were known to have been hospitalized of which 4 were fully vaccinated. There were no deaths reported at the time of the report on July 30, 2021.
The CDC analysis describes a unique outbreak whose specific numbers, percentages, or rates cannot be generalized nationally but which are relevant based on solid epidemiologic and medical principles. For one thing, only Massachusetts residents were included in the analysis– out-of-staters were ignored. There was a detection bias such that symptomatic patients were much more likely to be included in the analysis. The demographics of the patients were not representative of the nation as a whole. They were much more likely to be male (85%), younger with a median age of 40, and likely whiter and better off financially in upscale vacation-destination Cape Cod. My guess is that few of the infected wore masks. Nothing has been reported about preexisting health conditions in the patients except that of the 5 known hospitalized patients, the single unvaccinated patient and 2 of the fully vaccinated ones had underlying medical conditions.
To what extent does vaccination decrease person to person spread? In addition to the evidence of high transmissibility of the Delta variant, the frequency of apparent breakthrough infections in this specific population and the high viral-RNA lodes in vaccinated individuals raises the issue of whether vaccinated viral carriers, symptomatic or not, are capable of passing the virus to others. I am unaware of specific information to settle this important issue, but it seems to me to be operationally reasonable to assume that some degree of transmissibility from the vaccinated is possible until disproved by a more structured analysis able to answer the question. Breakthrough infections are still considered infrequent in the general public– so far!
The observations from the Barnstable outbreak are relevant to and reinforce our understanding of the current state of our national epidemic. What can happen in Cape Cod has the potential to happen anywhere else albeit to greater or lesser degree. We ignore the lessons at our peril. I can only repeat the recommendations stated in the MMWR report that themselves are rather modest.
Recommendations from the MMWR Report. “Event organizers and local health jurisdictions should continually assess the need for additional measures, including limiting capacity at gatherings or event postponement, based on current rates of COVID-19 transmission, population vaccination coverage, and other factors.”
“This investigation suggests that even jurisdictions without substantial or high COVID-19 transmission might consider expanding prevention strategies, including masking in indoor public settings regardless of vaccination status, given the potential risk of infection during attendance at large public gatherings that include travelers from many areas with differing levels of transmission.”
Current CDC recommendations and those of many public and private jurisdictions are in accord with the abovre. That may ultimately, indeed probably not be enough.
A highly virulent and perhaps more dangerous virus is circulating rapidly among us in Kentucky as it is in the rest of the world. Other variants will certainly follow. Vaccination of Massachusetts residents did what it was supposed to do by keeping people from getting very sick and by decreasing hospitalizations or death. We are still learning about how the Delta variant will change things. We should be receptive to changes in Public health recommendations and even requirements in response to a changing epidemic background. The epidemic was never declared by our public health services to be “over.” Many of us would like to have believed that it was and acted accordingly. That was obviously premature. The current CDC recommendations are reasonable and should be expected to change as the epidemic gets better or worse. I got vaccinated at the earliest opportunity. You should too.
Peter Hasselbacher, MD Emeritus Professor of Medicine, UofL Kentucky Health Policy Institute 4 August 2021