
COVID variants on the rise globally in an environment where public health interventions are being withdrawn, rejected, or otherwise unavailable – what could go wrong?
Recent data indeterminant as to direction of epidemic spread in KY.
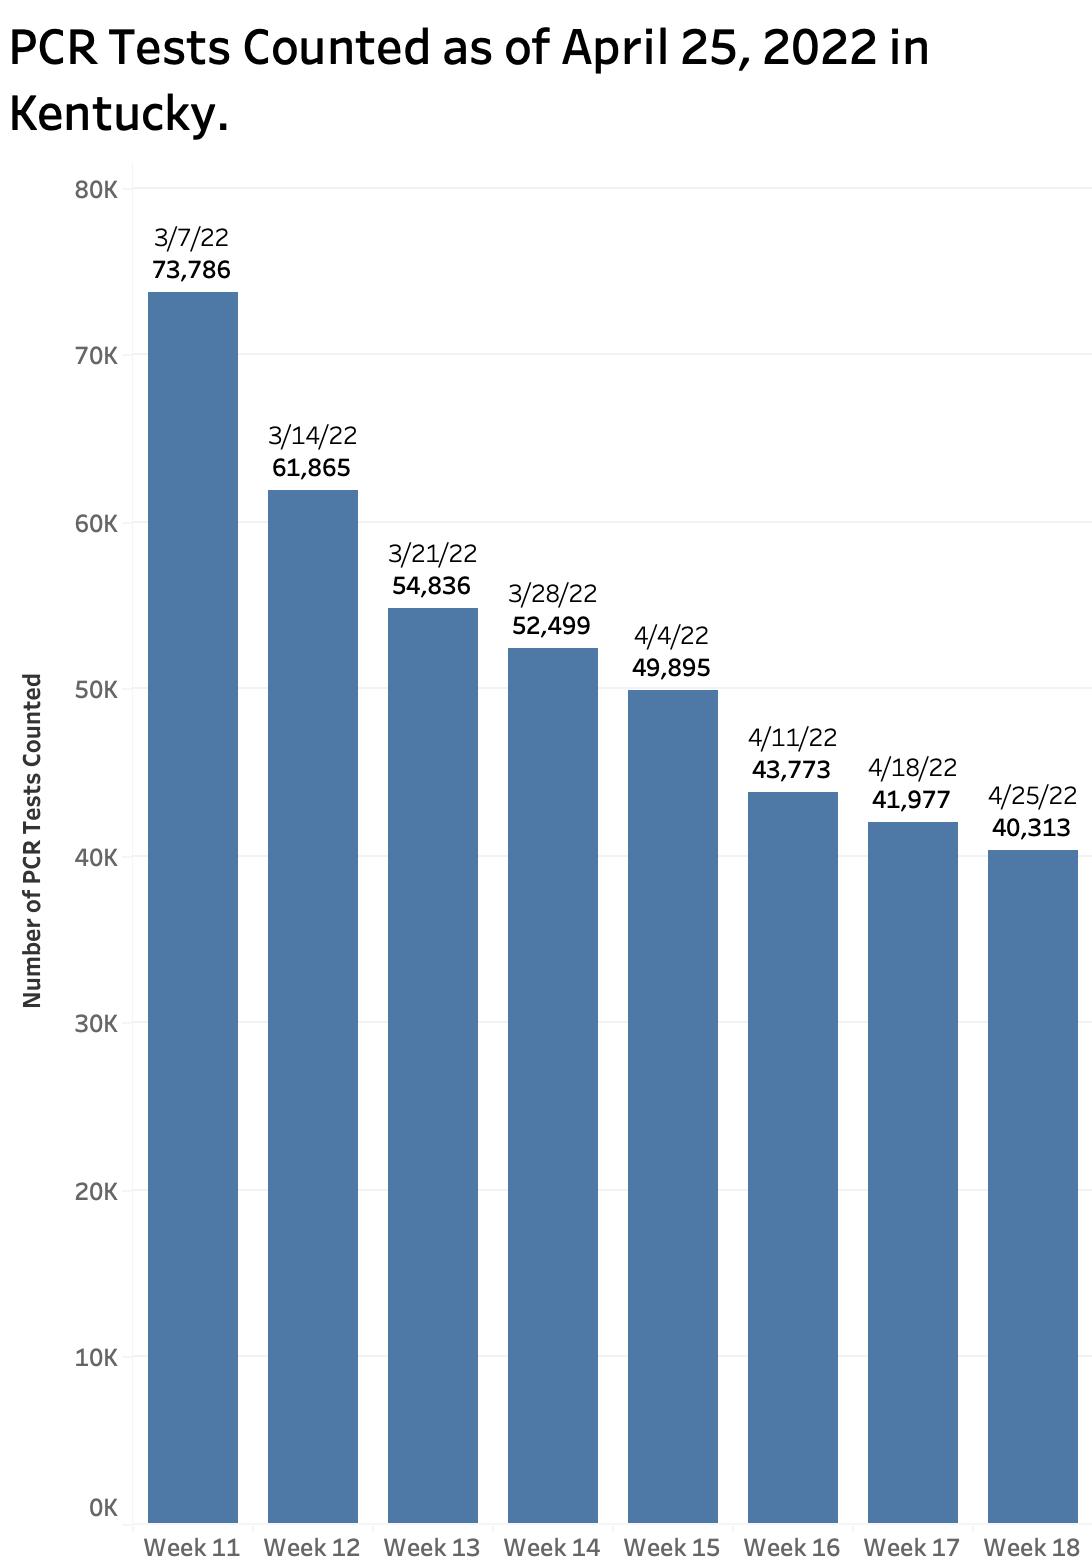
Yesterday evening, Kentucky Department of Public Health published its Covid data for the week ending Sunday, April 24. The CDC published its most recent community level map as of last Thursday April 21. I confess I have no idea how to compare or interpret the data either within or between these two entities. The CDC’s map has all 120 of Kentucky’s counties in the green “Covid-19 Low Community Level,” as is indeed most of the rest of the country. Today’s CDC’s county map of actual disease incidence in Kentucky contains much missing data and is uninterpretable.
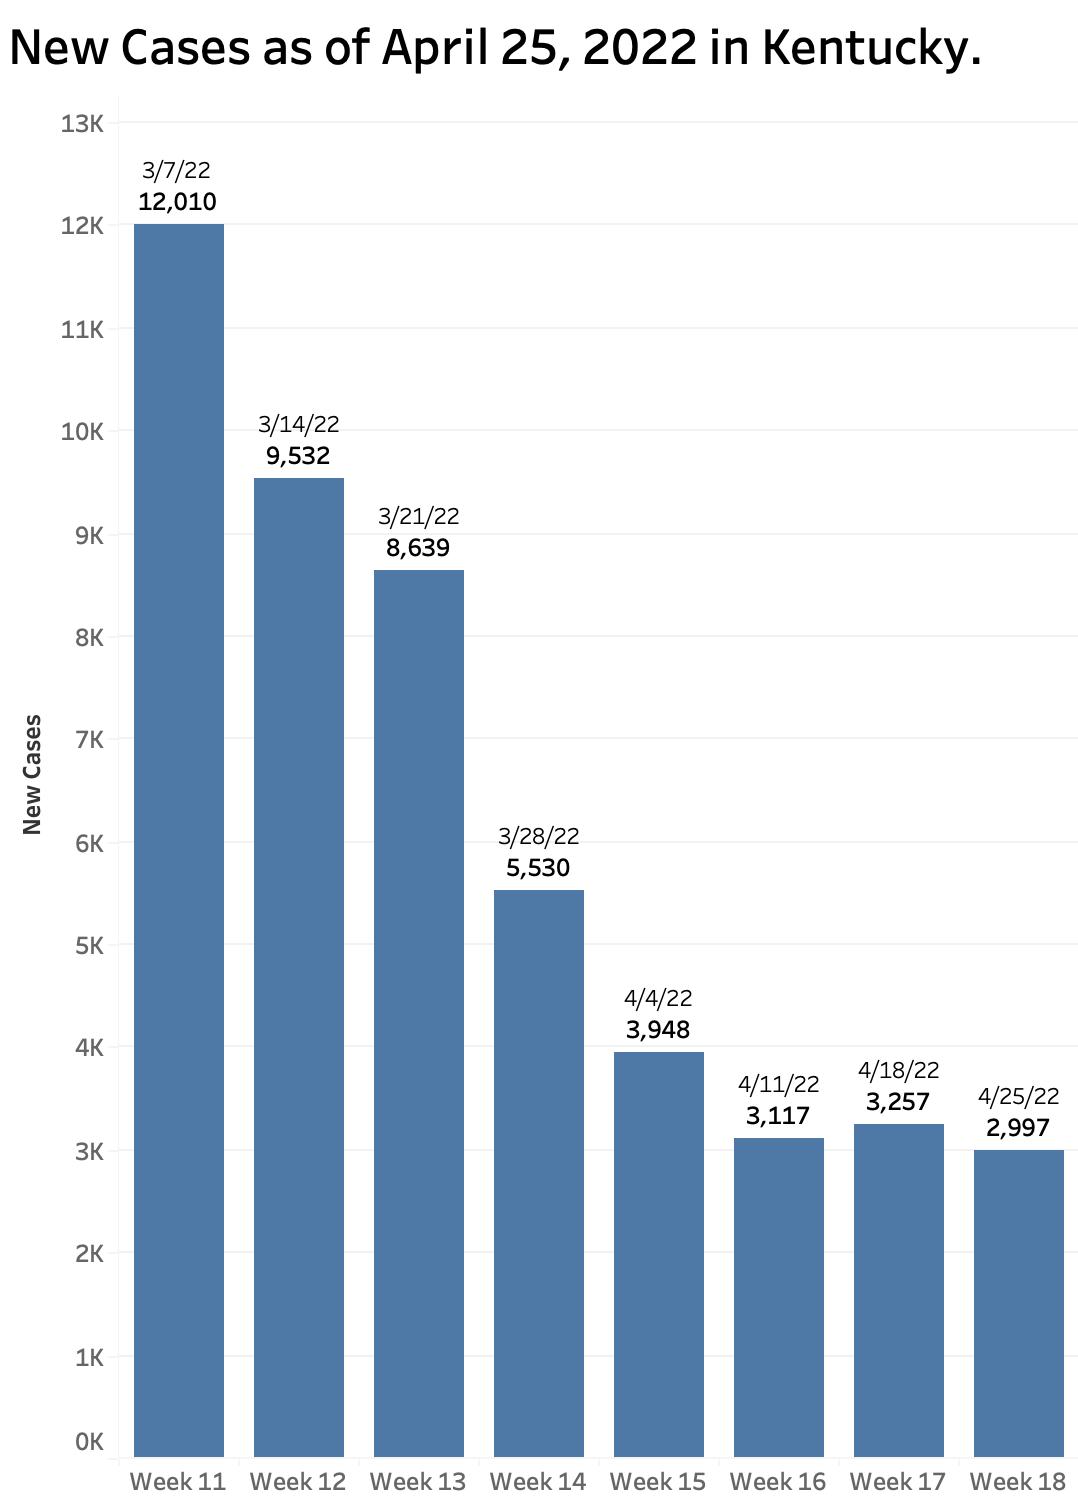
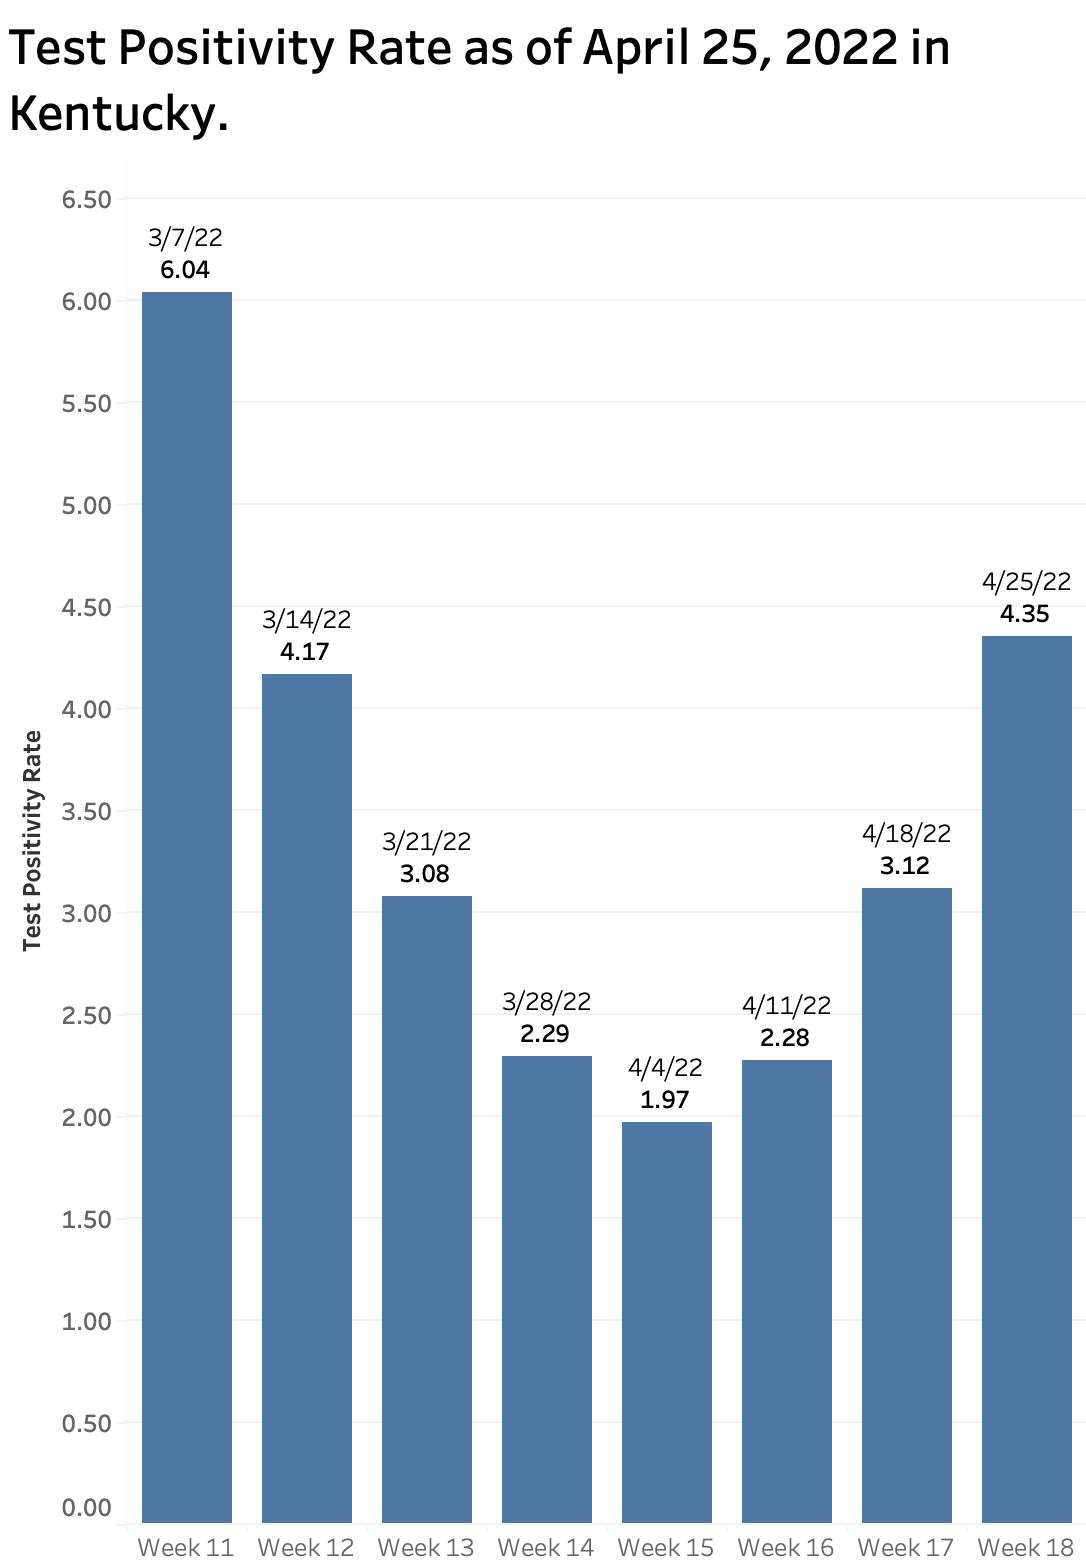
Kentucky’s home-grown report publishes data which; based on my understanding on how the data are collected, interpreted, and reported; seems internally contradictory. On the one hand, the number of new cases for the week has roughly plateaued at about 3000, but the test positivity rate has risen rather dramatically to 4.35 which is the highest since the first week of March! Please refer to the figures below for this and the remaining discussion.
Disease Incidence rates.
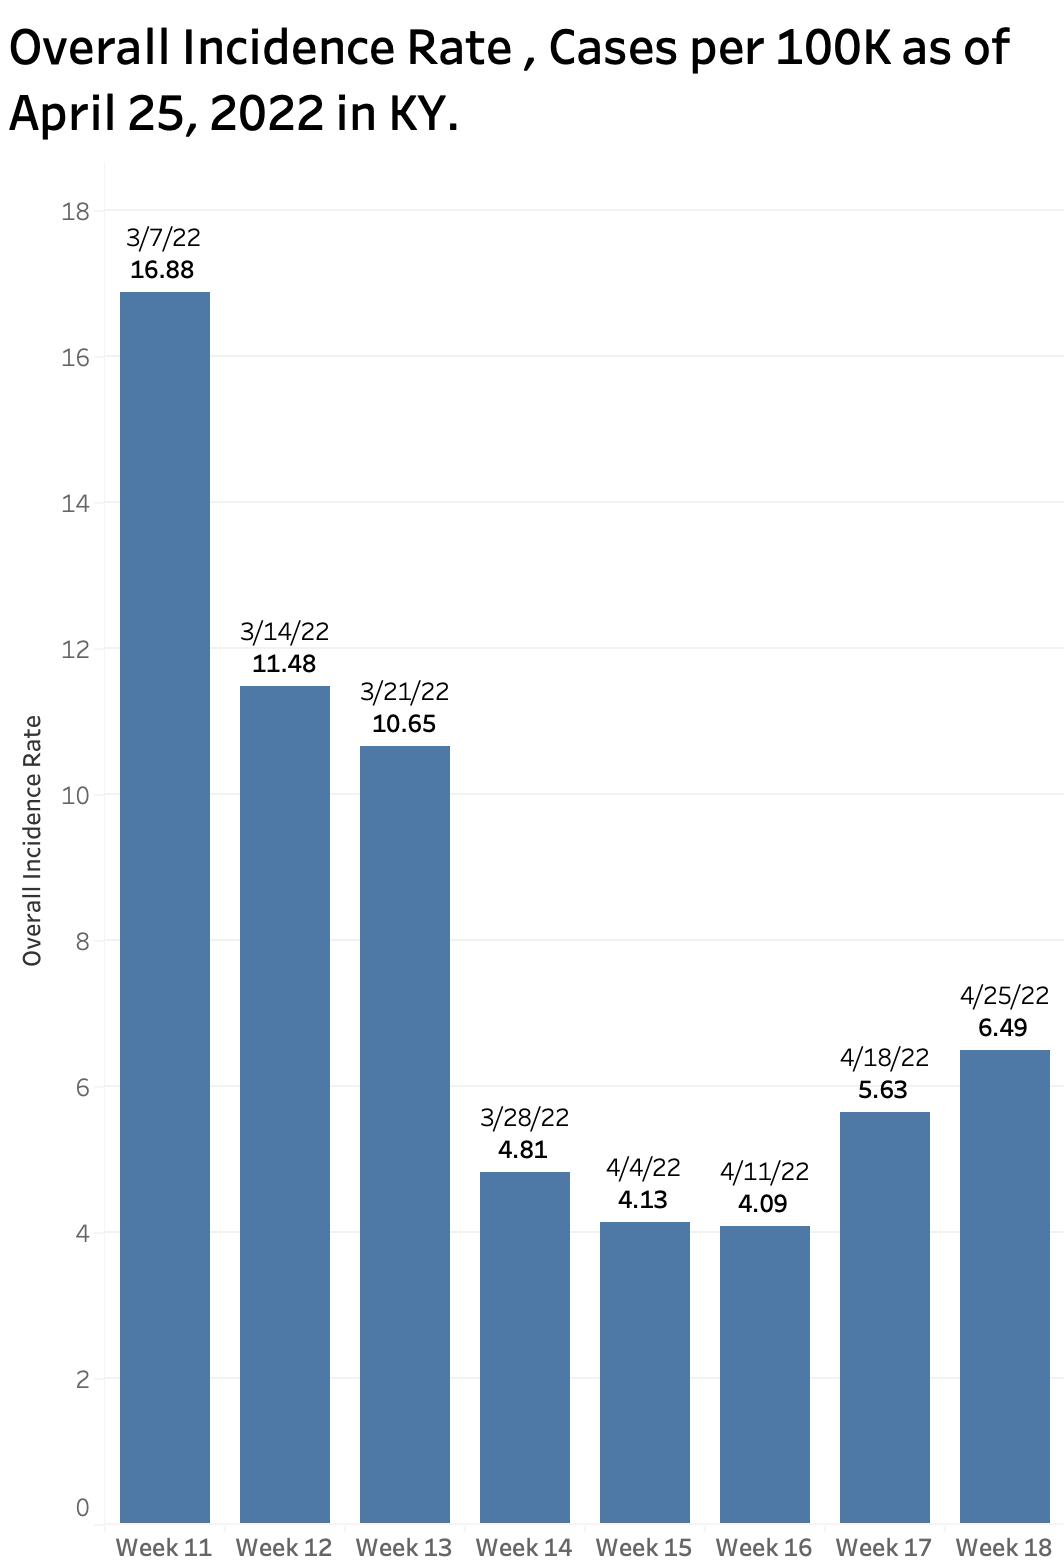
A different indicator of epidemic expansion in Kentucky is suggested by the overall state incidence rate published on the state’s own weekly incidence rate maps. I do not know exactly how the state calculates this result, but it has risen from a low of 4.09 cases per 100K on the report of April 11, rising over the next two weeks to 6.49 yesterday. Using the same definitions it has always used for Kentucky’s own county-specific maps; only 25 of our 120 counties are in the “Low” range, 87 are scored as “Moderate” (1 – 10 per 100K), and the remaining 8 rated as “Substantial” (10-20 per 100K).
The CDC website reports a state-wide incidence rate over the last 7 days of 65.8 per 100K. (Is this an error?) The New York Times, which still has access to county-specific data, calculates an incidence rate over the last 7 days of 10 per 100K of state population. According to the Times, over the past few weeks, some of Kentucky’s counties have been among those nationally with the highest new case incidence rates.
I do not know how to reconcile the differences in the national and state reports. What is perhaps the most transmittable human disease ever experienced in modern history, Covid-19 is expanding in the United States and worldwide. It appears to be expanding again in Kentucky. The test positivity rate, which in my experience has been a reliable and predictive indicator of epidemic expansion in Kentucky, is on the way up again.
What is happening in hospitals?
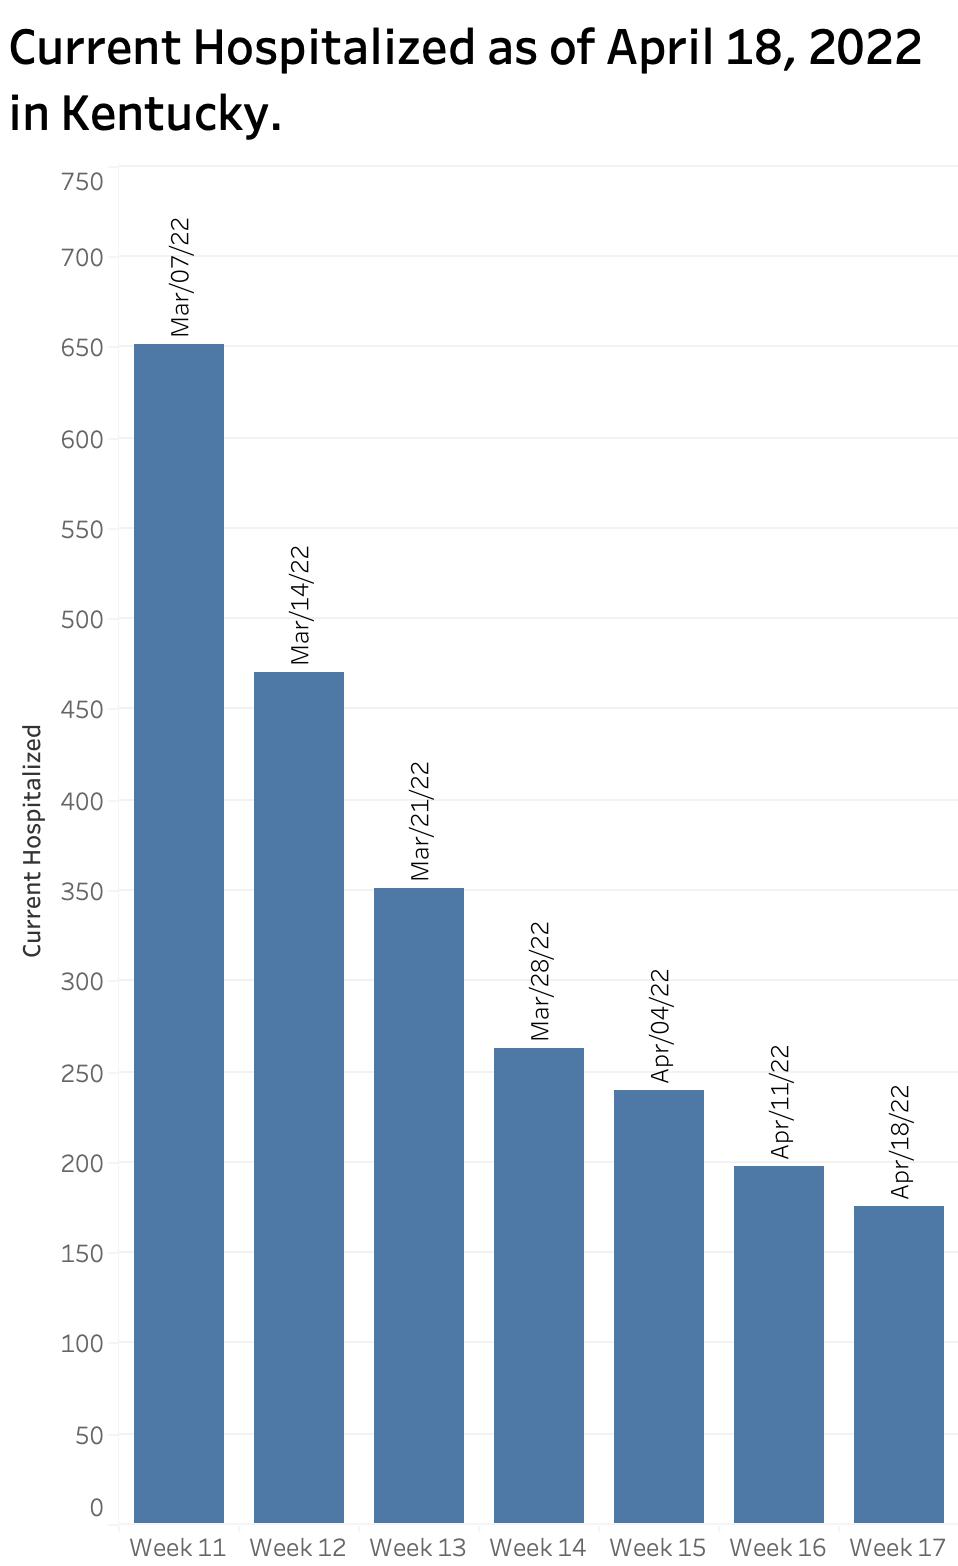
For what is worth, the number of individuals with Covid-19 currently hospitalized yesterday was at a low for the past 2 months of weekly reports. The CDC’s Community Level rating is based largely on hospital admissions for Covid-19 and hospital/ICU capacity. I do not yet have a good handle on exactly what formula is used. Many counties nationally and in Kentucky do not have an acute care hospital of their own. Therefore, the “county” map of Community Levels is based on hospital utilization in other places. The CDC has chosen to divide states into “Health Service Areas” that are not identical to Kentucky’s own COVID “Hospital Regions” nor to the Dartmouth “Hospital Service Areas” (HSAs) or “Hospital Referral Regions” (HRR) commonly used by health policy researchers or other government entities.
As an example of hospital utilization by Covid-19 patients in Kentucky, I refer to a report issued for the week ending September 3, 2021 when the Delta variant was active. (I forget how I came by it!) Kentucky had 90 acute care hospitals. However, 28 of these were Critical Access Hospitals, a special designation by Medicare which exempts them from some reporting requirements and still pays them based on their costs. However, by law they can have no more than 25 beds, no ICUs, and have strict limits on severity and length of stay. It should be no surprise then that the 28 smaller critical access hospitals had a total 7-day average daily census of only 60 adult patients with Covid compared to 2300 patients in the remaining 62 short term acute care hospitals. Of these 62 “regular” acute care hospitals, the ten hospitals with the most Covid-19 admissions made up 40% of their total. Nineteen of the 28 Critical Access Hospitals had no Covid-19 patients at all!
The limited distribution of hospitals dilutes the geographic precision of the CDC’s Community Ratings. This, on top of other changes in national reporting that impair the timeliness of data seem to me to handicap the ability of those responsible for the health of the public do keep up with the disease. Time will tell if we are on the right track.
Perter Hasselbacher, MD
Kentucky Health Policy Institute
26 April 2022