
Mixed results at Robley Rex Hospital in Louisville but mostly better than average.
I recently commented about the reaction in Washington to revelations that veterans trying to get appointments at VA medical centers were facing long waits and that utilization data for at least a handful of centers had been altered to make them look better than they were. I was subsequently asked how our local Robley Rex VA Hospital in Louisville stacked up against others. While I have heard good things in support of the Louisville VA from veterans at public hearings, and while the hospital has done well in national accreditation and quality surveys, I had no specific information about waiting times. The release of national patient access data from the Veterans Administration in Washington gives us something to go on and will be presented below. In brief, our hospital has little to be ashamed of, but the data as presented are not easy for me to interpret.
One of the pitfalls in analysis of data-dumps like this one is that without knowledge of exactly what is being counted or measured, how items are defined, or the operational measures used to assemble the data; the robustness of any conclusions may be compromised. My lack of day-to-day working knowledge of how appointments are actually made at VA hospitals or how the various lists of waiting times were compiled for this report limits my confidence. Nonetheless, assuming the data from the various medical centers has been collected in the same way, an overview and some rough comparisons seem reasonable.
The report.
The Veterans Administration report of June 19, 2014 available to me is in a PDF format and broken into two parts making comparisons and analysis difficult. For my use and yours, I converted the two PDF tables into a single Excel table. The database covering 141 Veterans Medical Centers and their associated on-site and satellite outpatient clinics can be sorted for any one of the 28 different enumerated items in the Table version. (Click on the little arrow in the column headers to rank the table for that item.)
An Example:
I extracted an easily understood data item– the percent of all current (existing) appointments scheduled more than 30 days from the “reference date,” listed in column F. (The reference date is defined as the “create date” for new appointments and the “desired date” for established patients.) For the Robley Rex Hospital, that figure is 6.9% of the 49,230 total scheduled appointments, or 3,386 patients/appointments. Having a lower percent is better and in this respect, only 39 centers had a lower percent waiting longer than 30 days. Of these, only 11 centers had lower than 5%.
I wondered if larger centers might have more trouble keeping waiting times under control. To try to put things into perspective, and assuming that centers with more appointments would be larger ones, I plotted the proportion of appointments over 30 days as a function of the total number of appointments scheduled. In the chart below, the red dot depicts the Robley Rex Hospital.
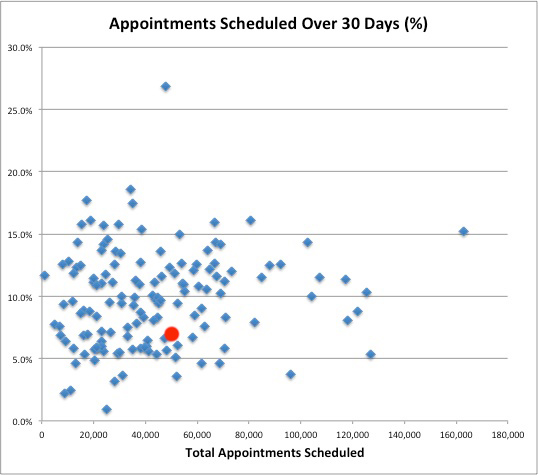
Inspection tells us that our hospital has a higher than average number of appointments on the books, but a lower than average number scheduled over 30 days as defined.
What do the outliers tell us?
Most useful data sets will suggest more questions than they answer. It is always useful to consider outliers. For example, why does Fayetteville NC (whose data point is at the very top of the graph) with only an average number of scheduled appointments have more than 25% of its total appointments scheduled over 30 days from the reference date? Is it bad management? Too many patients for the resources provided? A bookkeeping error?
Gainesville FL is depicted the point furthest to the right with the highest number of total appointments – around 160,000. Fully 15% of its appointments could not be scheduled within the 30 day target. In the lowest right corner with about 100,000 appointments, the VA Medical Center in Boston has only about 4% appointments with wait times over 30 days– one of the very best. What are they doing right (or wrong)?
What’s going on at those medical centers with greater than 15% over 30 days? These include Fresno CA, Boise ID, Texas Valley TX, Central Alabama, El Paso TX, Roseburg OR, Salt Lake City UT, Phoenix AZ, Altoona PA, VA Boston HCS Columbia, SC, or Gainesville FL? How do these centers differ from Butler PA, Coatesville PA, Wilkes-Barre PA, New York Harbor HCS NY, Altoona PA, VA Boston HCS MA, Columbia MO, West Palm Beach FL, Erie PA, or Canadaigua NY which all score less than 5%? What is going on in Pennsylvania with all those low-wait centers (by this measurement) while in Philadelphia the number is 12.2%
Electronic Waiting Lists (EWL)
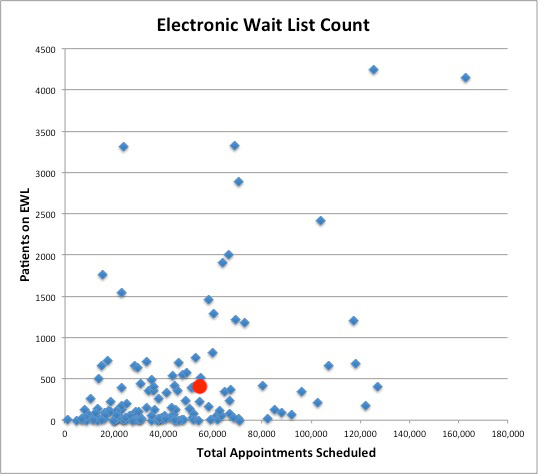
Another cluster of measurements focuses on the Electronic Waiting List Count. This is the number of all new patients not seen in a specific clinic in the previous two years for whom appointments cannot be scheduled. [The report footnote for this item is incorrect and/or misleading. The reported figures appear to include all patients on the EWL list, not just those waiting longer than 90 days for an appointment. The assistance of our readers would be appreciated.] Here the Robley Rex Hospital performs less well than average. It has 572 patients on its EWL as defined and reported. Only 25 other centers have more patients on their EWL’s. (Even Philadelphia has only 347 in its reported EWL count.) I confess I do not fully understand the differences between the EWL and the appointment counts. I assume that patients on the EWL do not yet have any appointments at all.
Below is a plot of EWL count as a function of total appointments. Robley Rex does not sit near the baseline as most of the other centers do. Additionally, the range of scatter is greater than the plot of appointments above.
What is the problem with those centers with more than 1500 individuals on the EWL? These include Middle Tennessee, Gainesville FL, Roseburg FL, Denver CO, Portland OR, Orlando FL, Phoenix AZ, Northern California, and Boise ID. How is it that Long Beach CA, and Bay Pines FL with almost the highest number of total appointments have fewer than 500 on the EWL?
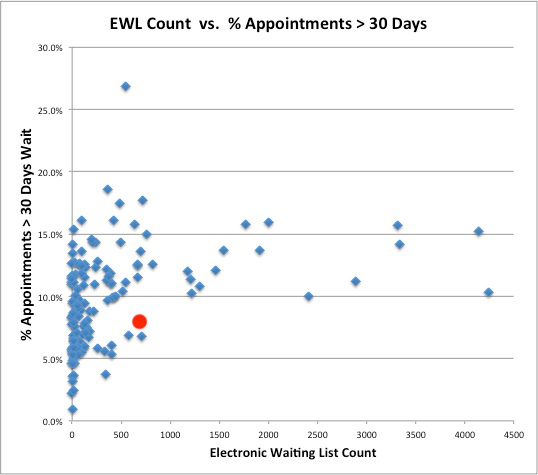
Are EWL counts and delayed appointments correlated? Does a Center with a problem on one measure have a problem with the other? I plotted the number of appointments beyond 30 days agains the AWL count. The overall correlation was poor. However, all of the Centers with more than 1000 patients on the EWL had more than 10% of their appointments delayed more than 30 days beyond target. Without any knowledge of how these figures are generated, I can say nothing more.
And the rest of the story.
Most of the rest of the data breaks down the number of delayed appointments or EWL counts into various time intervals. I do not really know how to interpret these data. At the Robley Rex Hospital there are significant numbers of patients with appointments beyond 120 days. What does this mean? Is it the fault of the Center, or does patient behavior or preference play any role? What specific clinics are involved? Is this a management or efficiency problem, or one of scarce resources? Concerned minds would want to know.
Waiting times continued.
The data set also reports average waiting times for new and established patients to see a primary care professional, for specialty care, and for mental health care. Robley Rex Hospital does pretty well here. Waiting times for a new patient for a future primary care visit average 25 days with only 21 hospitals having shorter times. Waiting time for new specialty care averages 50 days but is worse than average – 90 hospitals do better. Waiting times for new patients for mental health services averages 19 days with only six hospitals doing better. Mental health waiting times for established patients averages 2.3 days.
Data by the bucketful!
The Veterans Administration plans to release reports like this one every two weeks to demonstrate any progress being made. Hopefully, any issues of falsification or uniform data collection are being addressed. For this current iteration, some things actually seem to be getting worse, perhaps in part because of better record keeping, but also perhaps because more veterans are aware of their improving options and are signing up for appointments in larger numbers. If I can muster the time, I will prepare a spreadsheet with all of Robley Rex’s data extracted and ranked. Let me know if there is any interest.
This is an area in which I clearly need some help. How about it? Comment publicly– anonymously or not– or send me a private email from the sidebar. Let me know also if there is any problem with the files.
Peter Hasselbacher, MD
President, KHPI
Emeritus Professor of Medicine, UofL
Former VA Physician in Philadelphia, White River Junction, and Louisville.
June 24, 2014
Downloads:
Original Report from Veterans Administration of 6/16/2014 (.pdf 597 KB)
Peters Conversion of PDF document into Excel Table. (.xlsx 91 KB)