
The jointly managed state and federal Medicaid program has always been an important part of the American patchwork healthcare system. The Medicaid expansion of the Affordable Care Act and other changes to eligibility have not only increased the number and diversity of Medicaid beneficiaries, but also Medicaid’s potential financial and clinical ability to shape other healthcare segments in the same way that the Medicare program has done. However, not all of Medicaid’s structural practices may be worth promulgating. I suggest that the way Medicaid has chosen to select eligible drugs for its formularies nor the way its has paid for them are worthy of emulating. To start a new thread in these pages, I begin with a survey of drugs prescribed to Kentucky Medicaid beneficiaries in 2014. I freely admit that I will be learning along with my readers who I hope will participate in the process of exploration and understanding.
I will demonstrate an overlap in the use of drugs by both federal programs but also illustrate major differences. It will be obvious that many beneficiaries who are excluded from employment-based or ineligible for Medicare coverage are dependent on Medicaid for their health care. You might even become more concerned about recent promises to reverse Medicaid expansion and cut its roles. I will highlight the extraordinary cost of some new drugs such as those for the curative treatment of hepatitis-C. I will show that the cost to the system of every-day commonly used drugs overshadows that of the high-flying cancer drugs that are frequently featured in our news reports. You may be surprised to see how frequently opioid narcotics are prescribed. You should be concerned about the exploding costs of necessary and successful medically assisted drug treatment for opioid addiction. You will be as surprised as I at the personal and financial burden of depression and other mental disorders. Finally, you will probably be disappointed and maybe even a little angry about how little our public policy seems to be guided by the prevalence of the illnesses that most frequently affect us.
Quick overview of the complex data structure.
The Centers for Medicare and Medicaid Services (CMS) has been releasing, or perhaps better said, dumping prescription drug utilization data for some time. I find it even more difficult to unravel the Medicaid reports than the Medcare Part-D data that I have been working with this past year. I cannot even find a document that details what data is included and what is not. For example, I assume inpatient drugs are not included, but I have not yet been able to determine if drugs given to nursing home residents are included – I suspect they are not. In the remainder of this article, I will discuss Kentucky-specific entries extracted from the national database.
A single drug will have multiple line entries. The Kentucky data set alone has some 106,000 entries for 3,152 different drug names. Every single prescription strength, form, or packaging has its own line-item. Generic forms of the drug and brand names are treated separately with no easy way to link them. Total reimbursement for every line item is broken down into the amounts paid by Medicaid and the remainder paid by others. Data is presented for each quarter of the year. Additionally, every entry is further subdivided by whether the item was prescribed for Medicaid Managed Care or Fee-For-Service beneficiaries! While it is possible that this complex database structure can yield insights (for example, comparing reimbursement for Managed Care vs. Fee-For-Service) for the purposes of this article, I have rolled up all the information by drug name with the understanding that brand names of a generic drug will have their own listing.
Data presented for your inspection.
As I did for the 2013 Medicare prescription data, I prepared TreeMaps with a data cell for for each individual drug, ranking them by number of prescriptions or total reimbursement. The drug name and data underlying each data cell can be explored in the online interactive versions. Static images are also presented including bar graphs of the top 60 drugs by prescription volume and total reimbursement. I made an ad-hoc attempt to break down the top-60 lists by their therapeutic categories. An Excel file with the entire data set behind the TreeMaps and lists are offered for your use. Despite the complexity of the data, some striking findings of interest or of concern become self-evident. Links to the corresponding tab in the on-line interactive charts are provided in each heading. The thumbnails below conceal links to a larger static image.
Frequency of prescriptions.
Hydrocodone and gabapentin for pain or other uses lead the pack, costing Kentucky $8.1 and $16.3 million respectively. As was the case with Medicare, a relatively small number of drugs make up half of all the prescriptions written. For the most part, these would be used to treat the bread-and butter-diagnoses that present to a provider’s office. A breakdown of the top 60 most frequently prescribed individual drugs is available in Tab 3 of the interactive data visualization.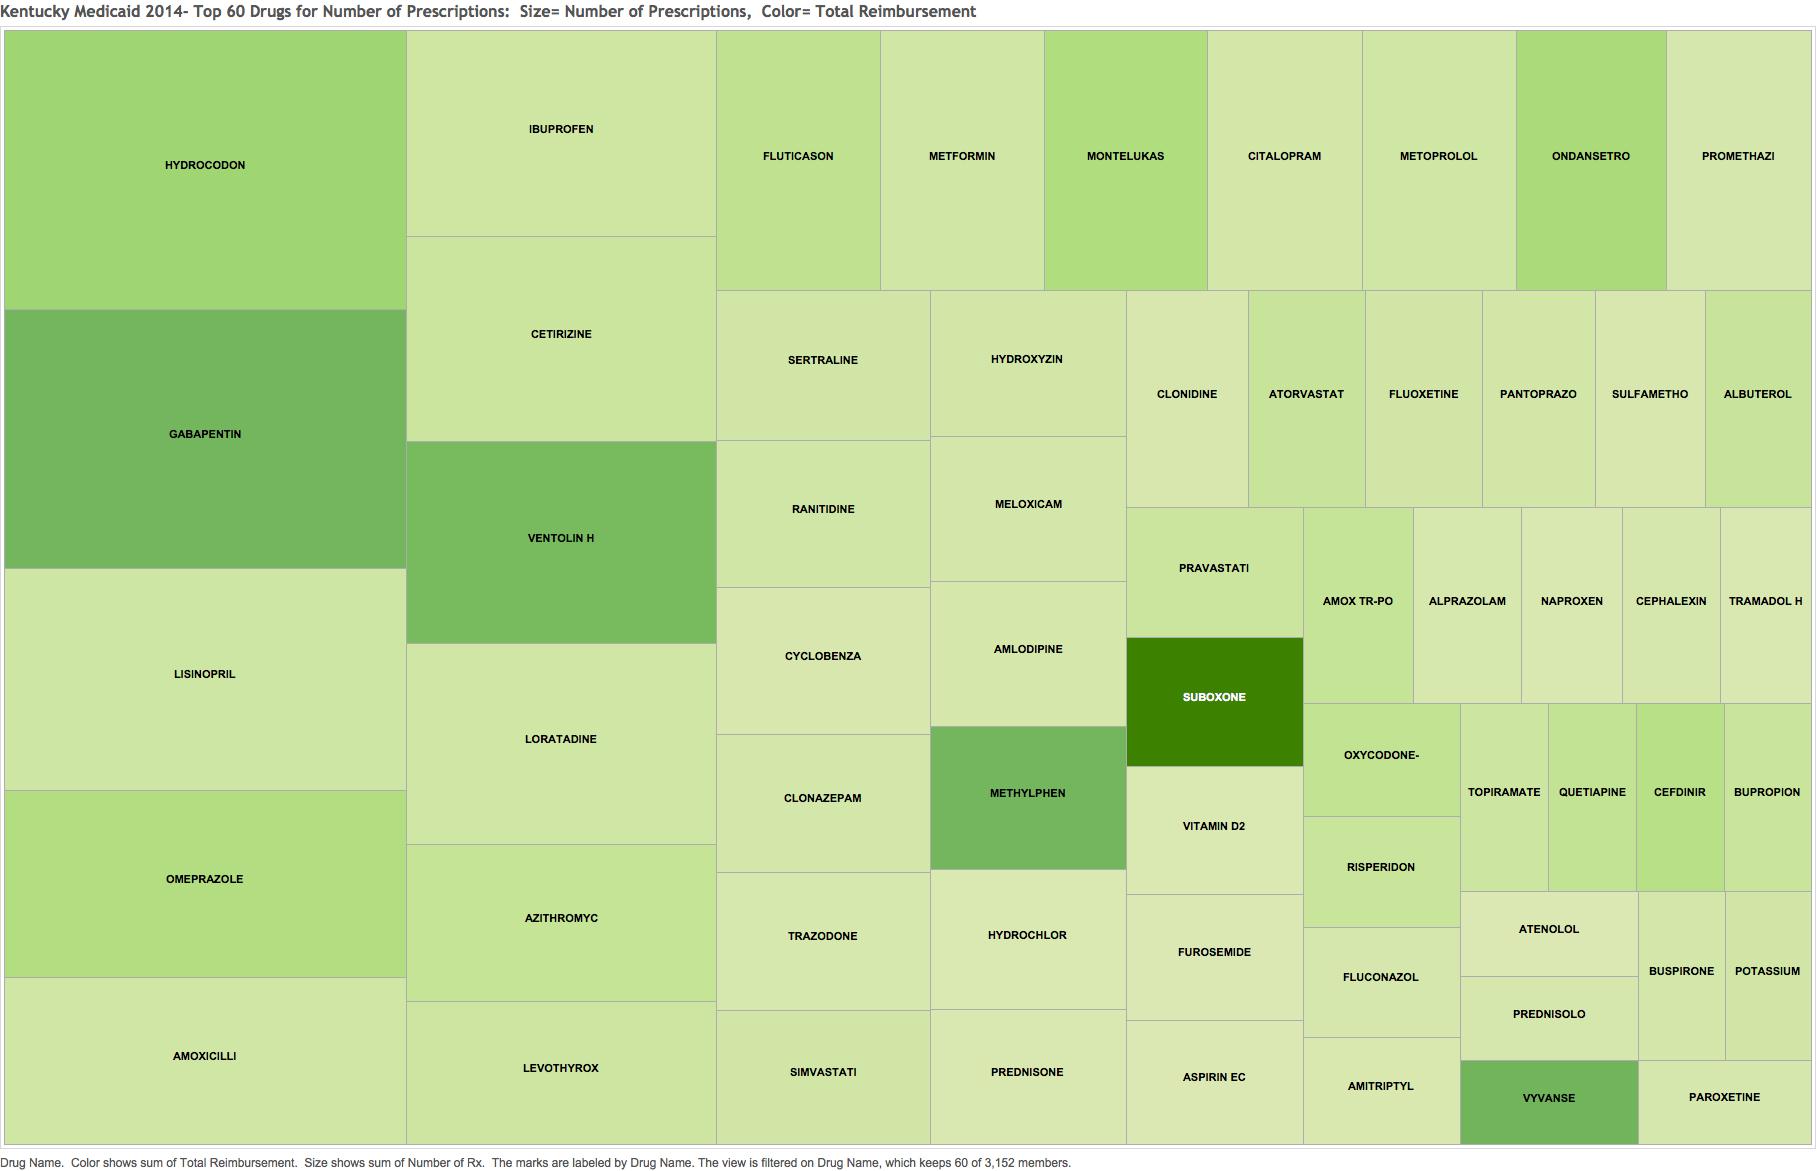 Note how Suboxone, a drug increasingly important for the treatment of opioid addition stands out for its cost at $29.7 million despite its relatively lower frequency of prescription.
I cannot personally understand why gabapentin is the second most prescribed drug for Medicaid patients. Please someone ‘splain it to me!
Cost of prescriptions.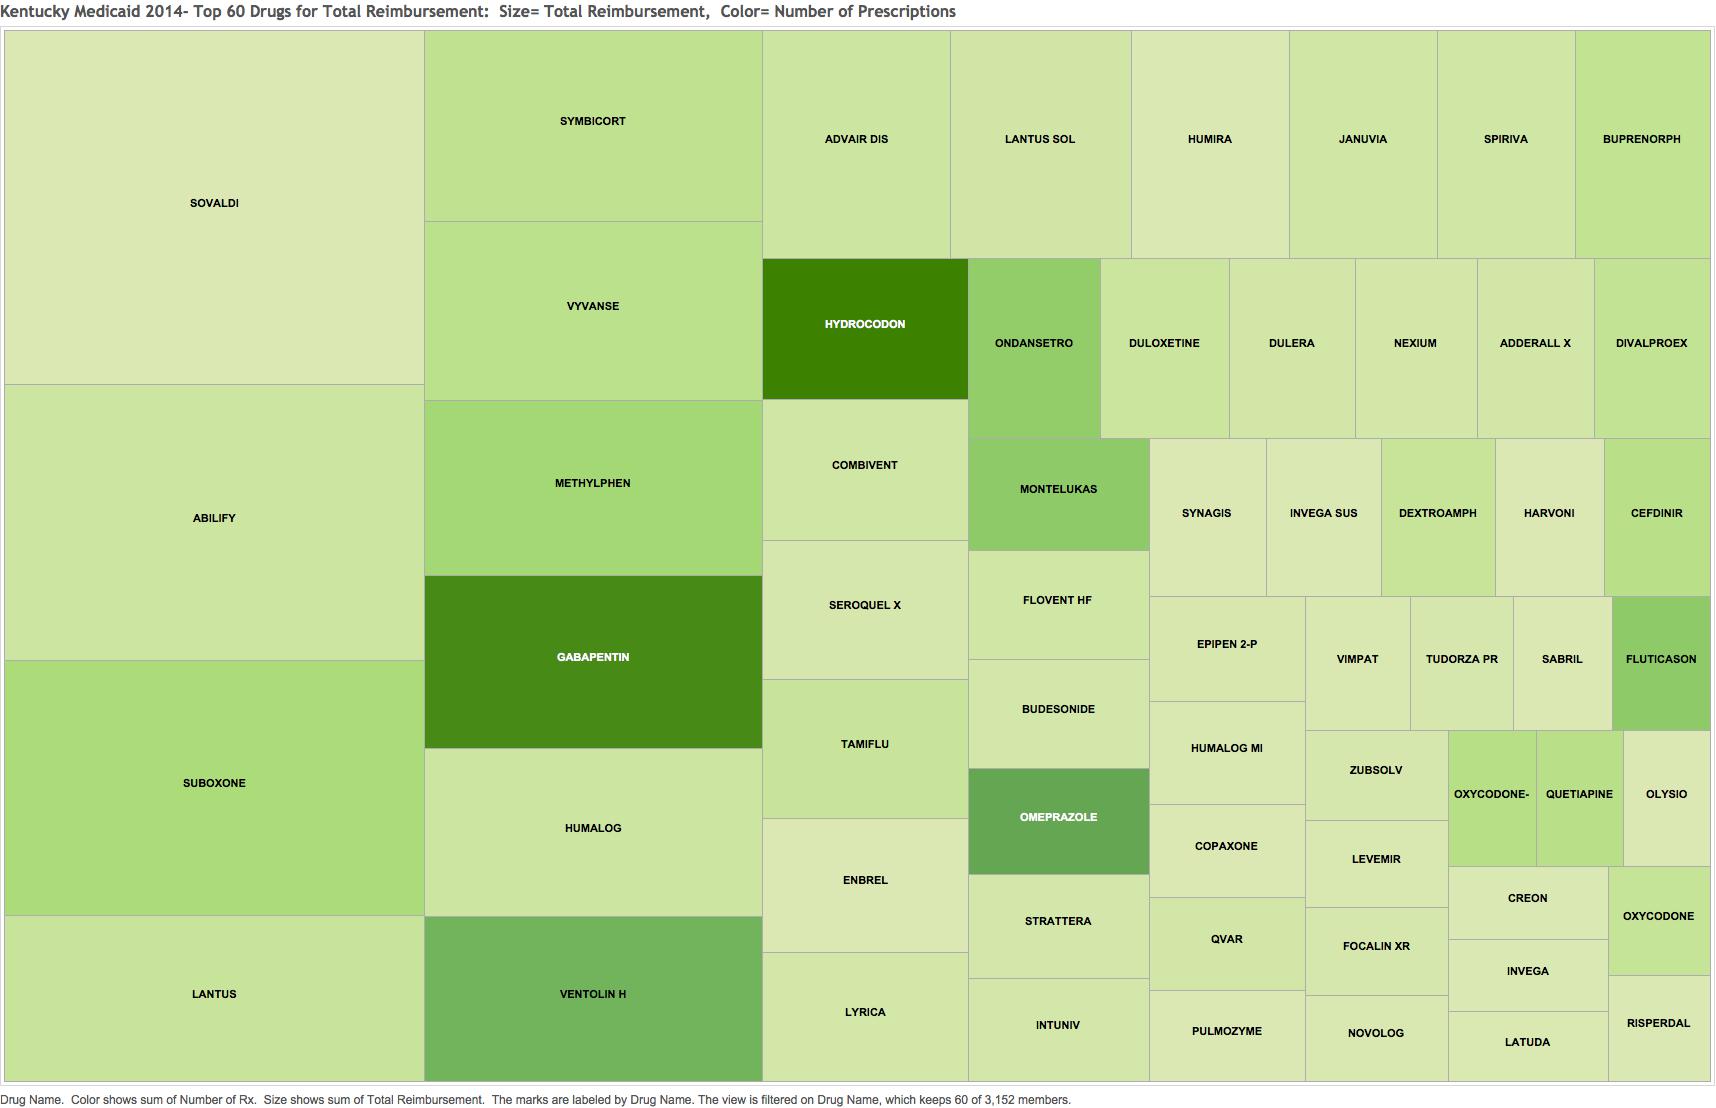
Would you have guessed that Sovaldi for hepatitis-C at $41.2 M; the branded version of the antipsychotic Abilify at $32.2 M; or the opioid addition treatment drug Suboxone would lead the list of total reimbursement? The fact that one version of the human insulin Lantus is number 4 and that the frequently prescribed inhaler of Ventolin for asthma and COPD is number 10 should be a startling wakeup call for us all. Something is wrong in the state of Denmark Kentucky. Tab 4 on-line depicts the top-60 drugs most expensive for the Medicaid program.
Tab 7 presents a bar graphs as a different view of the top 60 drugs in each of the two categories: number of prescriptions and total reimbursement.
Average reimbursement per prescription. 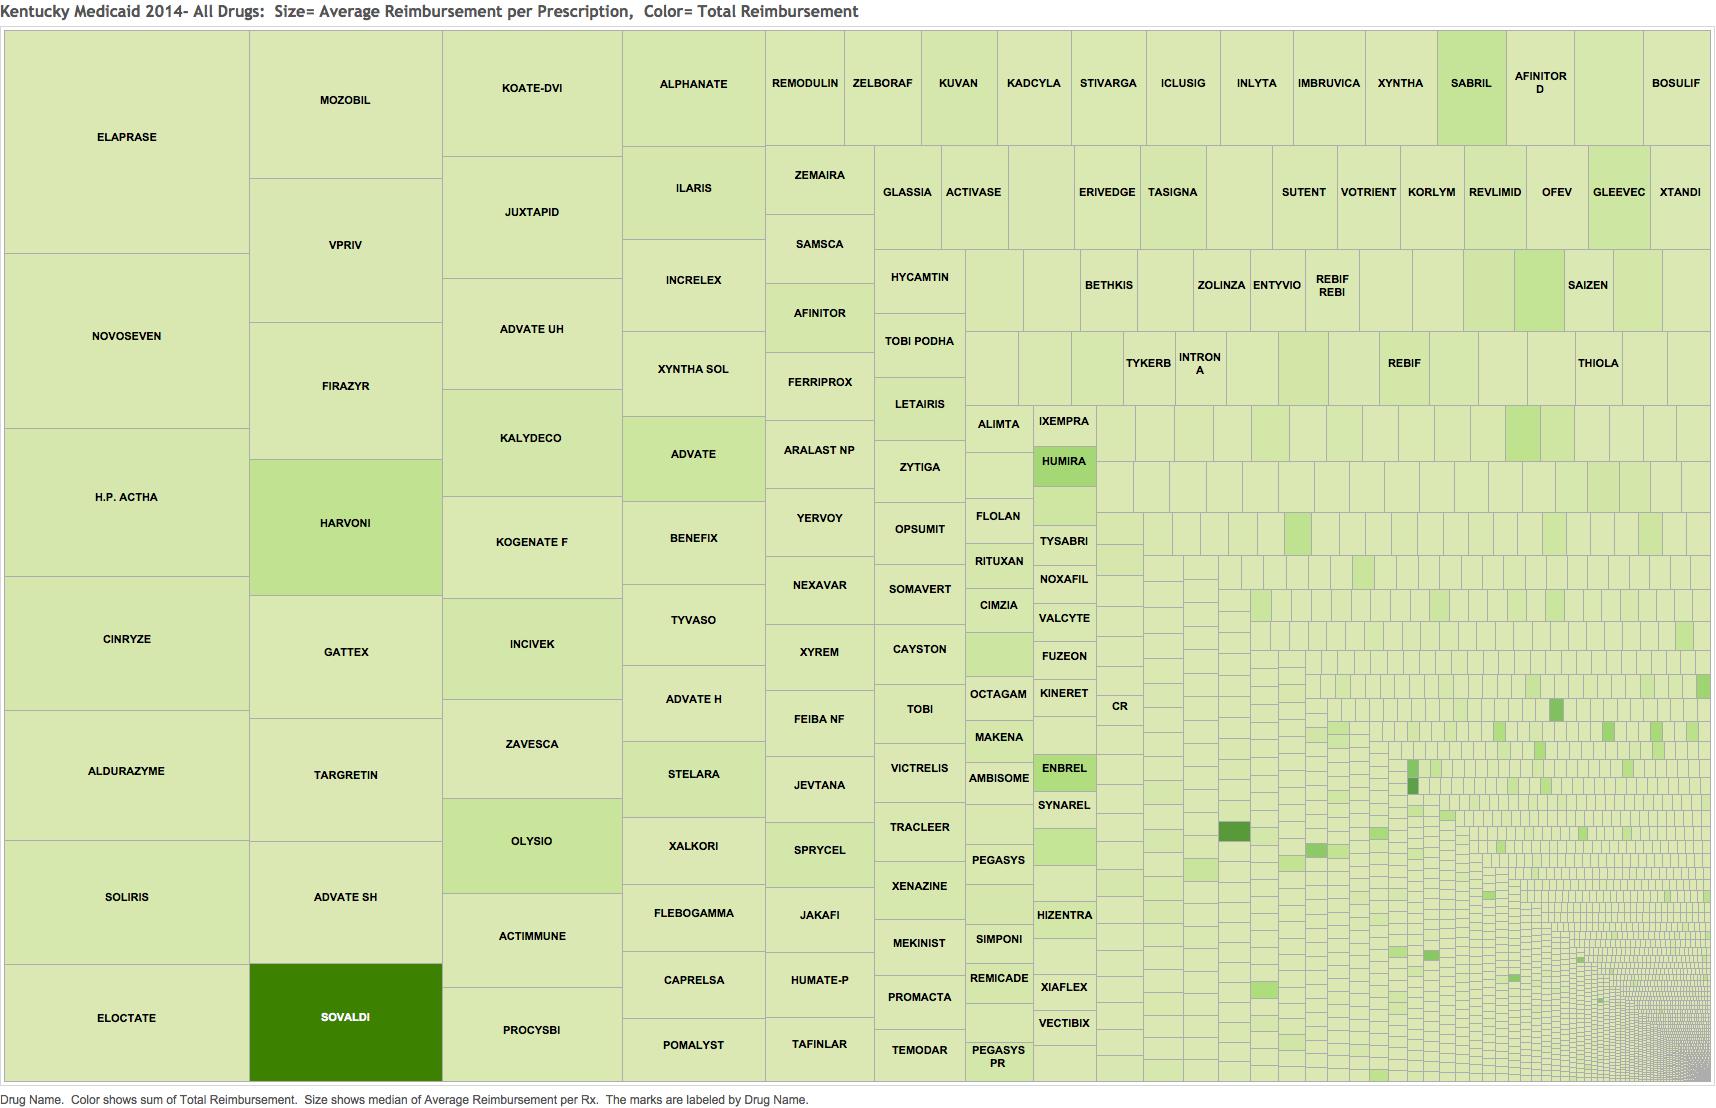
I could be being led astray here, but I calculated an average cost per prescription by dividing the total reimbursement by the number of prescriptions written for each drug name. Tab 6 breaks out the highest 60 of these. I recognize that given the multitude of dosage and package forms, that distortions are certainly occurring in this latter calculation, but in the broad sweep of things I think some useful insights become available. First-off, I recognize the names of almost none of the drugs in the left half of the graphic! Mousing over their data cells reveals these to be drugs used only a handful of times in a year but which are very expensive. Such drugs might be used to treat rare inherited metabolic disorders. I do not recognize any of them as cancer drugs! Only the hepatitis drugs Sovaldi and Harvoni are familiar to me and they are beginning to get some use. I am mystified by the presence of the product H.P. Acthar Gel. This is a preparation said to have adrenocorticotropin activity, a pituitary hormone that stimulates the adrenal glands to make cortisone. It was administered 20 times in 2014 for a cost of $917,071. It is one of those controversial drugs whose manufacturer jacked the price up 1o-fold but whose benefits are unclear to dubious at best. I fear it may be a money-maker for the physicians who prescribe it. I hope not. In the early days of my specialty, it was given to people with rheumatoid arthritis with the hope that it would lend the benefits of steroids to these patients without all the dreadful universal side effects of steroids such as prednisone. It proved of no advantage and exposed patient to the risk of some terrible neurologic diseases of the mad-cow variety and others. I have not personally heard of its use in the last 40 years for this purpose. I cannot easily find how it is produced today. The drug is currently also being prescribed to Medicare patients at the same high cost. Can anyone tell us why?
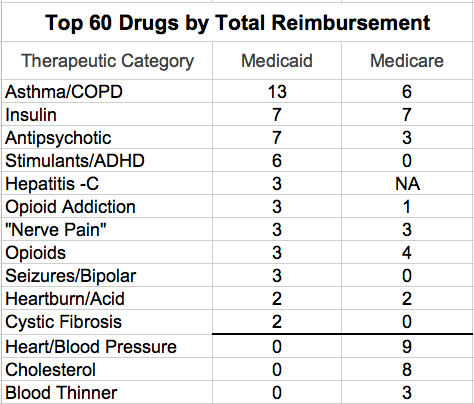
Therapeutic Categories.
We should expect to see a different profile of drugs prescribed for Medicare and Medicaid beneficiaries. For example, the following table lists the number of the 60 most prescribed drugs for a given therapeutic category. (These categories were assigned by me on-the-fly and were assisted by what Google says! Many drugs have several different therapeutic uses and I have no idea which predominates in general practice.) Thus, we are not surprised in the Medicare population with its older beneficiaries, that drugs for cardiac disease and hypertension, blood thinners, and cholesterol as a group are more frequently prescribed. In the younger Medicaid population, many more antibiotics, nonsteroidal anti-inflammatory drugs (NSAIDs), anti-histamines, and stimulants are prescribed. Drugs for Alzheimer’s disease, osteoporosis, or prostate and bladder symptoms (not listed below) are unique to the Medicare list.
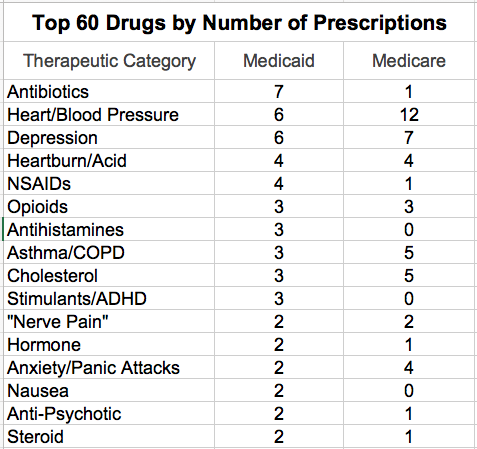
Nevertheless, the Medicaid and Medicare lists obviously overlap in several therapeutic categories. Sadly, I was not surprised to find the opioid hydrocodone to be the single most frequently prescribed drug in both programs. Indeed, three of the top 60 drugs in both programs were for prescription opioids. We are awash in opioids. No drug has led to the general societal misery we are living with today as users, families, or victims of consequent crime. I confess that I did not expect to see so many of the top drugs being prescribed for depression, or for that matter, other psychiatric diagnoses such as psychosis, anxiety, panic attacks, bipolar disease, and the like. Fully 12 of the top 60 drugs in both programs were for drugs affecting the central nervous system and I am not including CNS stimulants or Alzheimer drugs in that group! I was frankly alarmed at the frequency of stimulants prescribed for Medicaid beneficiaries. These are used for hyperactive children or attention deficit syndromes in both children and adults. While there are some legitimate uses for such drugs, many concerns have been expressed about their overuse in children, and about their diversion and abuse by students and adults alike. I can’t believe their use is even largely medically indicated.
Other comments about frequency.
Asthma and chronic pulmonary obstructive disease (COPD) are prominent in both utilization lists. I was surprised to see allopurinol, a drug used to treat gout, appearing in the top 60 Medicare list. At one time, it could be said that I was an international expert in The Gout, a form of arthritis. In my opinion, gout was the most imperfectly diagnosed of all the varieties of arthritis. Allopurinol is an essential drug to treat the high uric acid of patients with gout, but it is not without its uncommon and even lethal adverse reactions. I was also surprised to see how frequent and expensive anti-nausea drugs were. There were no cancer drugs on either the frequency or reimbursement Medicaid lists, and only 2 of these on the Medicare cost list. Everyday bread-and-butter conditions soak up the costs of the top 60 drugs.
Cost magnifies the difference between Medicaid and Medicare.
Breaking down of the lists of the top 60 drugs with the highest total reimbursement also reveals both unique profiles and overlaps. The staggering cost to our society of some of these drugs should drive public health policy and health care legislation. For example, even though it was only available for the last three quarters of 2014, the drug Sovaldi (used to treat hepatitis-C) became by far the single most expensive drug prescribed for Kentucky Medicaid beneficiaries. (Of note, there are also two other new drugs for hepatitis-C among the top 60 most costly Medicaid drugs!) Sovaldi was not available to be included in the 2013 Medicare data that I have been using. It will be interesting if not frightening to see where these drugs fall out in the upcoming 2014 Medicare drug utilization report.
Therapeutic categories by total reimbursement.
When the top 60 drugs by total cost are broken down by therapeutic category, differences between the two federal programs are magnified. For example, Medicaid has only 3 drugs in the Asthma/COPD therapeutic category list above for number of prescriptions, but 13 in the table of the 60 most costly below. On the other hand, Medicaid has 6 of the top Heart/BP drugs and 3 cholesterol drugs by volume, but none of the top 60 by total reimbursement.
It would be improper to go to far in comparing these two Therapeutic Category tables. Is the utility profile of individual drugs different within the two populations? For example, generally younger Medicaid patients with hypertension may do well on simpler and less expensive drugs. On the other hand, Medicaid and Medicare have long used different approaches to managing utilization and cost of the drugs used by their beneficiaries. Some decades ago, Medicaid made an agreement with the pharmaceutical industry that allowed all brand names to be included in its formularies in exchange for periodic drug utilization reports (of dubious utility in my opinion at the time), and rebates (perhaps another word for bribes). In Kentucky, the cost of drugs to the Kentucky Medicaid program skyrocketed immediately after the new agreement leading me at the time to wonder if we had not made a deal with the devil. It seems to me today that the administrative programs governing Medicaid drug utilization and pricing are impenetrably complex. I certainly do not yet understand them.
Clear air — Why not?
For Medicaid beneficiaries, the single most expensive drug category by far was that of asthma and COPD. My immediate thought was how easily we were convinced here in Louisville to eliminate testing of automobile emissions and how hard our state government fights against clean-air regulation! We pay for Kentucky’s pollution with both our health and our wealth. For these pulmonary disorders, we pay dearly in our tobacco- and coal-loving state. One of the Kentucky Medical Association’s four high priorities for the current legislative session is the passage of a bill prohibiting smoking in public places. I do not expect it to pass.
Random Musings.
Insulin. Why so expensive?
I was frankly stunned at how expensive the seven forms of insulin were for both Medicaid and Medicare. In the old days, when insulin was extracted from beef and pig pancreas, my recollection is that it was not particularly expensive. It then became possible to genetically-engineer actual human insulin from yeast. This diminished the allergic and immune reactions that some people had to the foreign animal hormones. You would think that by now, when there are seven or more different forms of human insulin – some of which have available for more than two decades – that the price would have dropped some. Obviously that is not the way our congressionally-engineered drug pricing system works. It is not just the diabetics among us who are paying the freight.
Pain, pain, and more pain.
The use of drugs for pain of all kinds; including that of “nerve pain” muscle spasm, and the poorly differentiated, unexplained, and emotionally amplified pain syndromes; is both rampant and expensive.
The Ying and Yang of opioid use.
I have no evidence in hand that prescriptions for opioids are decreasing, but it is clear that the opioid derivatives used for the treatment of opioid addiction are on the rise in a big way. I do not disagree that as it should be. However, for Medicaid, the drug Suboxone is the third most expensive drug for the program and its cost per prescription is also high. Its active opioid-substitute ingredient, buprenorphine, is number 16 all by itself. Medication-assisted treatment of opioid addiction with drugs such as Suboxone or methadone appear to be the most effective and life-saving approaches available, but in my opinion it is clear that some practitioners are abusing the system. For example, in 2013 Kentucky Medicare, the prescriber with the highest reimbursement per patient by far was a family physician treating drug addiction. The message to us all should be that while offering more and effective treatment for addiction is essential, as it is for drug treatment for hepatitis, it may break the bank unless we collectively come to grips with how drugs are used and priced. We cannot afford to let treatment of drug addiction become the next gold mine for the pharmaceutical industry or the practitioners.
Why are inhalers for asthma so expensive?
I couldn’t believe how expensive the drugs for asthma and COPD have become. This is another area where I and others believe the prices for drugs have been manipulated upwards by the pharmaceutical industry. They used to be relatively cheap. Must we accept these exorbitant prices because they are the result of free-market forces at work, and therefore that such prices must accepted? Will the new John H. Schnatter Center for Free Enterprise at the University of Louisville’s College of Business be able to convince us that this exercise of free enterprise will benefit the well-being of individuals and society? Not this tilter at windmills.
We remain the Prozac nation. Opioids are by no means the only legal drugs that drag us down.
At that—enough for now.
I confess again that I have never heard of many if not most of these drugs and had to look them up. You will see things that I could not. What are they? What makes you angry or happy? What ideas do you have to make things more efficient, if not more affordable? Are you suspecting any signs of abuse? Our duty as physicians, or citizens for that matter, requires us to say so. What I like best about these Medicare and Medicaid data-dumps is that they can force the discussions about cost and utilization that we have not been having, but which are essential no matter who pays for our individual healthcare.
Peter Hasselbacher, MD
President, KHPI
Emeritus Professor of Medicine, UofL
15 Feb 2016
Let me know if any of the links are not working for you. Help me clean up any other mistakes.
One thought on “Prescription Drug Utilization and Costs for Kentucky Medicaid in 2014.”
Comments are closed.