
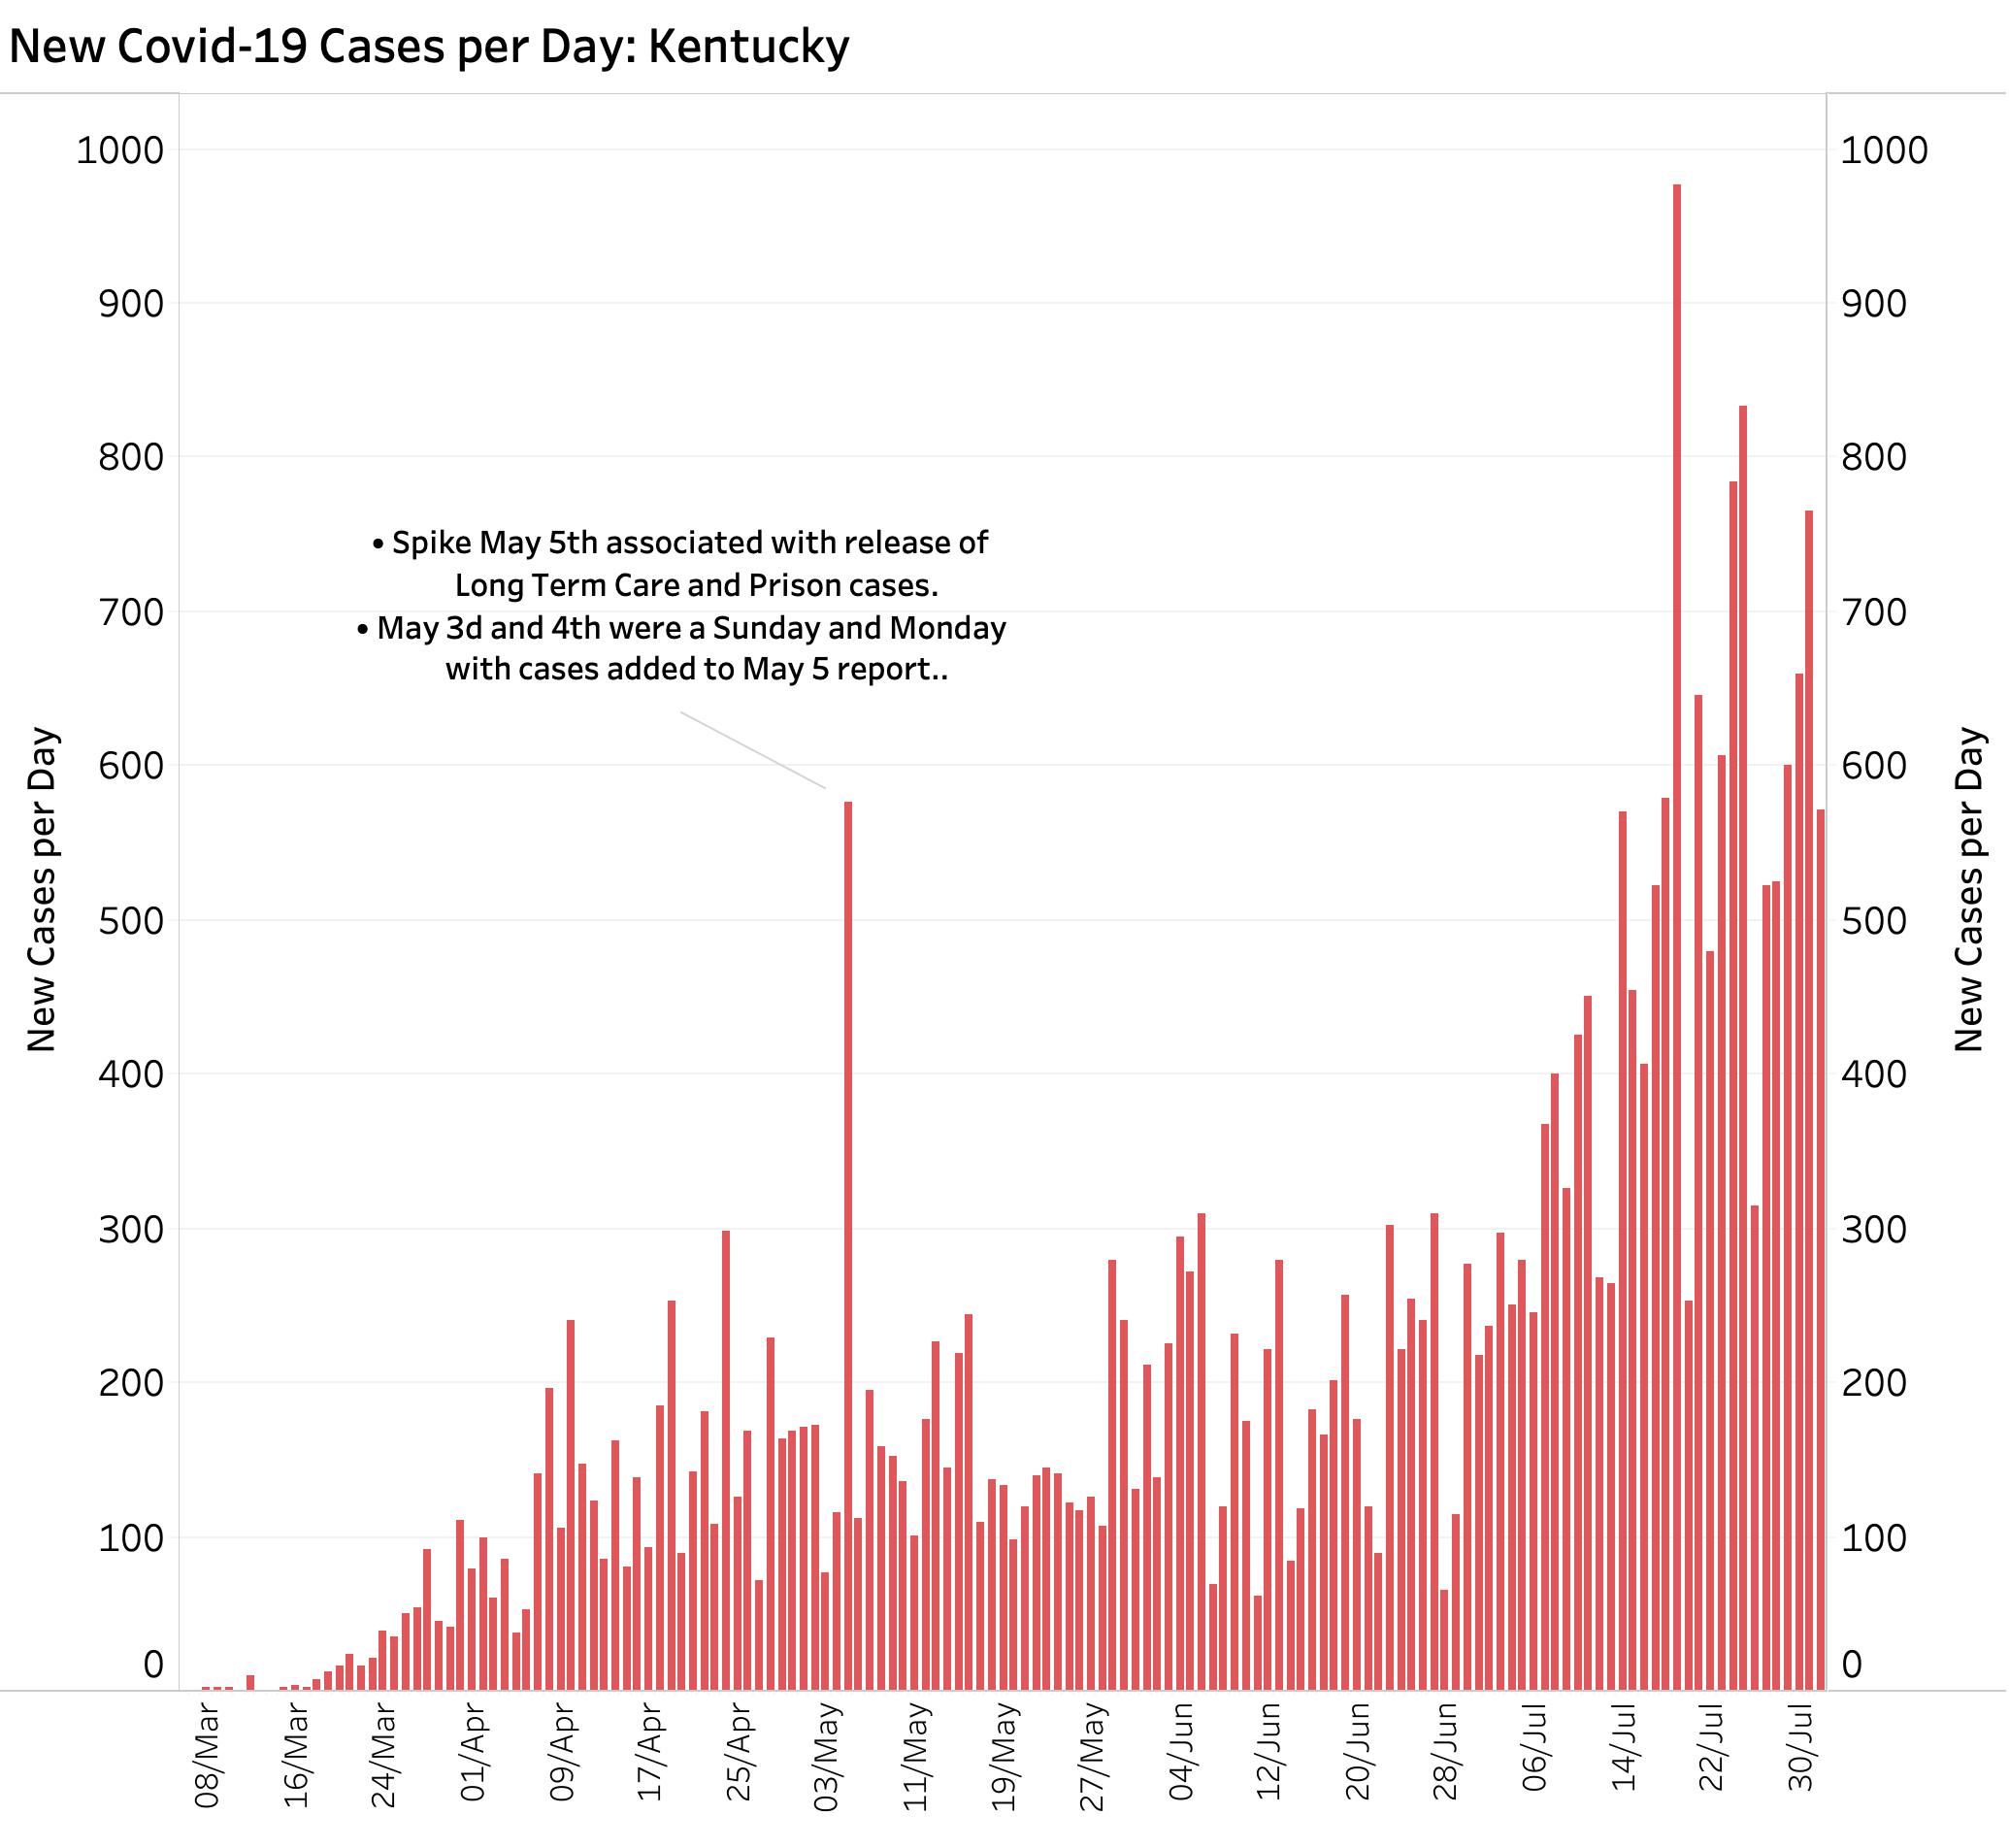
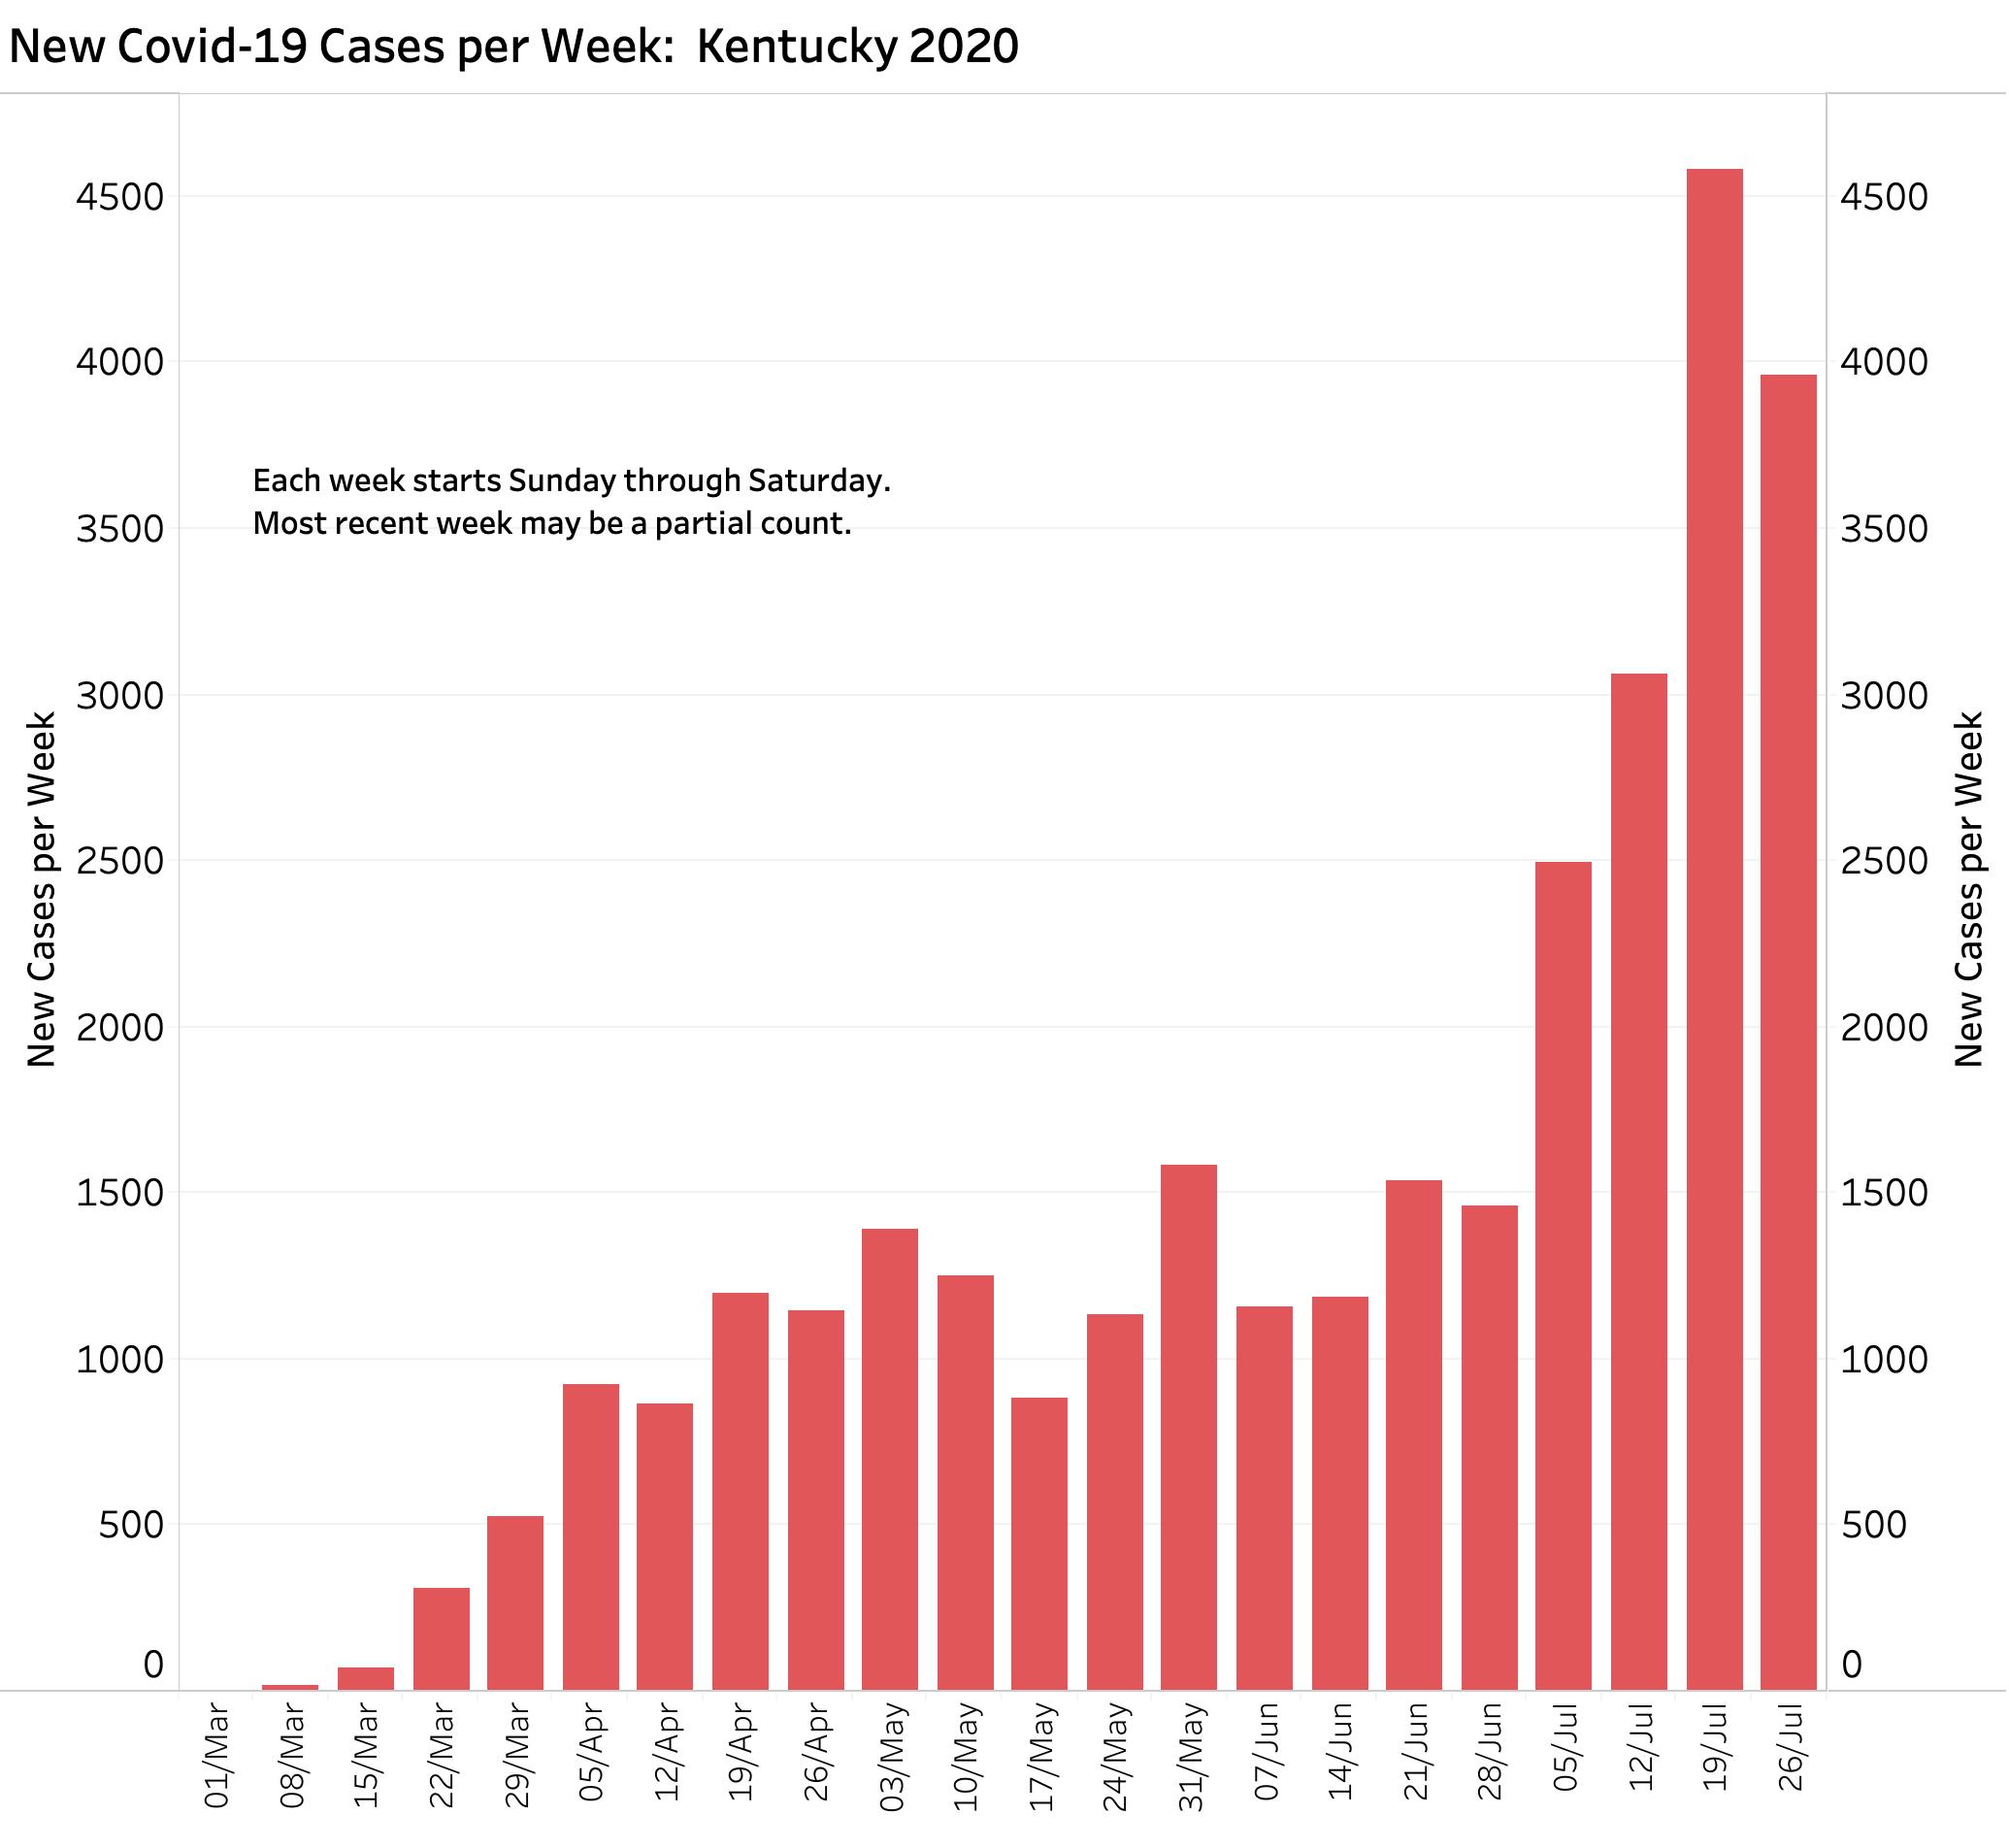
Since the last update in this series on July 26, the number of new weekly Covid-19 cases continued its rise into new territory with almost 4000 new cases. On none of the most recent 7 days was the daily increment fewer than 500, with a maximum of 765 last Saturday July 31. The weekly total was however less than that of the preceding week when the total exceeded 4500 new cases. I do not know if the peak days with 977 and 833 cases on July 19 and 24 included targeted testing initiatives at prisons or long-term residential facilities that would artifactually drive the case count up as it did on May 5th. While there is some hope that the interruption in the current upward climb in the 7-Day average of new cases represents a pause to a new and higher “plateau,” I believe it is too soon to tell. Governor Beshear issued an executive order to require face coverings on July 9. This met with legal and community pushback from some quarters. More recently on July 27, bars were ordered closed for two weeks and restaurant service was dialed back to 25% capacity indoors. It is too soon to determine the effectiveness of these measures as currently complied with.
While a partial report yesterday (Sunday) was lower with 463 announced new cases, this is high for a Sunday. Today (Monday) is also historically a low-count day so It is likely that we will need to see what happens during the catch-up reporting from the public health districts later this week. National reports note that the explosion of new cases in the South and West is now spreading to the Midwest– and that includes us and our neighboring states. I would like to think we will be largely spared, but not if we hide our heads in the sand or pretend it is safe to open stadiums, tracks, schools, or festivals without a demonstrable way to prove that it is safe to do so, or a social apparatus to deal with the inevitable outbreaks that will occur.
I have been updating KHPI’s online Covid-19 Tracker daily with Kentucky’s numbers and will do so again with this evening’s announcements. I invite readers to help me analyze the interactive data visualizations. Below are graphics that are current as of Saturday August 1, but will be updated again this evening.
This first is shows the aggregate cases and deaths since the first case was discovered in Kentucky. With the weight of 30,000 cases behind it, any short-term change in the trajectory of the lines will not jump out at us, but the overall rising rate of new cases since early July is well established.

When looked at on a day-to-day plot, it is apparent that daily reports vary in fits and starts, largely because of weekend interruptions in data collection and reporting by a variety of semi-independent public health districts.
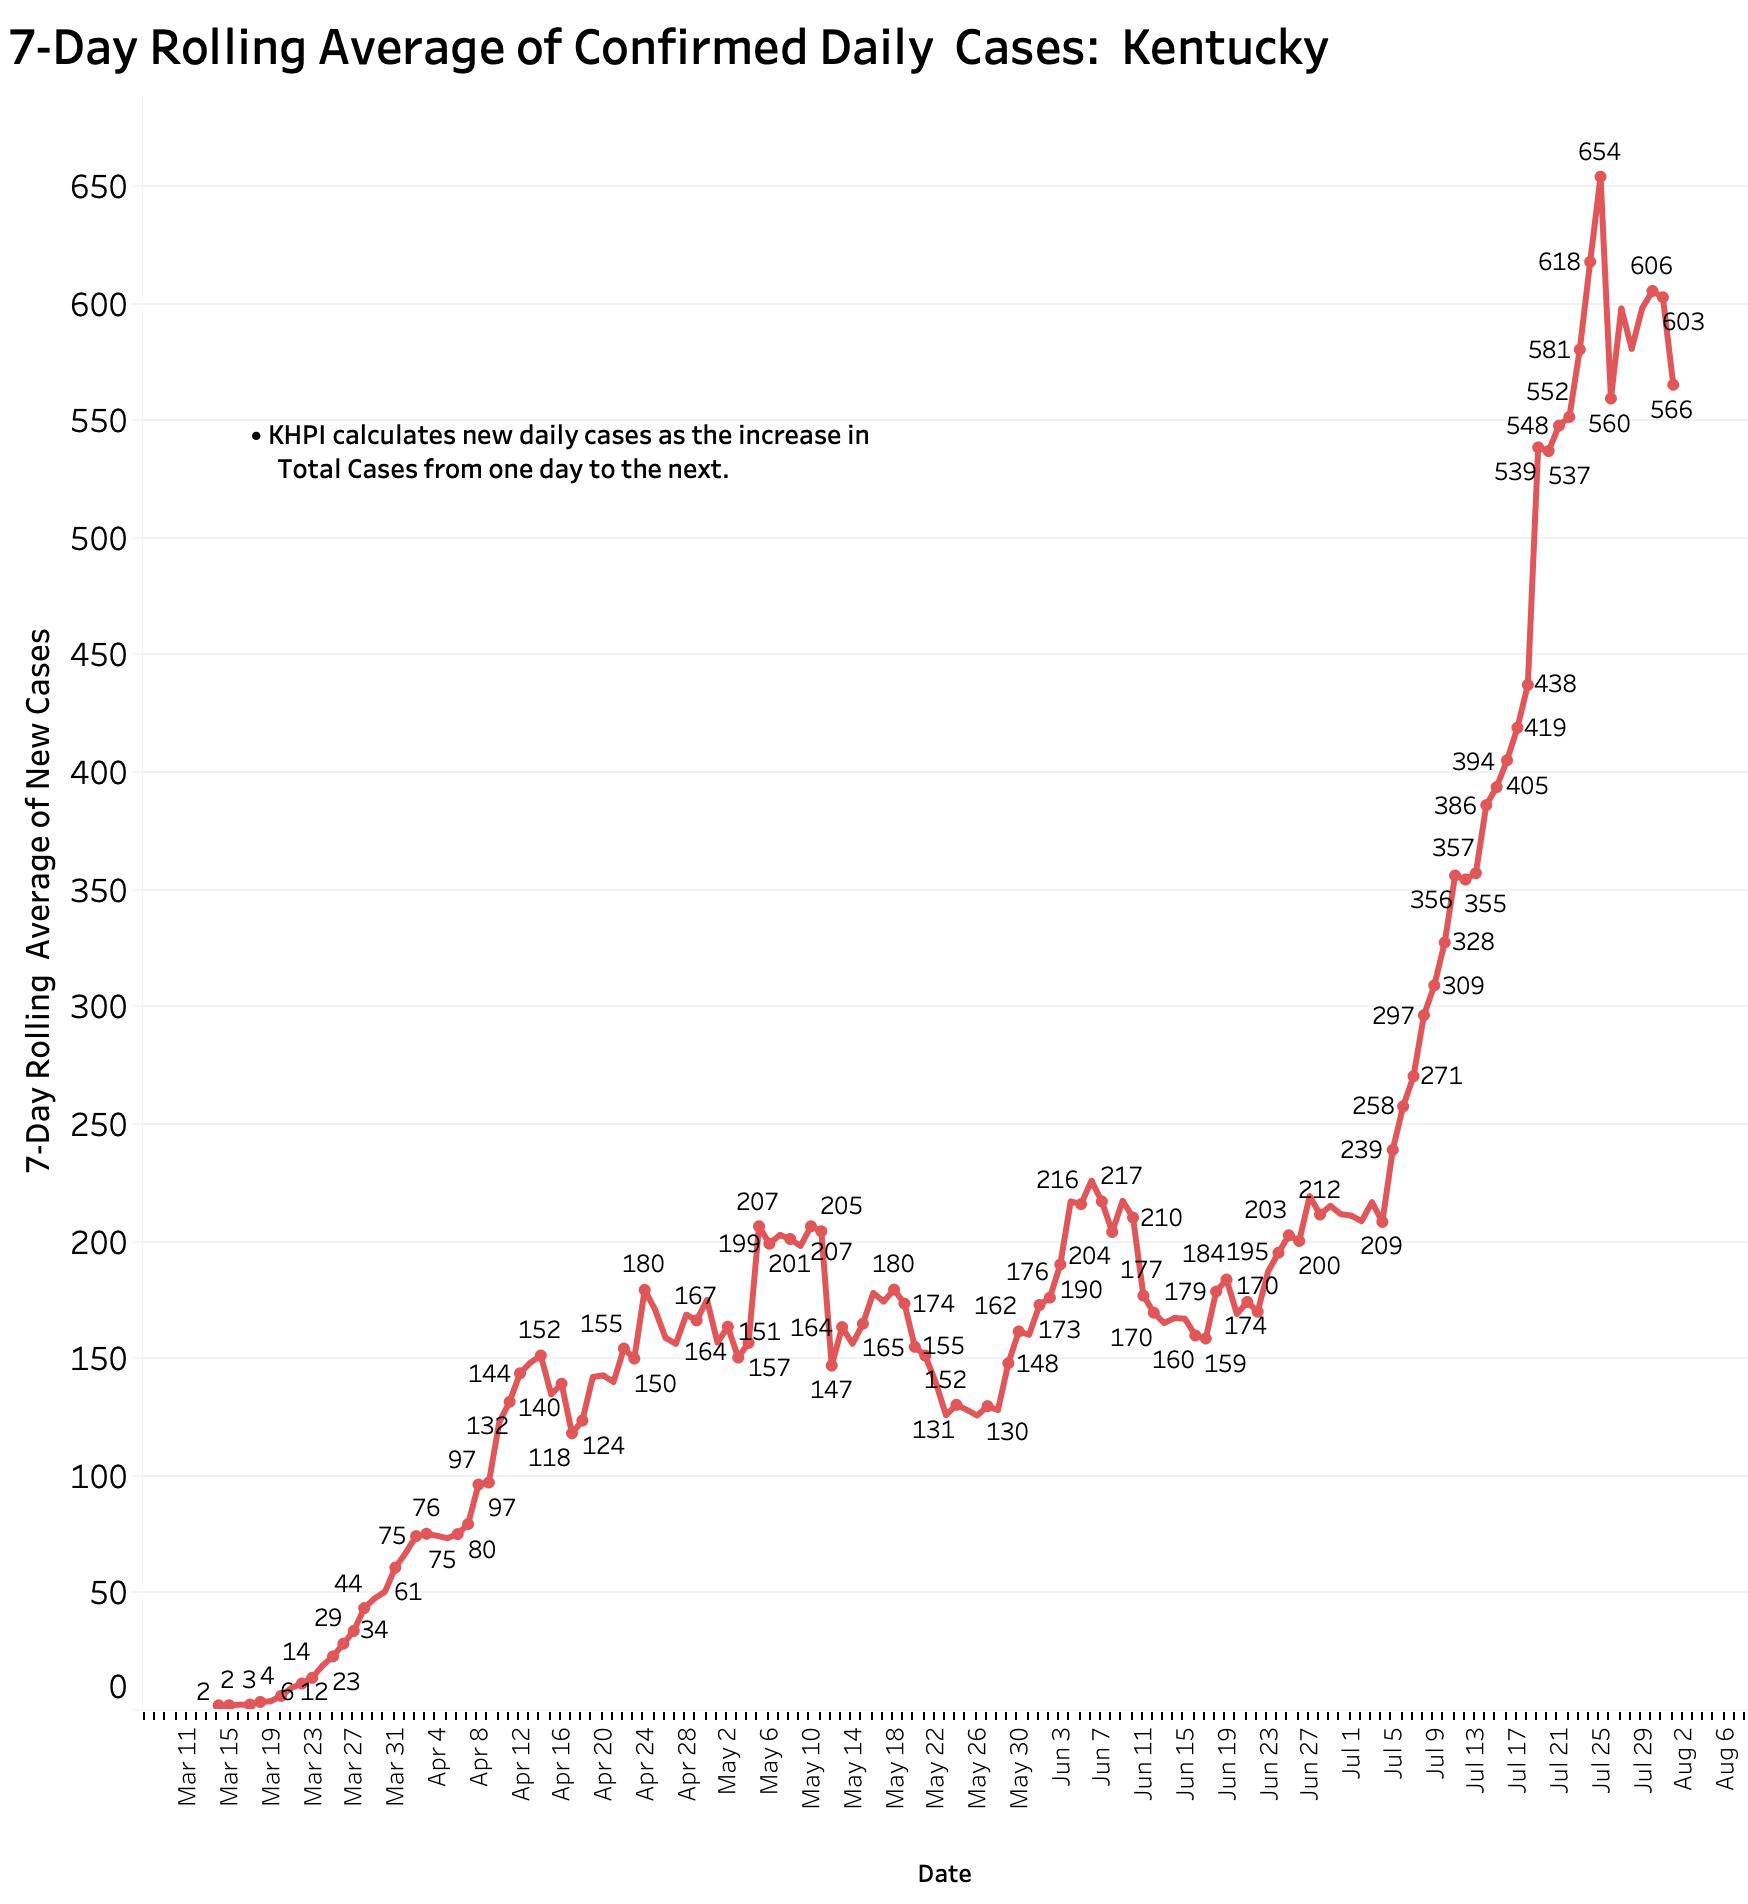
Using the data-smoothing approach of rolling 7-Day averaging below, the curves become less jumpy, but the influence of an aberrantly high or low individual day will linger for the next week. Looking at the plot below lends support to hopes of a new stabilization at a higher level but does not negate the colossal increase the occurred during July.
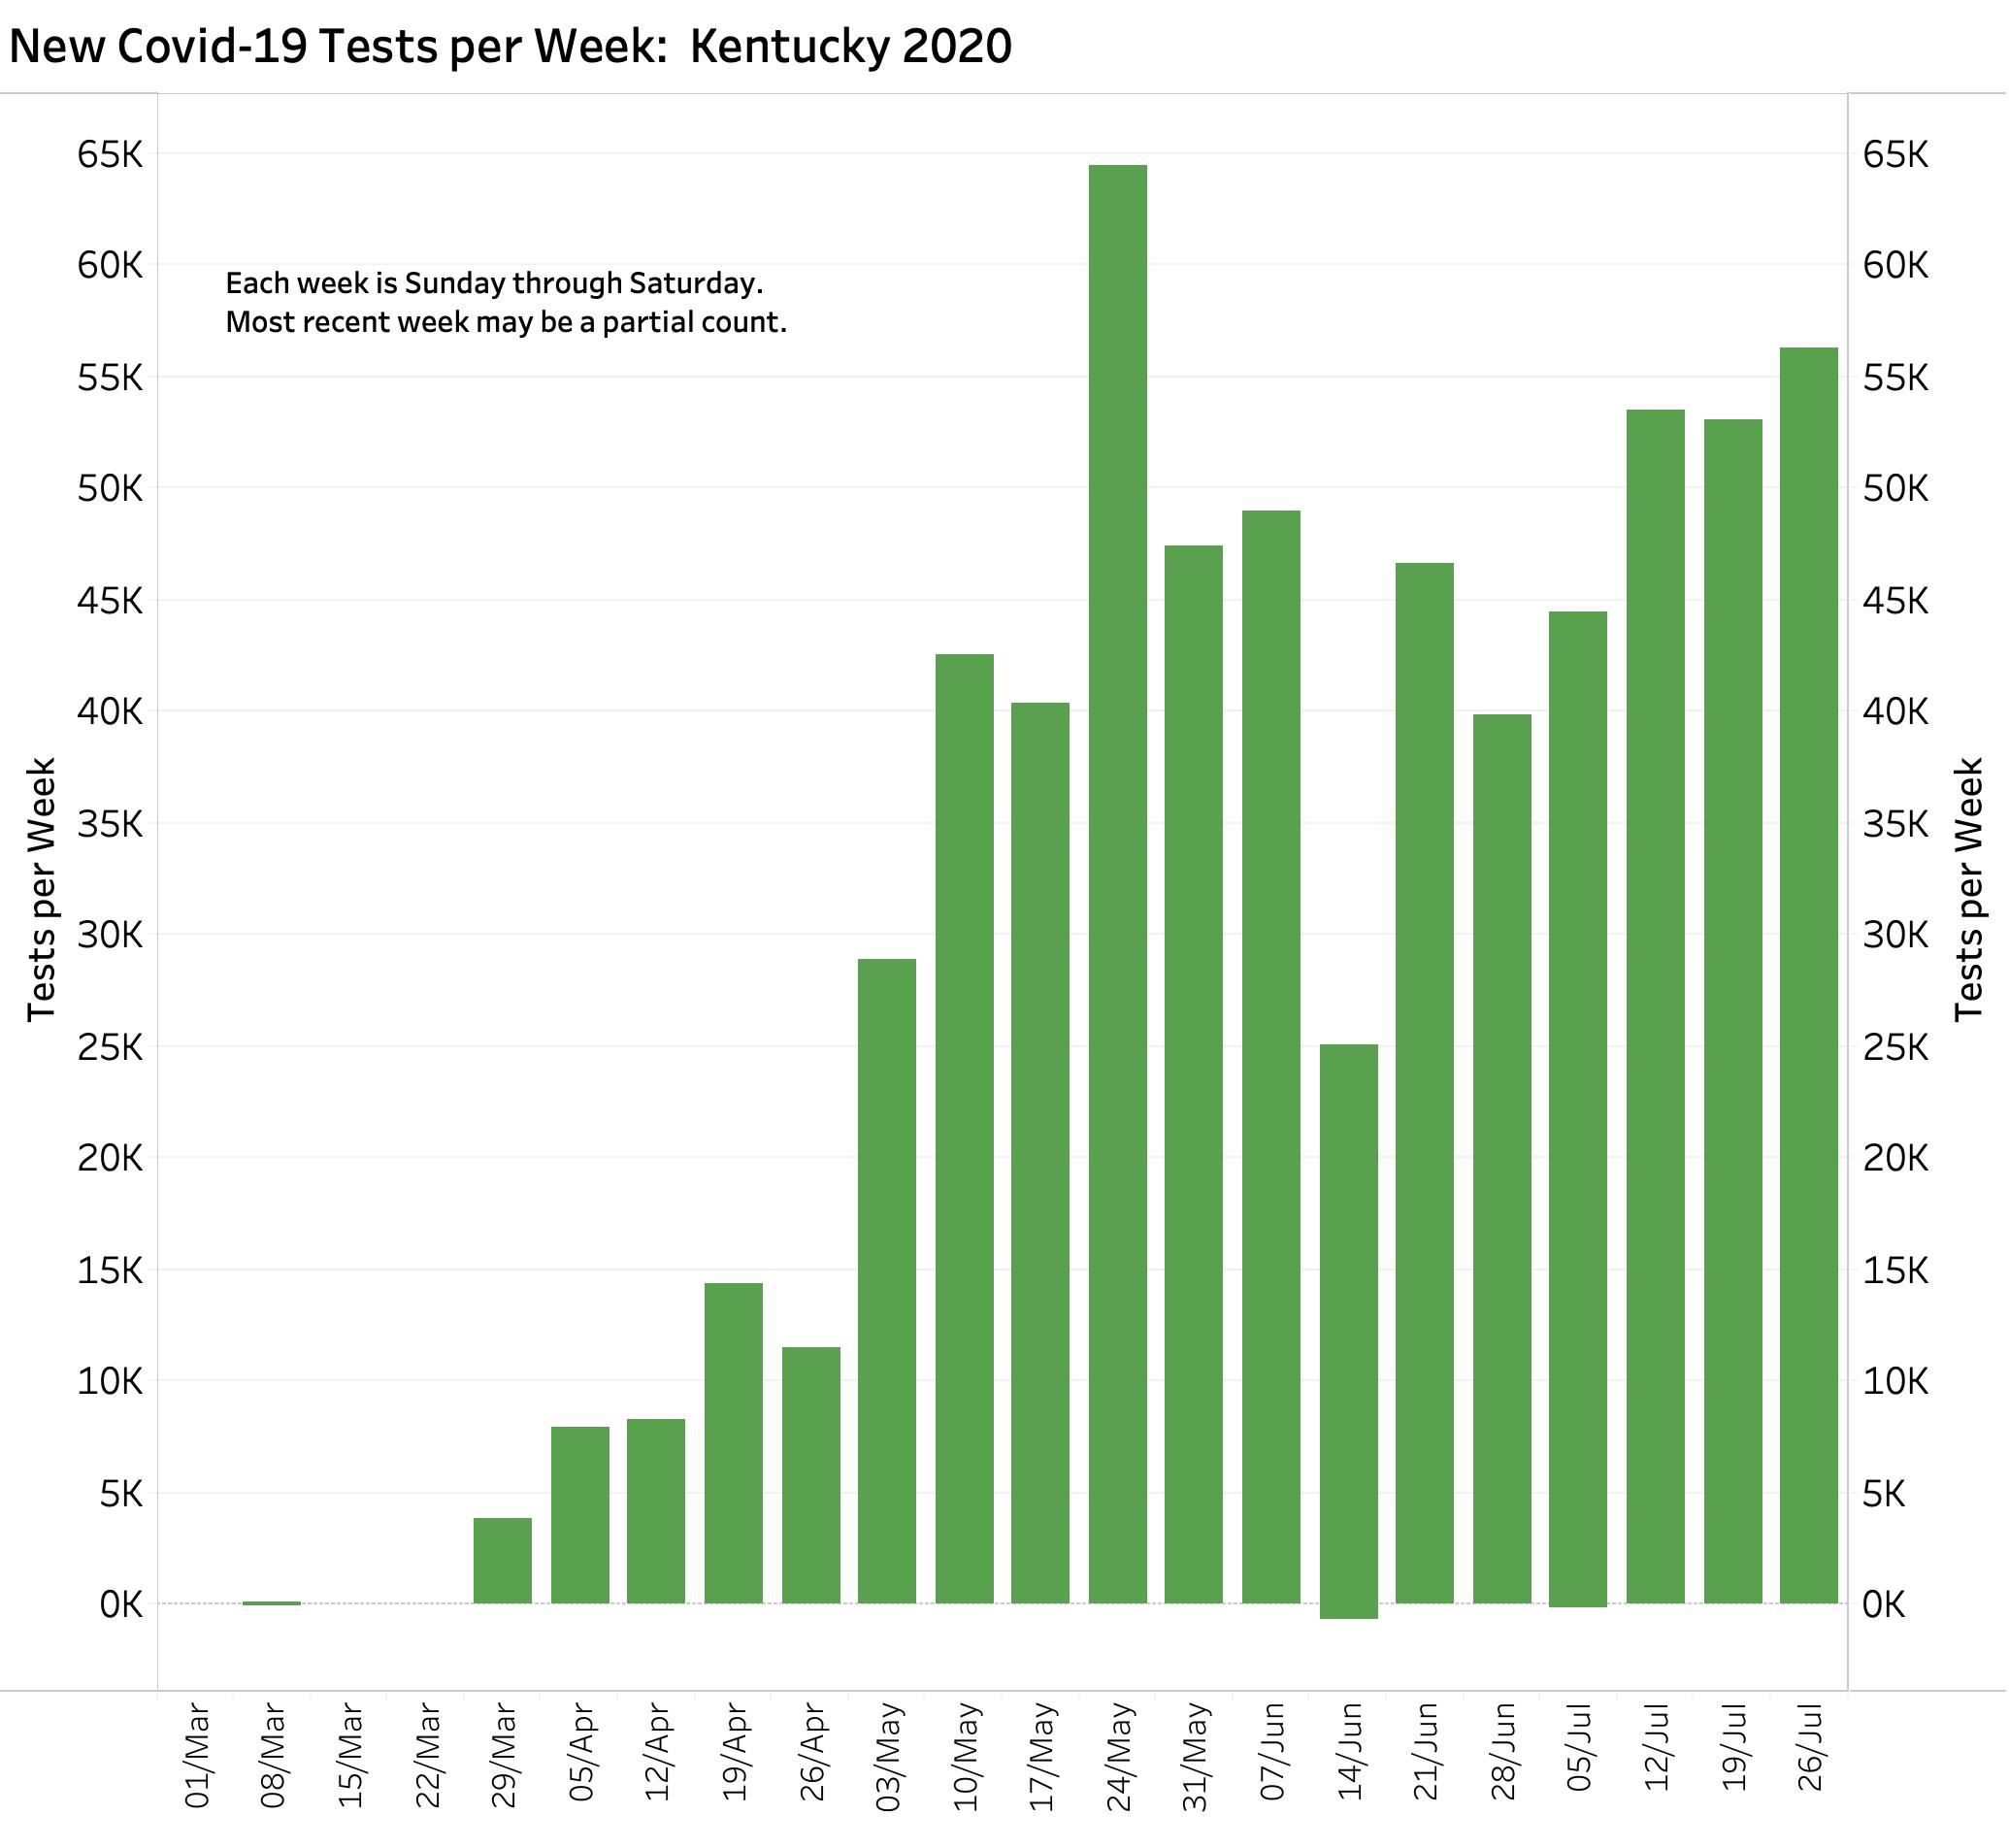
I am liking the visualization style below in which cases, deaths, and tests are totaled by calendar week. It is easy to understand, but unfortunately only up-to-date once a week on a Saturday. What will next week’s new cases look like?
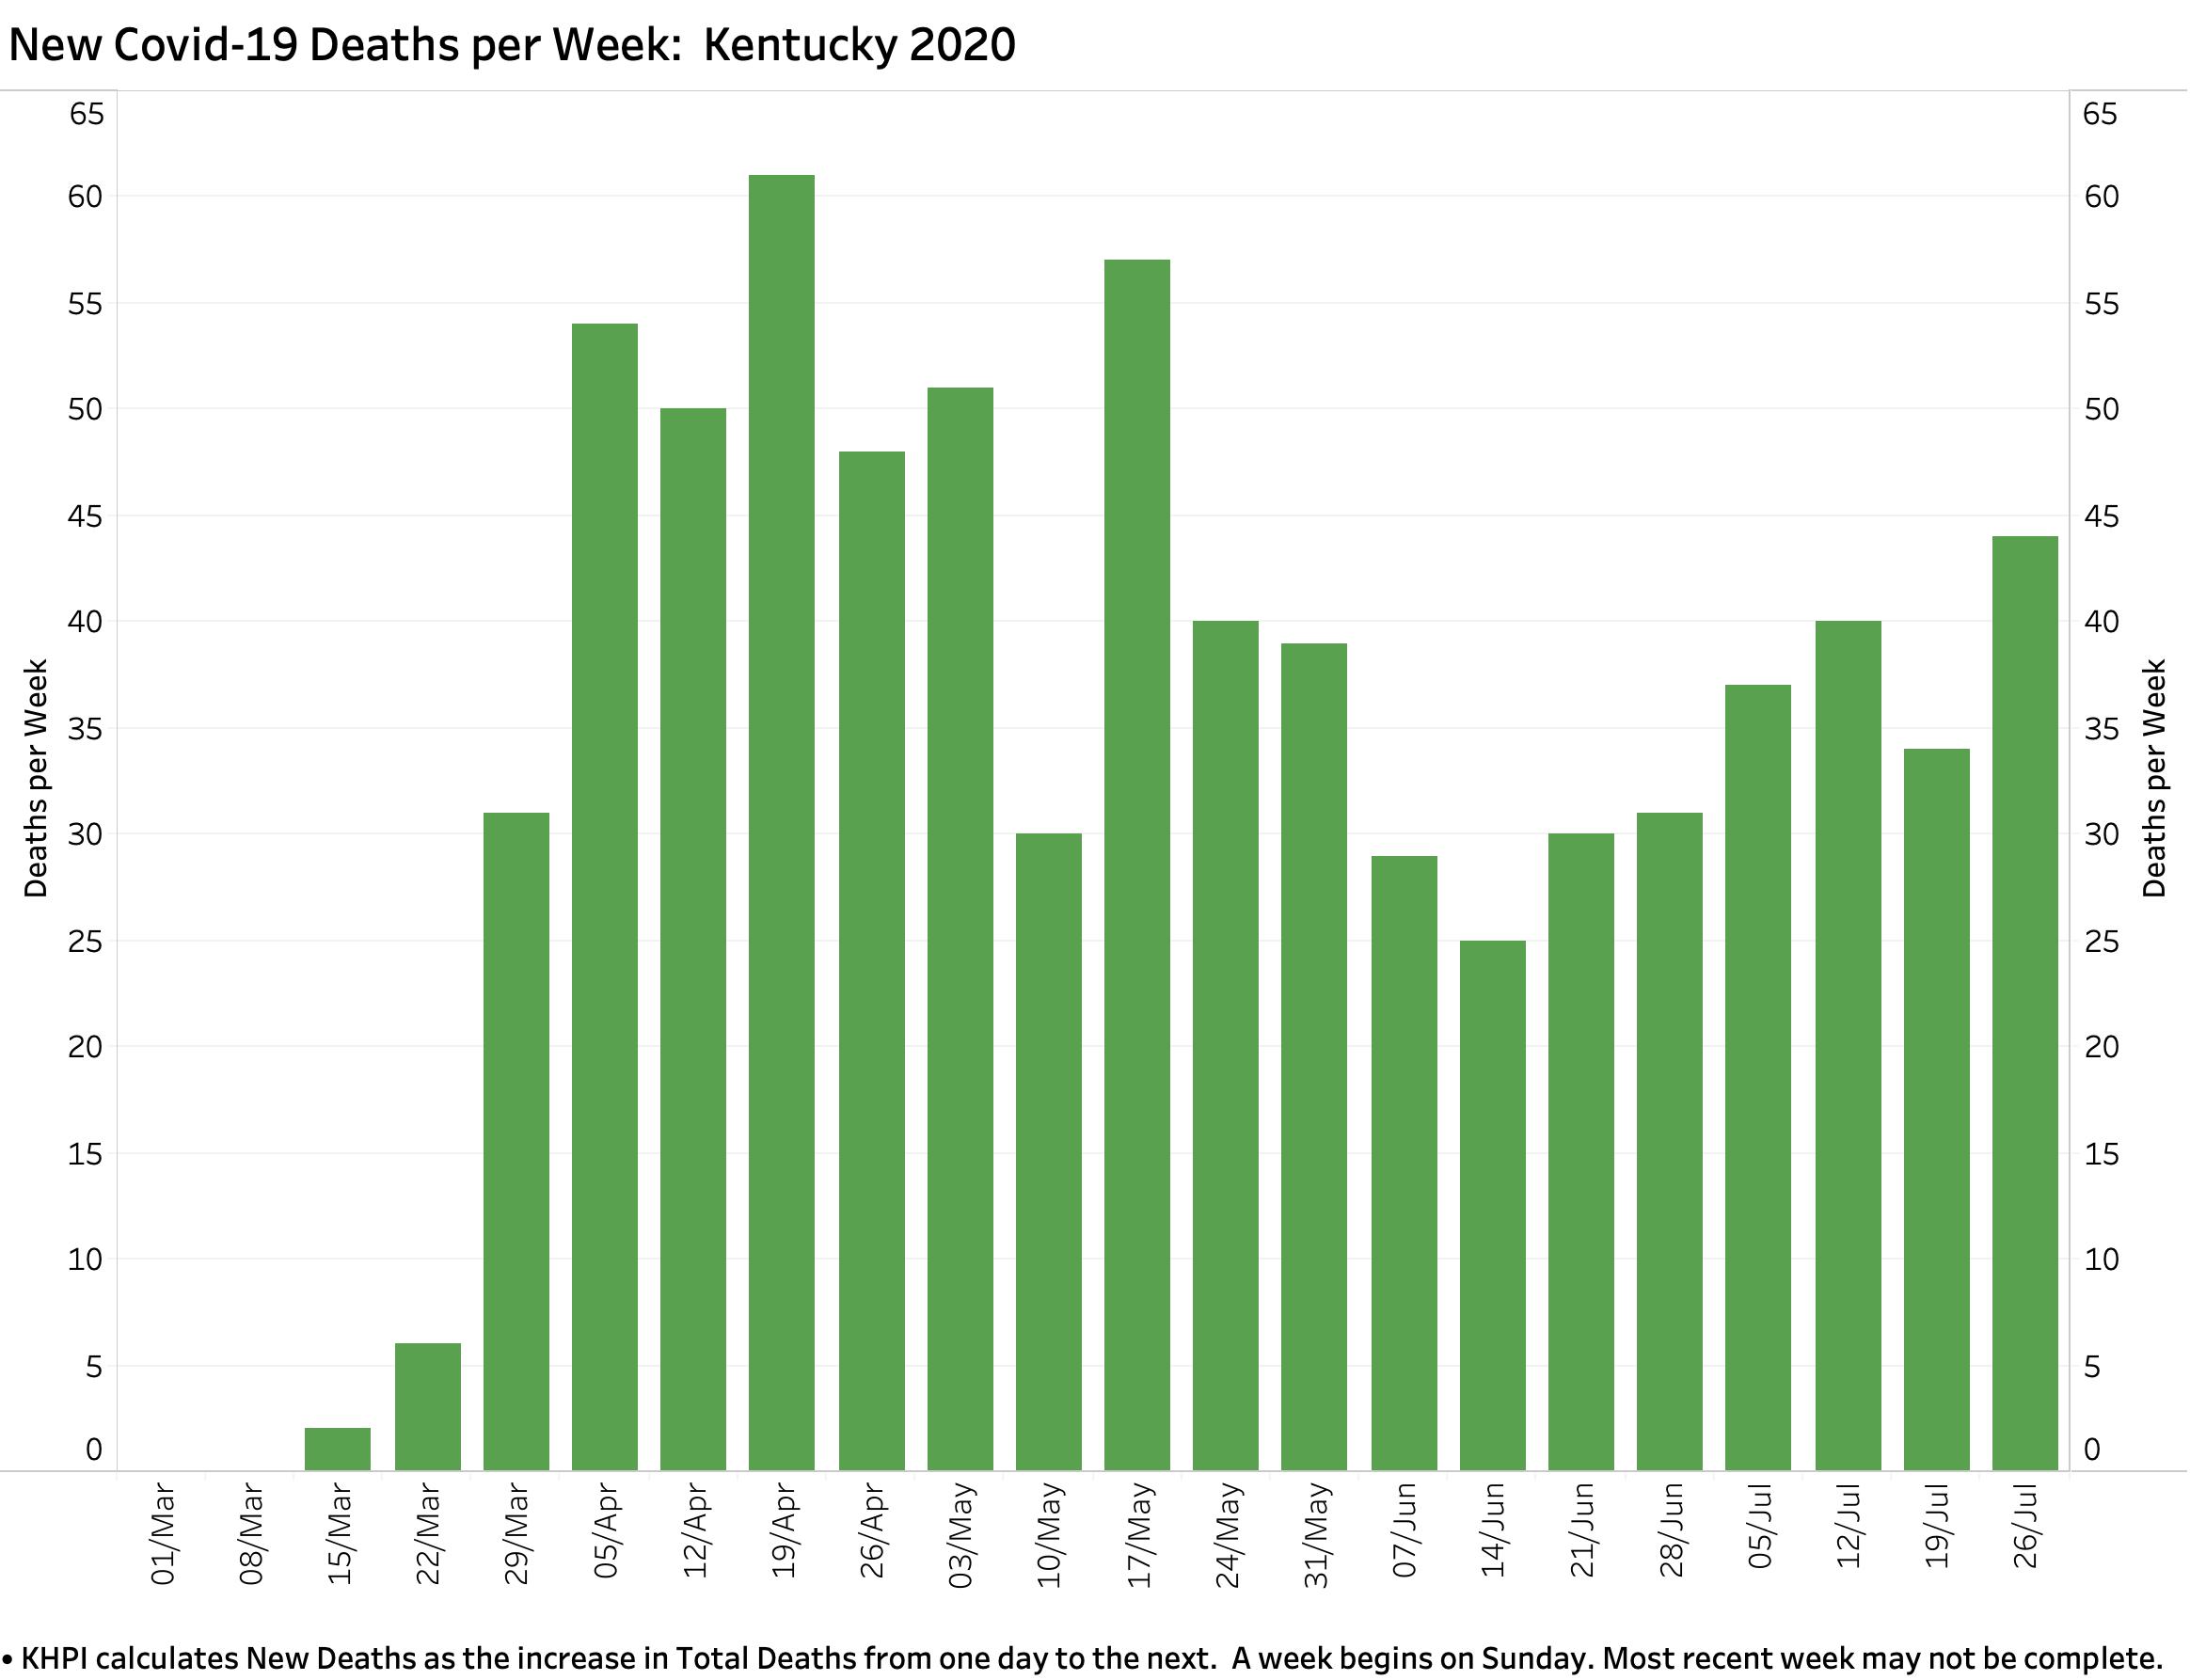
Here are deaths by calendar week. Given that deaths follow cases by weeks not days, we could be seeing a creeping up. Could they reach the levels of April? Why not?
Some are still arguing, even in today’s Courier-Journal, that our rise in new cases is simply the result of more testing. No public health scientist that I know of would agree. I refer readers again to my last article where I discuss this in more detail. I will do so again in coming days when I take a deeper look at policy implications. (Spoiler alert! No, it is not safe to open stadiums, tracks– and not without substantial risk– schools or universities.) Weekly testing in Kentucky has not increased all that much in recent weeks.
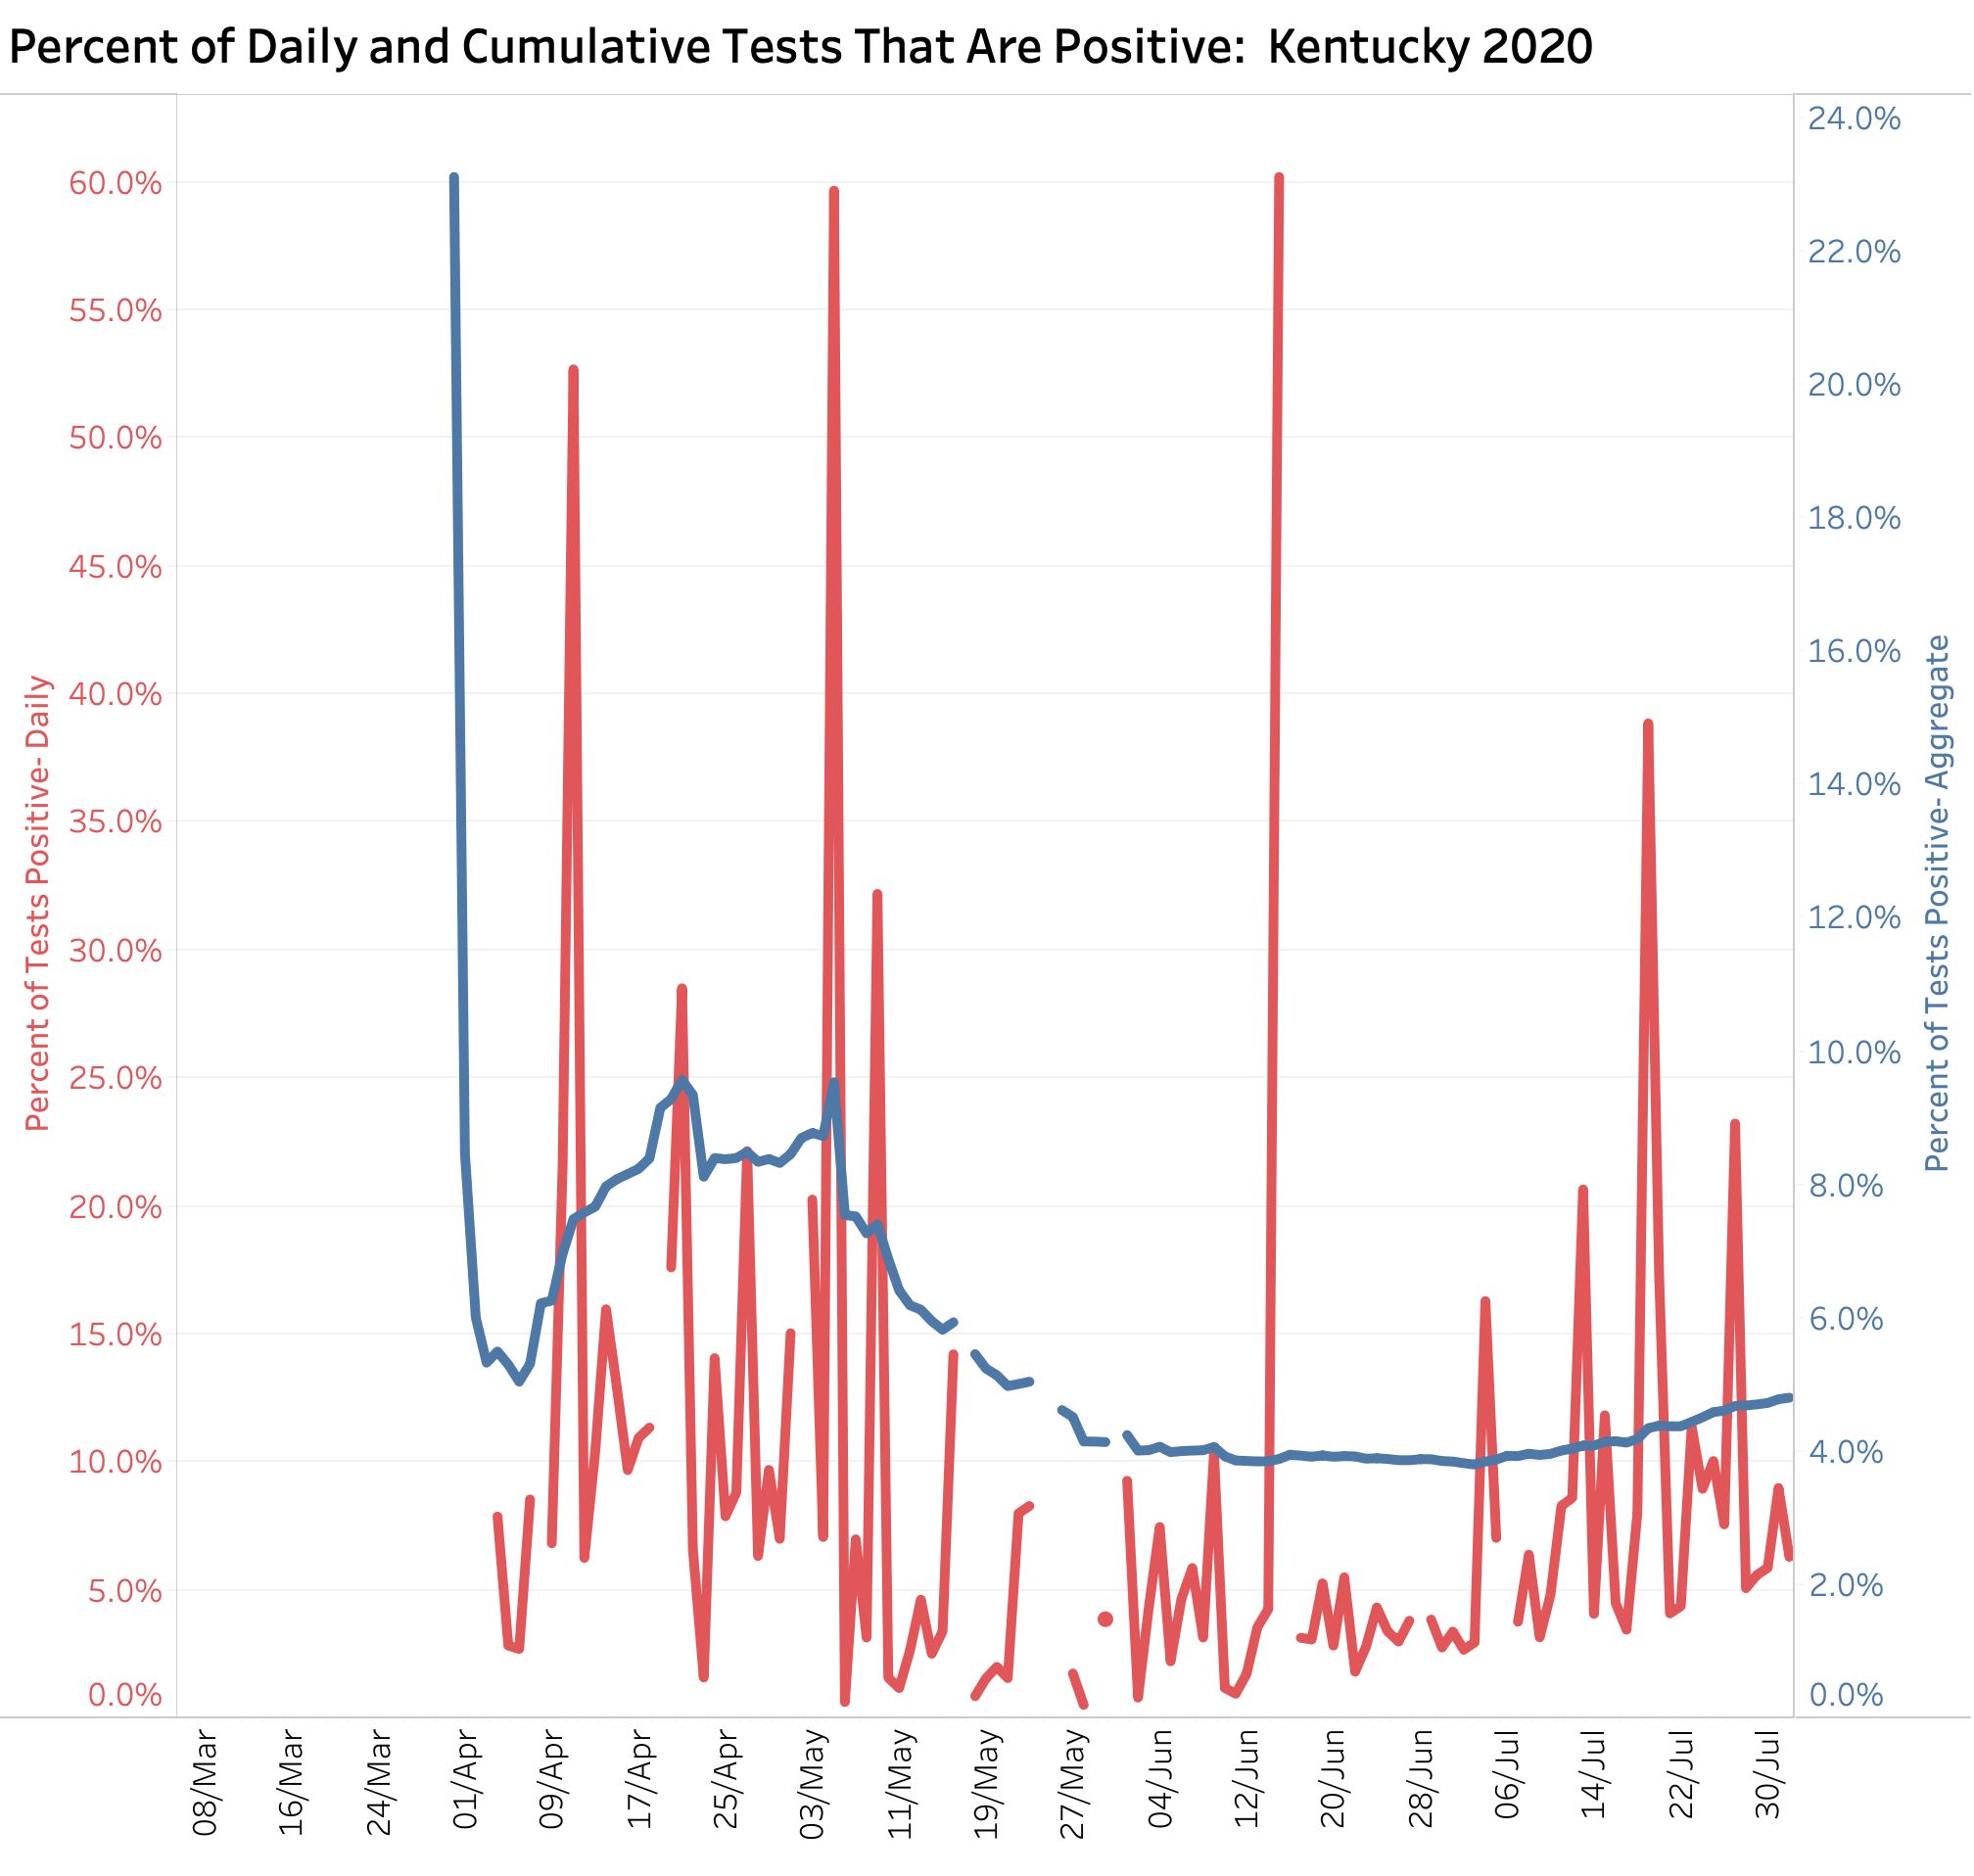
I still do not know how Kentucky or other states calculate the Percent Tests Positive (PTP). In a perfect world where tests are performed randomly within a defined population, the PTP can indicate the prevalence of a given disease in that population– but only in that defined population. Below are Kentucky’s raw numbers. I do not know how to interpret them at this time. Can you help me? Filters on KHPI’s interactive on-line site allow the viewer to vary the date interval plotted. A case can be made that the aggregate of tests performed is trending upwards, but only very slowly. In my analysis, pending confirmation of my methods, cases are rising much faster than testing. Our testing infrastructure, like that nationally, is currently under much stress. If once again the sick and high-risk are preferentially tested, the Percent-Tests-Positive rate will go up artifactually and not be representative of background disease incidence.
Enough of an update for now. I do not think anyone will disagree that the results of this coming week’s data collection and reporting will be very important. I wish again that I could be more optimistic, but I will be happy to eat my hat.
Peter Hasselbacher, MD
President, KHPI
Emeritus Professor of Medicine, UofL
Aug 3, 2020
It will be interesting to see what happens to the state positivity rate and confirmed cases when universities begin testing students in the coming weeks. UK alone plans to test nearly 30,000 students in the next three weeks. Would you be able to analyze the impact?