
Visualizing prescription patterns for Medicare patients with an eye to safety and cost.
In the name of quality, accountability, and paying for results, what began as a trickle of information previously unavailable the public about utilization, cost, and outcomes of medical services became a torrent. The challenge for professionals and patients alike is how to evaluate and act upon all this data. I include myself among the learners. My readers may have guessed correctly that I like to look at spreadsheets, pivot tables, and maps. Exciting new ways of looking at such “big data” are also becoming available. “Data visualization” is a current buzzword and I am experimenting with it. In this article I use a new way to summarize the number of prescriptions and associated cost for all drugs prescribed for Kentucky Part-D and Medicare managed care beneficiaries in 2013. This segment of Medicare patients received over 25 million prescriptions and refills that year with a total cost of $1.6 billion. I will show that a few dozen drugs comprised half the volume and cost of all prescriptions, attempt to shock you again with the volume of opioids and other controlled narcotics prescribed to the elderly and disabled, introduce you to Kentucky’s most rapidly growing drug of abuse, and illustrate in one fell swoop how America can save $Billions nationally without any decrease in safety or quality of care. Does this sound like a late-night TV come-on? Read on.
Data Visualization with Tableau.
I just purchased a software package called Tableau that is increasingly used by big businesses to look at big data. It combines robust statistical and database capabilities with a stunning assortment of visual aids to understanding. My first effort was to map the use of opioids by Part-D 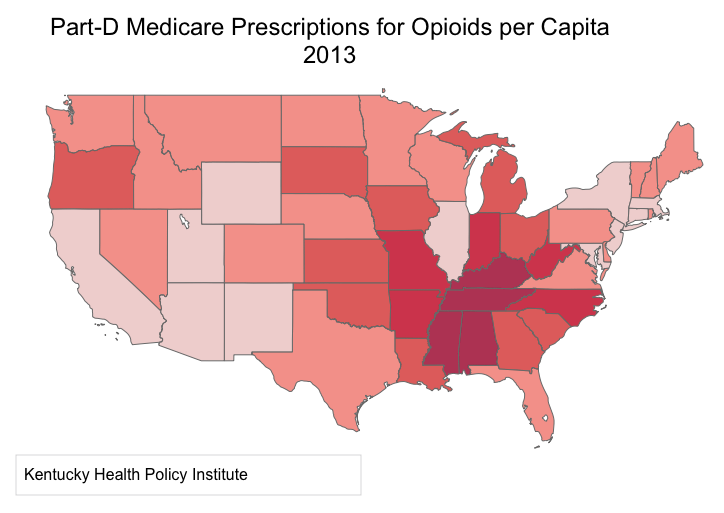 Medicare beneficiaries in the 48 lower states. (I have shown that Medicare prescriptions for opioids correlates strongly with opioid prescriptions in the general population.) We are no longer surprised to see that Kentucky sits right in the heartland of prescription opioid consumption. We have been there for a long time.
Deaths from drug poisoning.
Here is a link to a recent Tableau Dashboard prepared by folks at the CDC that looks at deaths from drug poisoning over the past 13 years. The underlying data is further analyzed by the New York Times. Such deaths encompass more than opioid overdoses, including sleeping pills and other drugs involved in deliberate or accidental overdoses. These are however, a marker for prescription drug abuse. I may come back to this dashboard in a future article, but to set the stage for now, look at little Scott County in southern Indiana which has been in the news in the last year as a hot-spot for opioid abuse, but also for its devastating epidemic of HIV and Hepatitis-C consequent to to intravenous drug use. In the interactive map, 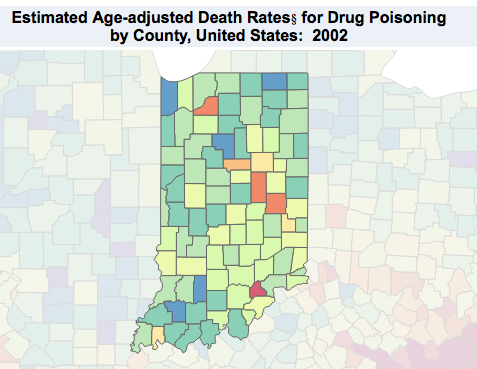 Scott County stood out like a light bulb in Indiana as early as 2002! If we had a way to pay attention then, would things have gotten as bad as they did? Would we have done something to shut down the regional over-prescribers of Opana then? Would be have taken steps to prevent communicable diseases? Would we have prevented the death and illness of addicted and innocent people alike? I would like to think so, otherwise the concepts of preventative medicine and public health are meaningless. With this example of searching for anomalies as a backdrop, I want to take another look at the Medicare Part-D and Managed Care drug utilization database that I have written about earlier.
A different way of seeing.
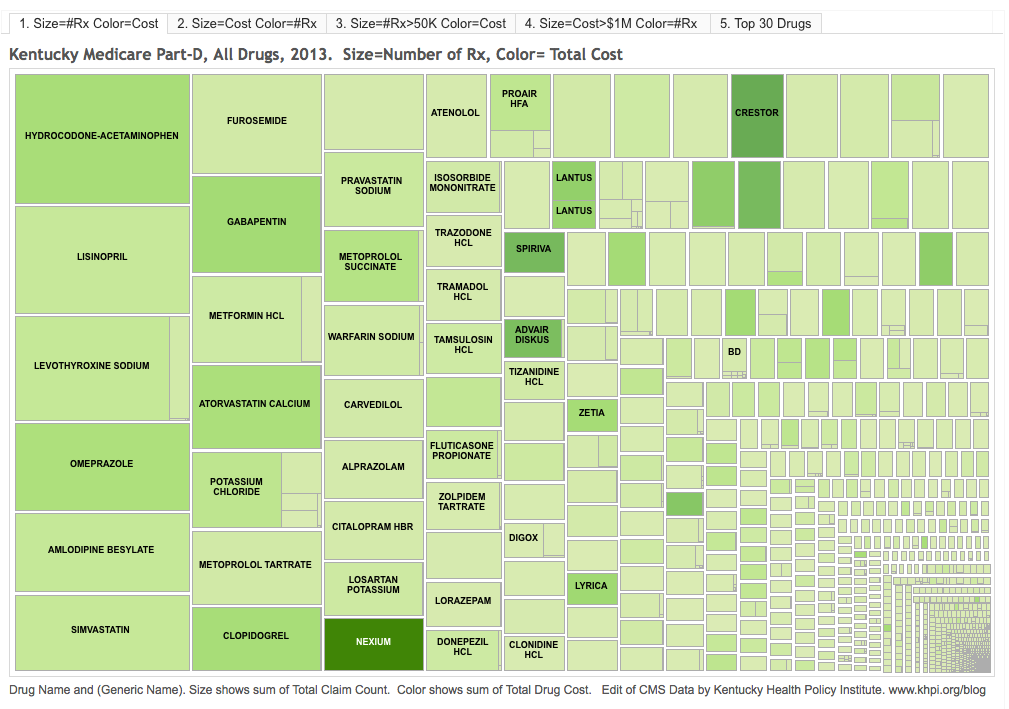 The following set of interactive graphics will open in a new window. You can follow the discussion using the 5 tabbed graphics. These types of visualizations are called TreeMaps. By explanation, the graphic in Tab 1 contains a cell for each of 1705 named outpatient drug entities prescribed in Kentucky in 2013. The size of each cell is proportional to the number of prescriptions and refills for a given drug, and its shade of green corresponds to the total amount paid for that drug by Medicare, third-party payers, and patients. Some drug names are too long to fit and still be readable, but if you hover your cursor over or touch the cell on your portable device you will see the data behind each drug. The astute observer will notice that some cells are visibly subdivided, most often to reflect the subset of generic and brand name drug. It is easily observed visually that vast majority of drugs are prescribed only a relatively few times – hundreds of cells crowded into the lower righthand corner. (In Tab 3, I present the same data, but only for drugs prescribed more than 50,000 times that year.)
Several 800-pound gorillas in the room.
Some 50 -60 drugs make up one half of all the prescriptions written! Who out there is willing to justify medically that the most commonly prescribed drug to this largely elderly population is the combination pill hydrocodone/acetaminophen, a.k.a. Vicodin? Also prominent in the top row (near the right hand corner) is oxycodone/acetaminophen, a.k.a. Percocet. A third prominent opioid analog and drug of abuse is Tramadol.
Most of the remaining drugs on the left side of the figure are unsurprisingly those used for hypertension, heart disease, diabetes, or cholesterol management. I was surprised to see how many people were taking thyroid hormone – I am one of them. The fourth-most commonly prescribed drug, omeprazole, is the generic (and over-the-counter) form of Prilosec which is used for heartburn. Another heartburn/reflux drug in the high-profile left half of the figure is Nexium, the brand name for a drug whose active ingredient is identical to that of omeprazole, but as the intense green shading indicates, if fantastically more expensive. This represents a triumph of marketing over reason and good medicine. More about the cost of these drugs later.
Frankly, I have been away from active practice for long enough that I did not recognize the generic names for some of these “gorilla” drugs. We should not be too surprised to see donepezil (Aracept) on a list of drugs for the elderly as it is widely used for Alzheimer syndrome, even as it does not alter the course of the disease. In a similar vein, tamsulosin is a drug used to relieve prostate obstruction. I was surprised to see how often fluticasone (Flonase) is prescribed, a drug used for nasal symptoms of allergies. What I was both surprised and disappointed to see was how often lorazepam (Atavan) and zolpidem (Ambien) are prescribed to this population. Along with other sleeping pills, tranquilizers, and narcotics, these drugs are relatively contraindicated in the elderly as they cause confusion and lead to falls – at least that is what I was taught when I was certified as a gerontologist and what I taught as an internist.
A stealth entry.
 I did not know what to make of the fact that gabapentin, the 8th most frequently prescribed drug, was in this grouping. I had to look it up. Its brand name is Neurontin and its primary medical indication is for seizures. It has a very few secondary approved uses including for the neurogenic pain that follows in some people with shingles, but its unapproved uses are many including the type of pain that might be called “neurogenic.” So many things are lumped into this category that in my mind it is unhelpful. Neurogenic can be used to include fibromyalgia, a syndrome without objective physical or laboratory findings that many consider to be a more psychosocial than biomedical disorder. Pfizer, the drug’s manufacturer, paid $945 million to the U.S. Justice Department to settle claims that it promoted the drug illegally and that it did some questionable maneuvering to keep cheaper generics off the market. That is a lot of money, but it did not effect the ability of health professionals to prescribe it. One billion dollars is a lot of money, but it looks like Pfizer is making it up on volume.
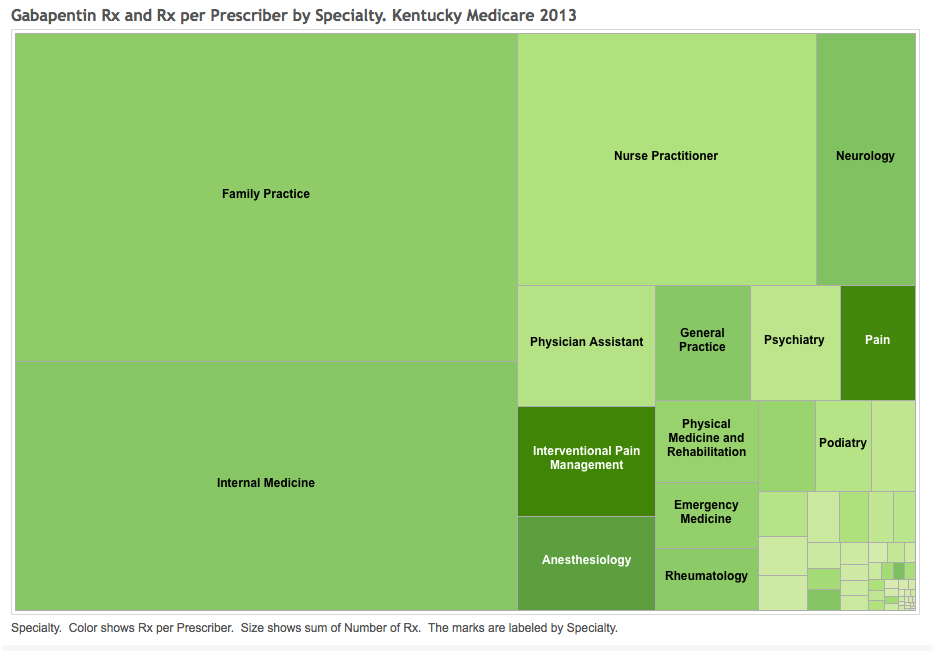
I was puzzled that this drug was being so frequently prescribed. However, a quick search of the medical literature (a.k.a. Google) tells us that this central nervous system drug is being used as a substitute for, or as an enhancer of the opioid experience. Because it is not (yet) a controlled drug, its use has been rapidly expanding under the radar. Can anyone in the field where the rubber meets the road tell us more about the abuse potential of this drug or why it is being prescribed so frequently? The specialties prescribing gabapentin are pretty much the same that prescribe opioids, but as we would expect, neurologists are more represented. I will present a more detailed analysis of gabapentin use in Kentucky and elsewhere in a future article.
Cost matters too.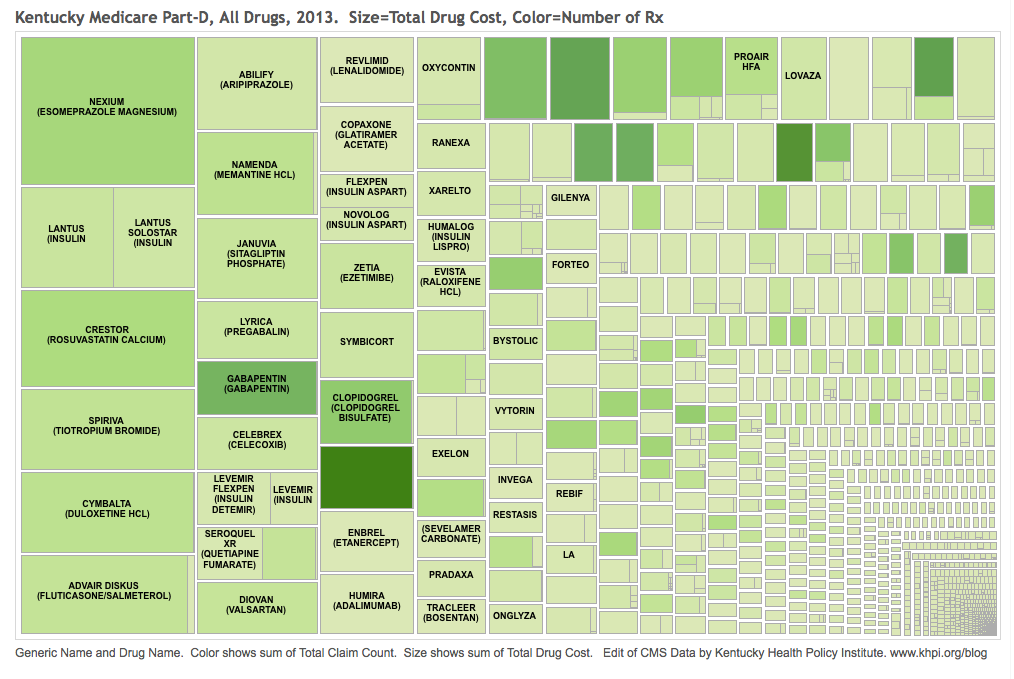
Note that many drugs in smaller cells stand out because they are more darkly shaded, representing total cost. This leads us to Tab 2, the converse of Tab 1 in which the size of each cell is proportional to the total cost of its drug and which is shaded in proportion to its number of prescriptions. In this view, the the heartburn/reflux drug Nexium is seen to be the most expensive Part-D (outpatient) drug for Medicare in Kentucky – as it is nationally. I admit to being surprised at how much we pay for asthma and chronic lung disease, and how expensive insulin has come to be. Several of the other expensive-per-dose bio-engineered drugs like Enbrel and Humira are on the left side of the figure. Hydrocodone, oxycodone, Oxycontin, and gabapentin are there too. (Tab 4 shows the same information for drugs whose total cost in Kentucky exceeded $1 million.)
Some thoughts came to mind as I examined the figure. Should we paying so much for brand name Crestor when there are generic statins available to treat high cholesterol? Is the non-steroidal anti-inflammatory drug Celebrex that much safer or more effective than simple ibuprofen? Namenda for Alzheimers looms large. Is it any better than the marginally effective Aracept? If not, why are we paying for it? Lycra is being used for many of the same reasons as gabapentin and the total cost is about the same. Is it worth it – indeed, is it doing that much good?
Generic vs. brand names.
It appears to my initial inspection that the majority of these most costly drugs are those prescribed and dispensed as brand names. I am unaware that any distinction in effectiveness or safety can be made between the two. Why then, when there are generic forms of given drugs available, they are not the only forms eligible for payment from Medicare or pooled premium dollars? For example, in my professional opinion, there is no need to pay any premium for Nexium – it is clinically equivalent to omeprazole. If I were King, I would save the nation $7 billion or more every year with a single edict. Someone tell us why this has not happened – or why I am wrong. To be fair, I was pleased to see that for the most part, generics were being dispensed preferentially to brand names in most cases. In part this is due to requirements by third party payers, or driven by the higher copays often required by drug plans for brand names.
Another modest proposal.
Referring back to Tab 1. levothyroxine was the third most frequently prescribed drug. It is most often given for people like me with hypothyroidism. Most of us will likely take for the rest of our lives. There were 4 different brand names for generic levothyroxine prescribed, but the most common of these alternatives was Synthroid. For this population in 2013, there were 730,857 prescriptions for the generic drug for a total cost of $7,053,392. For Synthroid, there were 94,045 prescriptions written for a total cost of $2,746,978. The difference in cost-per-prescription was $9.65 vs. $29.21. If all the Synthroid were paid at the same rate as the generic, the people of Kentucky would have a savings of $1,839,443 – and this is just for one drug that is not particularly expensive. I would not personally take the generic form if I thought it was not just as good. (Bizarrely, I pay $12 in cash for a three month supply because it would cost more if I used my Part-D drug plan. That is so wrong but reflects the craziness of our drug pricing system!) It bothers me that I am paying for others to take the brand name version. It should bother you too. God forbid that we allow Medicare to negotiate drug prices for us! There are approximately 600 or more named entities in the Medicare list for which there are one or more brand names competing for business. When I get a better handle on how to manipulate the database, I will attempt to estimate how much savings there would be to the system if generic prices were paid exclusively for all drugs.
A more conventional look.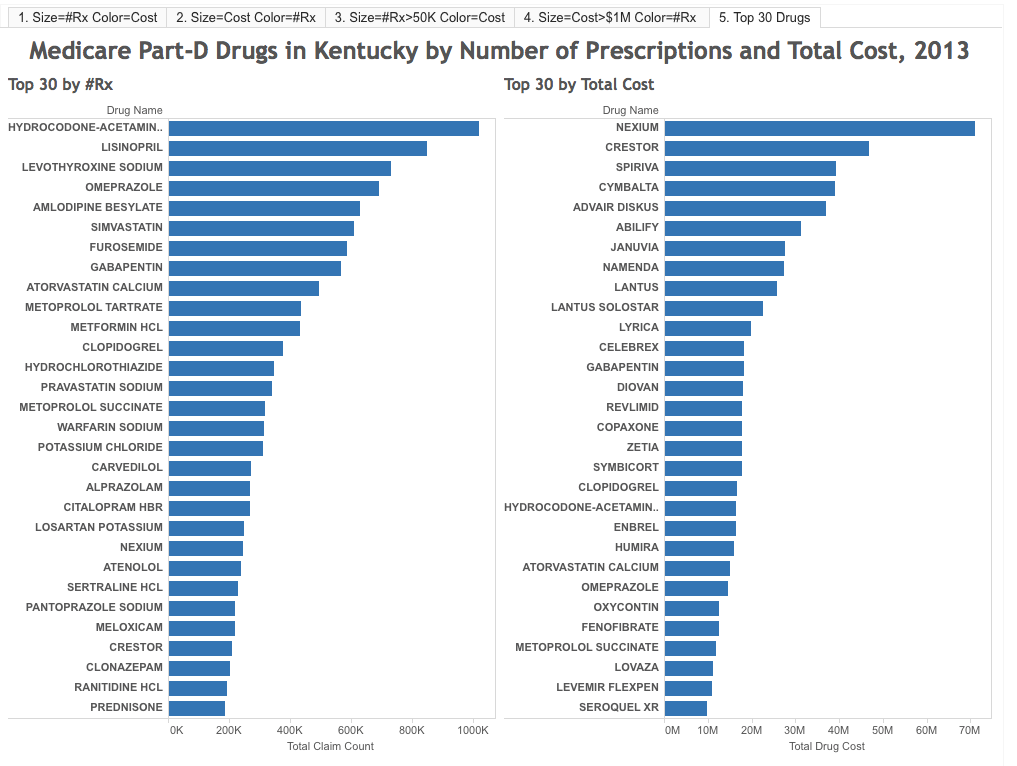
Tab 5 is a simple chart displaying the top 30 most frequently prescribed and 30 most costly drugs in this defined Kentucky population. Several drugs are on both lists: hydrocodone/acetaminophen, Nexium, Crestor, gabapentin, atorvastin calcium (Lipitor), and omeprazole. Most of these pairings are not unexpected even if they may be difficult to justify, but presence of gabapentin begs to be explained.
What jumps out at you?
I look at these TreeMaps with the eye of a hypothyroid rheumatologist with heartburn. I have no doubt that for physicians or professionals with different sets of experience and expertise, other apparent peculiarities or surprises will jump out. What questions and thoughts come to your minds. Let us hear from you. For me, creating and looking at such visualizations is my Sudoku or video game. However, there is no doubt in my mind that taking a step back and looking as a profession in this way will lead us to better and less expensive medical care, and will uncover inappropriate practices in the bargain.
Peter Hasselbacher, MD
President, KHPI
Emeritus Professor of Medicine, UofL
Jan 28, 2016
Link to interactive graphics- Medicare Prescribing Patterns in Kentucky discussed above.
Let me know if any of the links above do not work.
2 thoughts on “A Different Look At Drug Prescribing in Kentucky.”
Comments are closed.