
Summary.
Both “hot- and cold-spots” of opioid prescription are easily found. The business address and volume of opioid prescriptions written by Medicare prescribers correlates very well with the volume of opioids consumed by non-Medicare patients and predicts where where they live. The Medicare Part-D Prescription Drug Database can be a useful instrument for medical professional, public health, and law enforcement organizations in dealing with America’s exploding prescription drug and opioid drug epidemic.
Background.
In its efforts to make our healthcare system more transparent, affordable, and accountable, the Cabinet for Medicare and Medicaid Services (CMS) has just released an on-line website tool map Medicare Opioids that allows anyone to create maps showing the distribution of prescribing for opioids at the state, county or 5-digit ZIP Code level. The underlying data comes from the same initial release of 2013 Part-D Medicare prescription data and is therefore geographically organized by the business address of each individual prescriber but is limited to the subset of patients covered by Part-D Medicare.
However, data accompanying the mapping application includes information not available in the earlier release including the number of prescribers in a given geographic area, and the percentage of all prescriptions written that were for opioids. (Who else could do this!) With this additional information, the number of opioid prescriptions per-prescriber within a given geographic region can be calculated. A few minutes of browsing easily demonstrates major geographic variation and “hot-spots” of both high- and low opioid prescribing at the five-digit ZIP Code level.
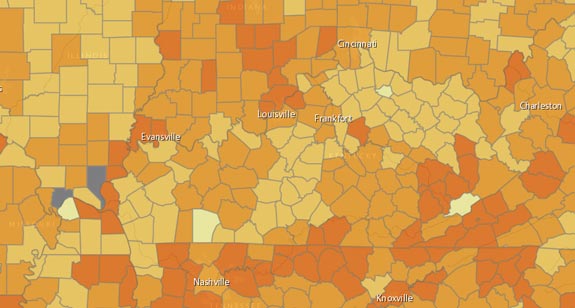
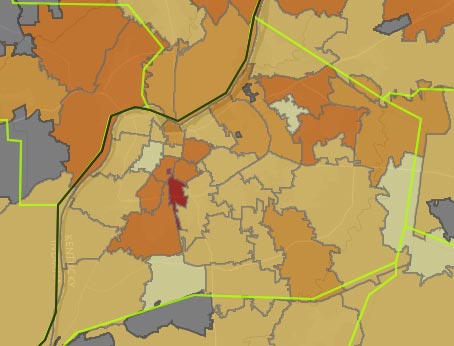
Examples: Opioid Maps for Kentucky counties and Jefferson County ZIP Codes. (Showing % of all Part-D drug prescriptions that are for opioids.)
Although Part-D data is organized around the address of the prescriber, I have recently been able to demonstrate that the number of prescriptions written by prescribers correlates very well with the location and number of prescriptions dispensed to Kentucky patients as entered into Kentucky’s KASPER opioid prescription database. This latter is organized by the locations of the prescriber and patient both. However, because KASPER was intentionally hobbled at birth to over-protect the confidentially of both prescribers and patients, geographic information is available to the public and professionals alike only at the county level for patients and at the 3-digit ZIP Code level for prescribers.
KASPER is an important part of Kentucky’s efforts to deal with prescription drug abuse and has the considerable advantage of including prescriptions written by all prescribers for all patients whose prescriptions are dispensed in Kentucky – not just those of Part-D Medicare providers and patients. As noted above, KASPER data is organized by where the patient lives as well where the doctor works. A major advantage of the Medicare data-set is that identifies individual prescribers by name, is able to track prescribing across state borders, includes virtually every drug know to man, and tracks cost to the consumer. In theory, the Part-D dataset should be complementary to KASPER and offers the potential to serve as as an indicator for the volume of opioid prescription in localities without other prescription tracking capabilities. In this respect, the Part-D data could be immensely useful for both professional, public health, and law enforcement organizations as we deal with the public health crisis of prescription drug and other opioid abuse.
Some data highpoints.
I invite readers to explore the CMS mapping website and data portal. Clicking on various locations on the CMS site discloses specific underlying data, identifiers, and state averages. Several underlying base-maps are selectable allowing for precise geographic localization. The not-unexpected geographic variation in prescribing frequency is much more dramatic at the ZIP Code level than at the county level! I invite readers with more knowledge of current local practices than I to suggest explanations for the small-area variations observed.
Kentucky data extracted.
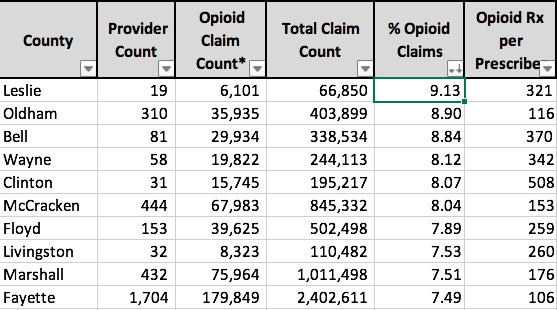
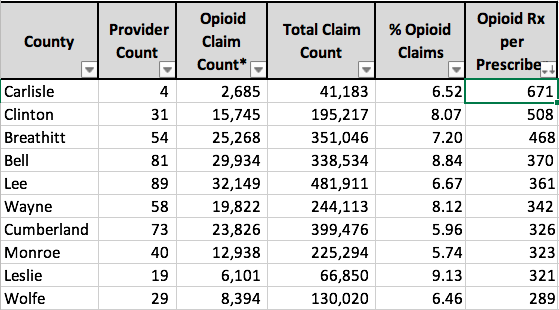
I extracted Kentucky’s complete data from the national Mapping Data-set, added a calculation of prescriptions per provider, and include the data in an attached spreadsheet, Kentucky Part-D Opioids 2013, for your use. Three separate tables are organized by County, 5-Digit ZIP Code, and Post Office (used as a proxy for city name). The tables are set up to easily be sorted for all data fields in order to determine ranking. For example, here are the top ten Kentucky counties ranked first by total opioid prescriptions and refills, the percent of all Part-D Medicare prescriptions in that county that are for opioids, and finally by the number of opioid prescriptions per prescriber.
Kentucky Counties: Top 10: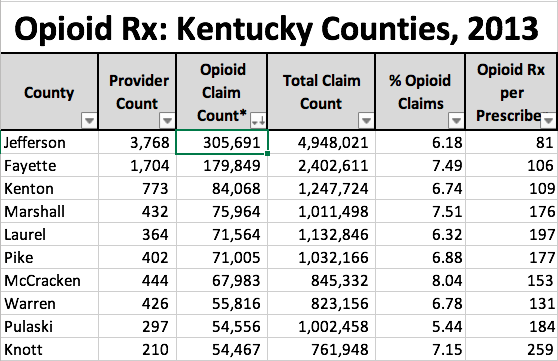
![]()
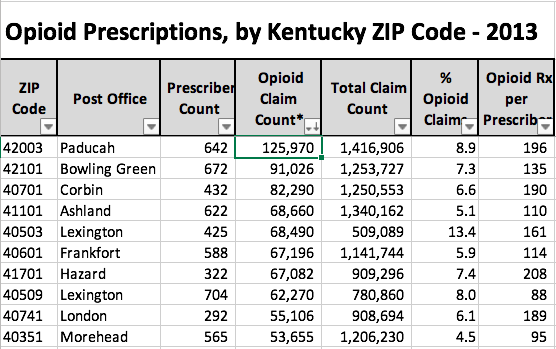
Kentucky 5-Digit ZIP Codes: Top 10.
(Note that 11 larger cities with the same name have more than one ZIP code. Louisville, for example, has 32.)
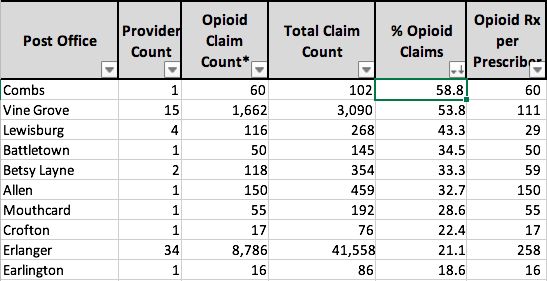
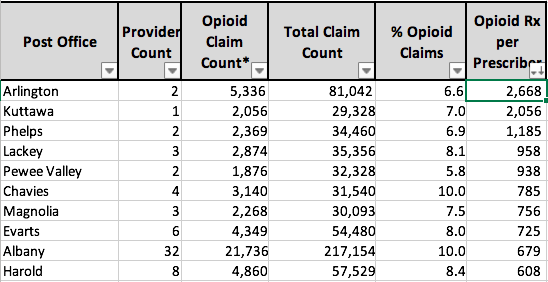
Post Office name: Top 10.
(ZIP Codes consolidated by Post Office name as proxy for City name.)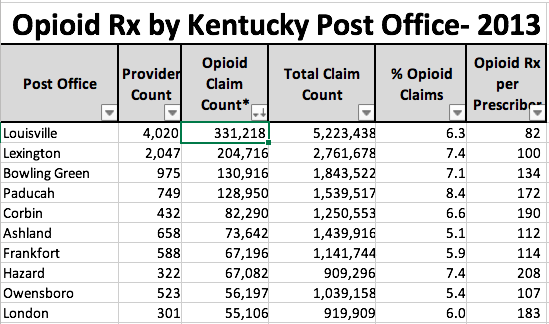
Comment On Data:
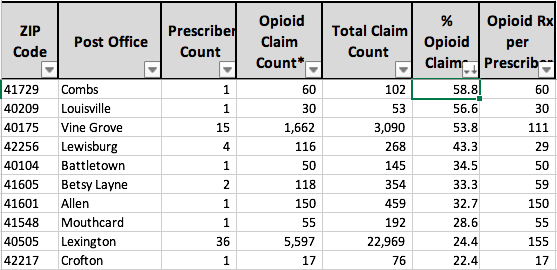
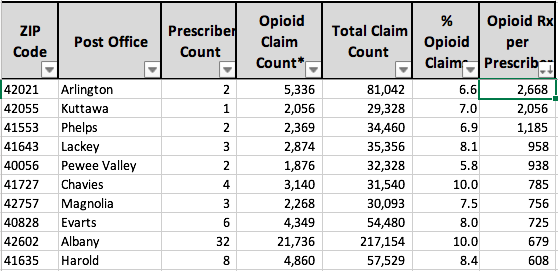
One could discuss the results above at length but I will not do so here. Note that Jefferson and Fayette Counties have the largest number of opioid prescriptions, but they also have the most prescribers and patients. When corrected for percent opioid prescriptions or opioid prescriptions per prescriber, the two large population centers mostly fall into the background and smaller localities rise to the top. Note that some ZIP Codes and Post Offices have very few prescribers but a strikingly high percent of prescriptions for opioids, and stunningly high numbers per prescriber. Just counting the total number of opioid prescriptions is only going to get us so far.
Correlation of Medicare Mapping Data with KASPER.
I speculated that if rates of opioid prescription for Part-D Medicare beneficiaries correlate well the utilization of opiates identified by KASPER and other all-payer data sets, that the utility of both approaches would be mutally enhanced. In other words, does knowledge of where prescriptions are coming from predict where the drugs will be used? Might individual prescribers identified in the Medicare data who would not otherwise have come to the attention of the public be fueling local use or abuse of prescription drugs for the population at large? I believe the answer to both questions is yes!
My poor man’s approach blown away!
My first attempt to correlate Medicare data with real-world experience started by pulling prescribing data from places that had come into public’s view because of obvious criminal or medical problems involving controlled substances or illegal narcotics. I was not surprised to see that places like Austin, IN or southern Ohio (where drug abuse is rampant) were also places where Medicare prescribers were writing for large amounts of opioids. For example, in southern Indiana, the prescription drug of choice was being made abundantly available by local healthcare professionals.
However, I needed a better way to attempt to a correlation between prescriptions for Medicare beneficiaries and the general public. I thought I had found a potential winner by using publicly available, all-payer KASPER data. The Cabinet helpfully provided me with a consolidated report of opioid prescriptions for all of 2013. The de-identified data contains the number of opioid prescriptions by providers organized by 3-digit ZIP Code, and the number of opioid prescriptions filled for patients and organized by their county of residence.
Before the release of the Medicare mapping data, attempting to get the Medicare and Casper data to line up properly for a comparison was a tedious process that took a good bit of my last few weeks. For starters, the only geographic data available to me without a start-over and tedious series of look-ups to other separate databases was the name of the city. To make a comparison with the KASPER data sets, I had to identify the corresponding county for a few hundred cities and towns and, the three-digit ZIP Codes used by 120 different counties. The procedures I used were too tedious to describe here and now the need to do so is vanishing. Let me be the first to admit that trying to make these two data sets play nicely together would have introduced a number of problems. For example, I am quite certain that KASPER uses a different definition of “Opioid” then I have been using, or for that matter the unidentified set of opioids in the new Medicare mapping set. Medicare can pick up interstate-border prescriptions by providers, but KASPER will have trouble doing so. A few cities straddle county lines and several cities and counties have more than one 3-digit ZIP Code. I had to reconcile a few different spelling and abbreviation conventions to boot.
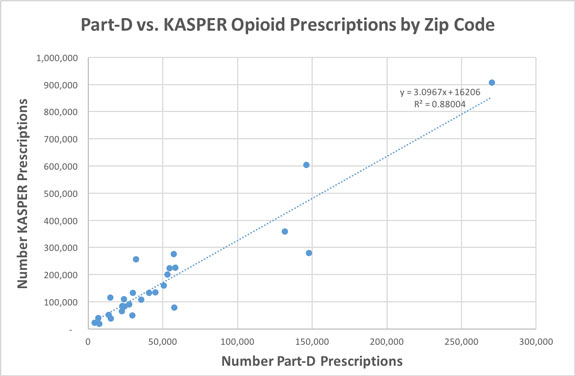
Nonetheless, even with these and other shortcomings, and despite the presence of few oranges along the apples, there was a very high degree of correlation between the geographic location of Medicare prescriber and that of the all-payer Kentucky patient with an R-squared of 0.91. To put this statistical benchmark into perspective, an R-squared of 1.0 describes a perfect 1-for-1 correlation, and an R-squared of zero indicates no correlation whatsoever. Here is a representative graph from one of these initial attempts comparing the total number of opioid prescriptions per county in the the Medicare and KASPER datasets. (Note that I did not plot the points for Jefferson and Fayette Counties because their numbers were so large they crunched all the other numbers into the corner. However, I kept the scales intact and all the data is included in the statistical analysis.)
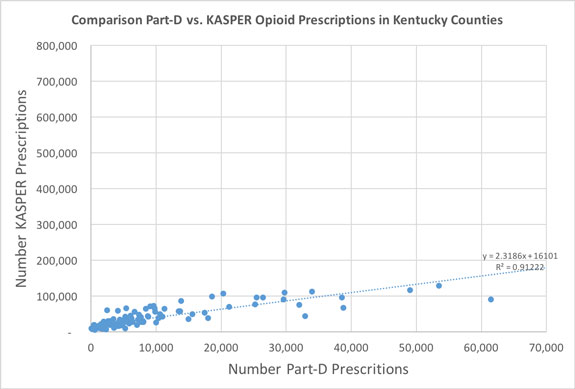
Note that as expected, opioid prescriptions to Medicare beneficiaries contribute only a portion of the total to Kentuckians. A correlation number of opioid prescriptions by 3-Digit ZIPS gave a similar result with an R-squared of 0.88.
 Actually, I was pretty gratified with these results!
All for naught.
I had prepared tables and graphs for publication in these pages describing my conclusions when CMS released its current small-area-mapping solution. The reader should be aware that the number and location of prescribers and prescriptions included in the Medicare Mapping Dataset is considerably greater than included in the initial release. To protect patient (but not prescriber) confidentially, the earlier detailed drug- and prescriber-specific data did not include individual prescriptions for any given drug by a unique provider to fewer than 11 patients. In the current consolidated release, those prescriptions are now rolled-up with the rest. Although great for identifying hot- and cold-spots, the mapping solution but does not address the issue of how generalizable the Medicare results are to the general prescriber and patient populations. Therefore, I re-did the comparison of available but intentionally hobbled KASPER data, with the new high-resolution Medicare Mapping Data. The correlation of the two remains high with an R-squared of 0.77.

How did we get here? How do we go somewhere else?
Much has been written and more is on the way about the causes of prescription drug abuse and opioid addition. Excessive, unsupported, and even illegal marketing by the pharmaceutical industry – especially as a treatment for moderate pain – is the current favored whipping boy. A seemingly well intentioned push labeling the perception of pain as a fifth vital sign to be “normalized” is another. The increasing availably of illegal narcotics like heroin (for which prescription drugs are a common gateway) is blamed to divert attention from how people commonly get hooked in the first place. Inhibiting prescribers from saying no to drug-seeking patients may even be the the ubiquity of anonymous physician evaluation websites on which a patient who has been denied can seriously damage a physician’s reputation and income without recourse or even a way to remove the damage. (There is no better-satisfied patient than one who is getting all the pills they want!)
No matter what the causes, as controllers of the flow of most prescription opioids into the pipeline, physicians and other prescribing professionals had their hands on the throttle and failed to act. This was not a matter of lack of education. Forty years ago in my medical training I was told that what we are seeing today is a predictable and unavoidable consequence of the use of opioids. More education was offered as the solution to the General Assembly which mandated additional continuing medical education about opioids as a condition for medical licensure renewal. I completed the mandated KMA-sponsored Opioid Addiction CME course. I think that 90% of the non-medical general public could have passed the final exam without any preparation at all. I certainly did, and I haven’t prescribed opioids in 20 years or more. Claiming that more education is necessary and will be effective is simply a means to temporize while matters get worse. Already this week we are being told that a host of our addictions are causing an unprecedented shortening of the average of lifespan of Americans. Whether we caused the epidemic of prescription drug abuse or not, we physicians are in the middle of it. It is time to act.
No more covering up.
Given the observations above, I conclude that using the available nationwide Medicare Part-D utilization data for opioids is a defensible first step to identify problem places and problem players in the prescribing of controlled substances. Because Medicare identifies individual prescribers by name, it is no longer possible for unscrupulous, unknowledgeable, or careless prescribers to hide in the shadow of their more professional counterparts. There should be no need to wait for specific complaints to arise before obvious outliers are looked at.
Statistics and common sense suggest that it is reasonable – indeed necessary – to ask if volumes of opioid prescriptions that are so far so far the from norms set by professional peers are still within the standard of medical care. On investigation, perhaps some of these far-outliers will be justifiable. We already know that many of then will not be. Our professional licensure boards have a statutory obligation to protect the public. Licensure boards, public health officials, and law enforcement entities have been given a gift by Medicare. They should be empowered to use it. Allowing our current epidemic of prescription drug abuse to continue under the enabling protection of professional privacy is no longer defendable. That’s my opinion. What’s yours?
Peter Hasselbacher, MD
President, KHPI
Emeritus Professor of Medicine, UofL
10 Nov 2015
4 thoughts on “Medicare Releases On-Line Application To Map Opioid Prescriptions.”
Comments are closed.