
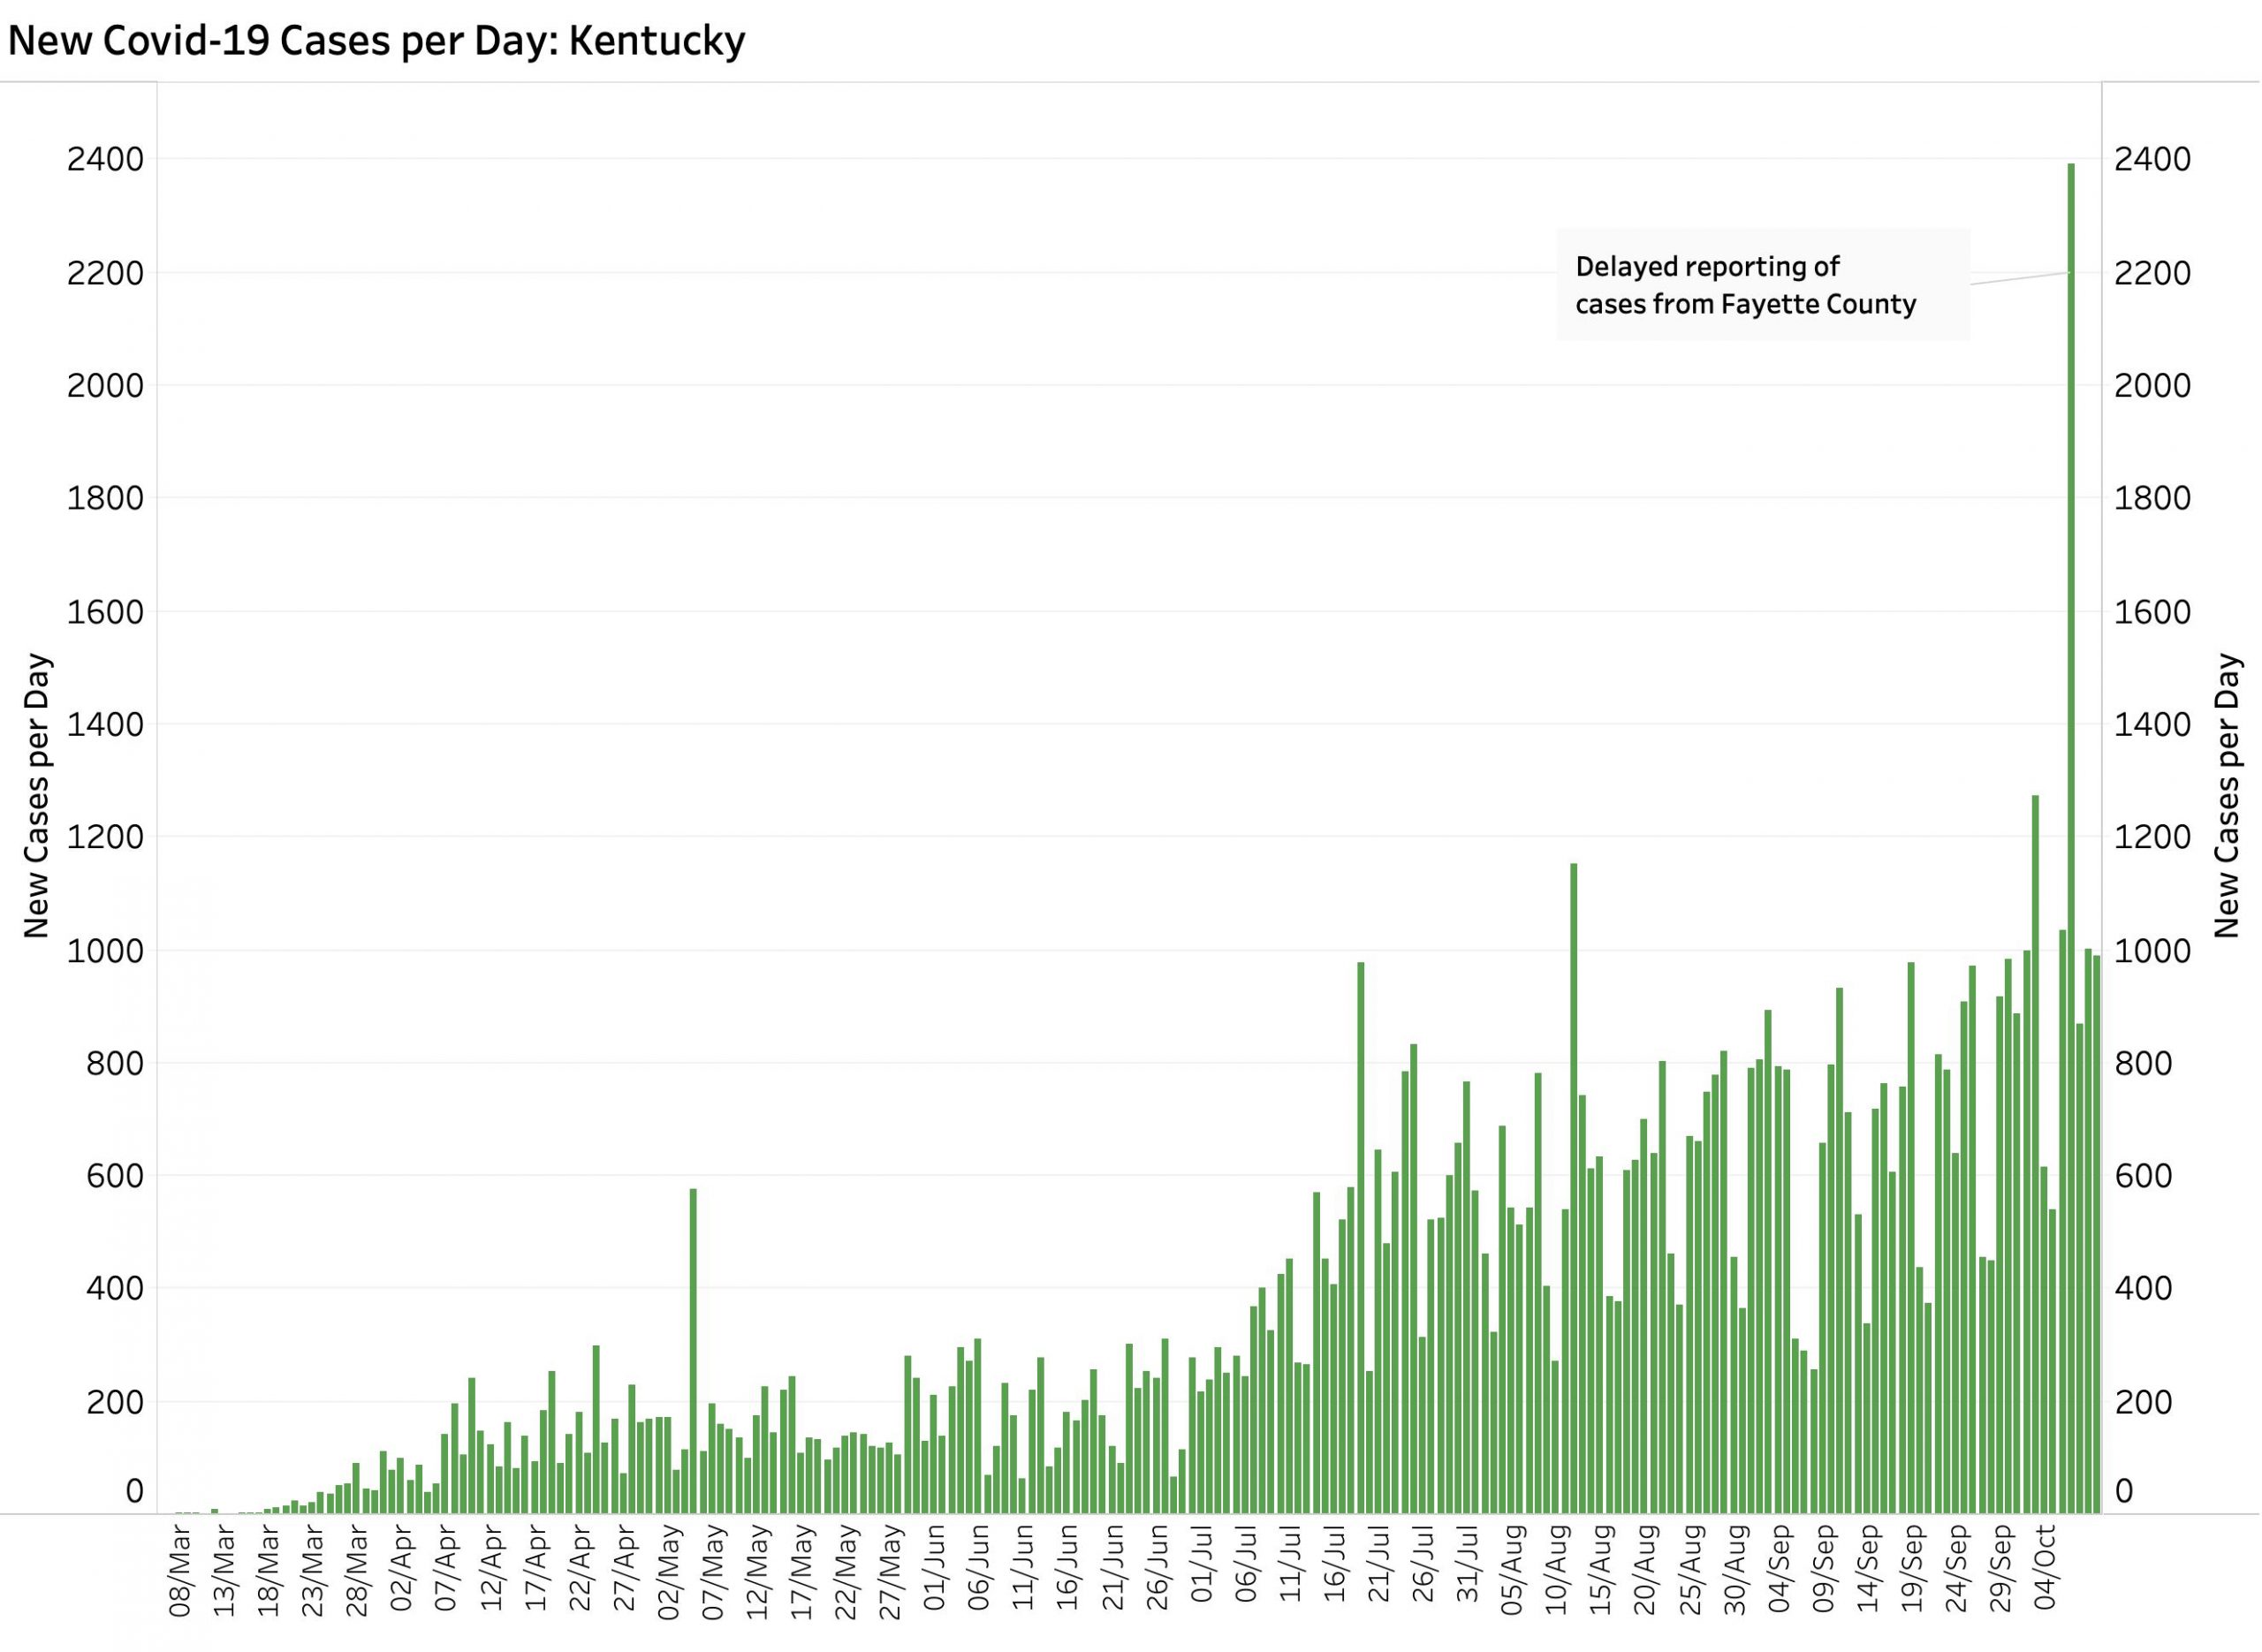
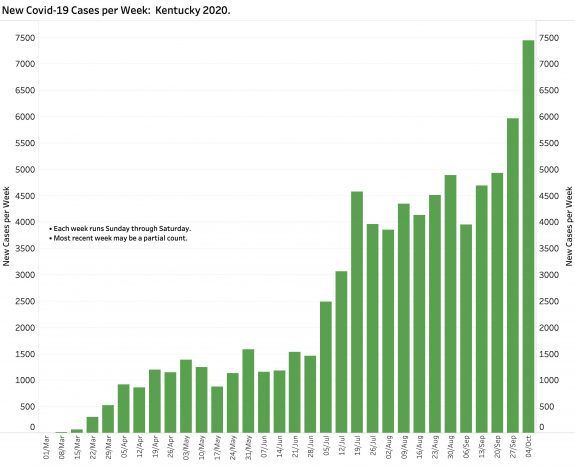
We were given plenty of warning that this week was going to be the worst yet of our first 32 weeks of Covid in Kentucky. It was– by far. With 7444 new confirmed cases, we appeared to leapfrog over the 5965 cases of the previous weekly high that ended October 3d. The height of the jump was artifactually magnified by an unexpected and inexcusably delayed reporting of at least 1472 old cases from Fayette County on October 7. Perhaps this was related to the large numbers of positive tests among students at the University of Kentucky. I am unaware of how far back these cold cases stretched. On the one hand, these strays confuse the significance of the new current state “spike.” On the other, depending on which days the backfill should have been reported, it means that rather than hovering about a possible new higher plateau that would have been the lesser of two evils, that we have been continuously escalating the rate of growth of Kentucky Covid for some weeks. That is not a comfortable possibility. The state deserves better. If Fayette County with all its resources cannot report its cases to Frankfort in a timely and accurate manner, what confidence can we have that the 119 other Kentucky counties, distributed as they are among an assortment of semi-independent public health departments, are not also having difficulties in managing their own local information?
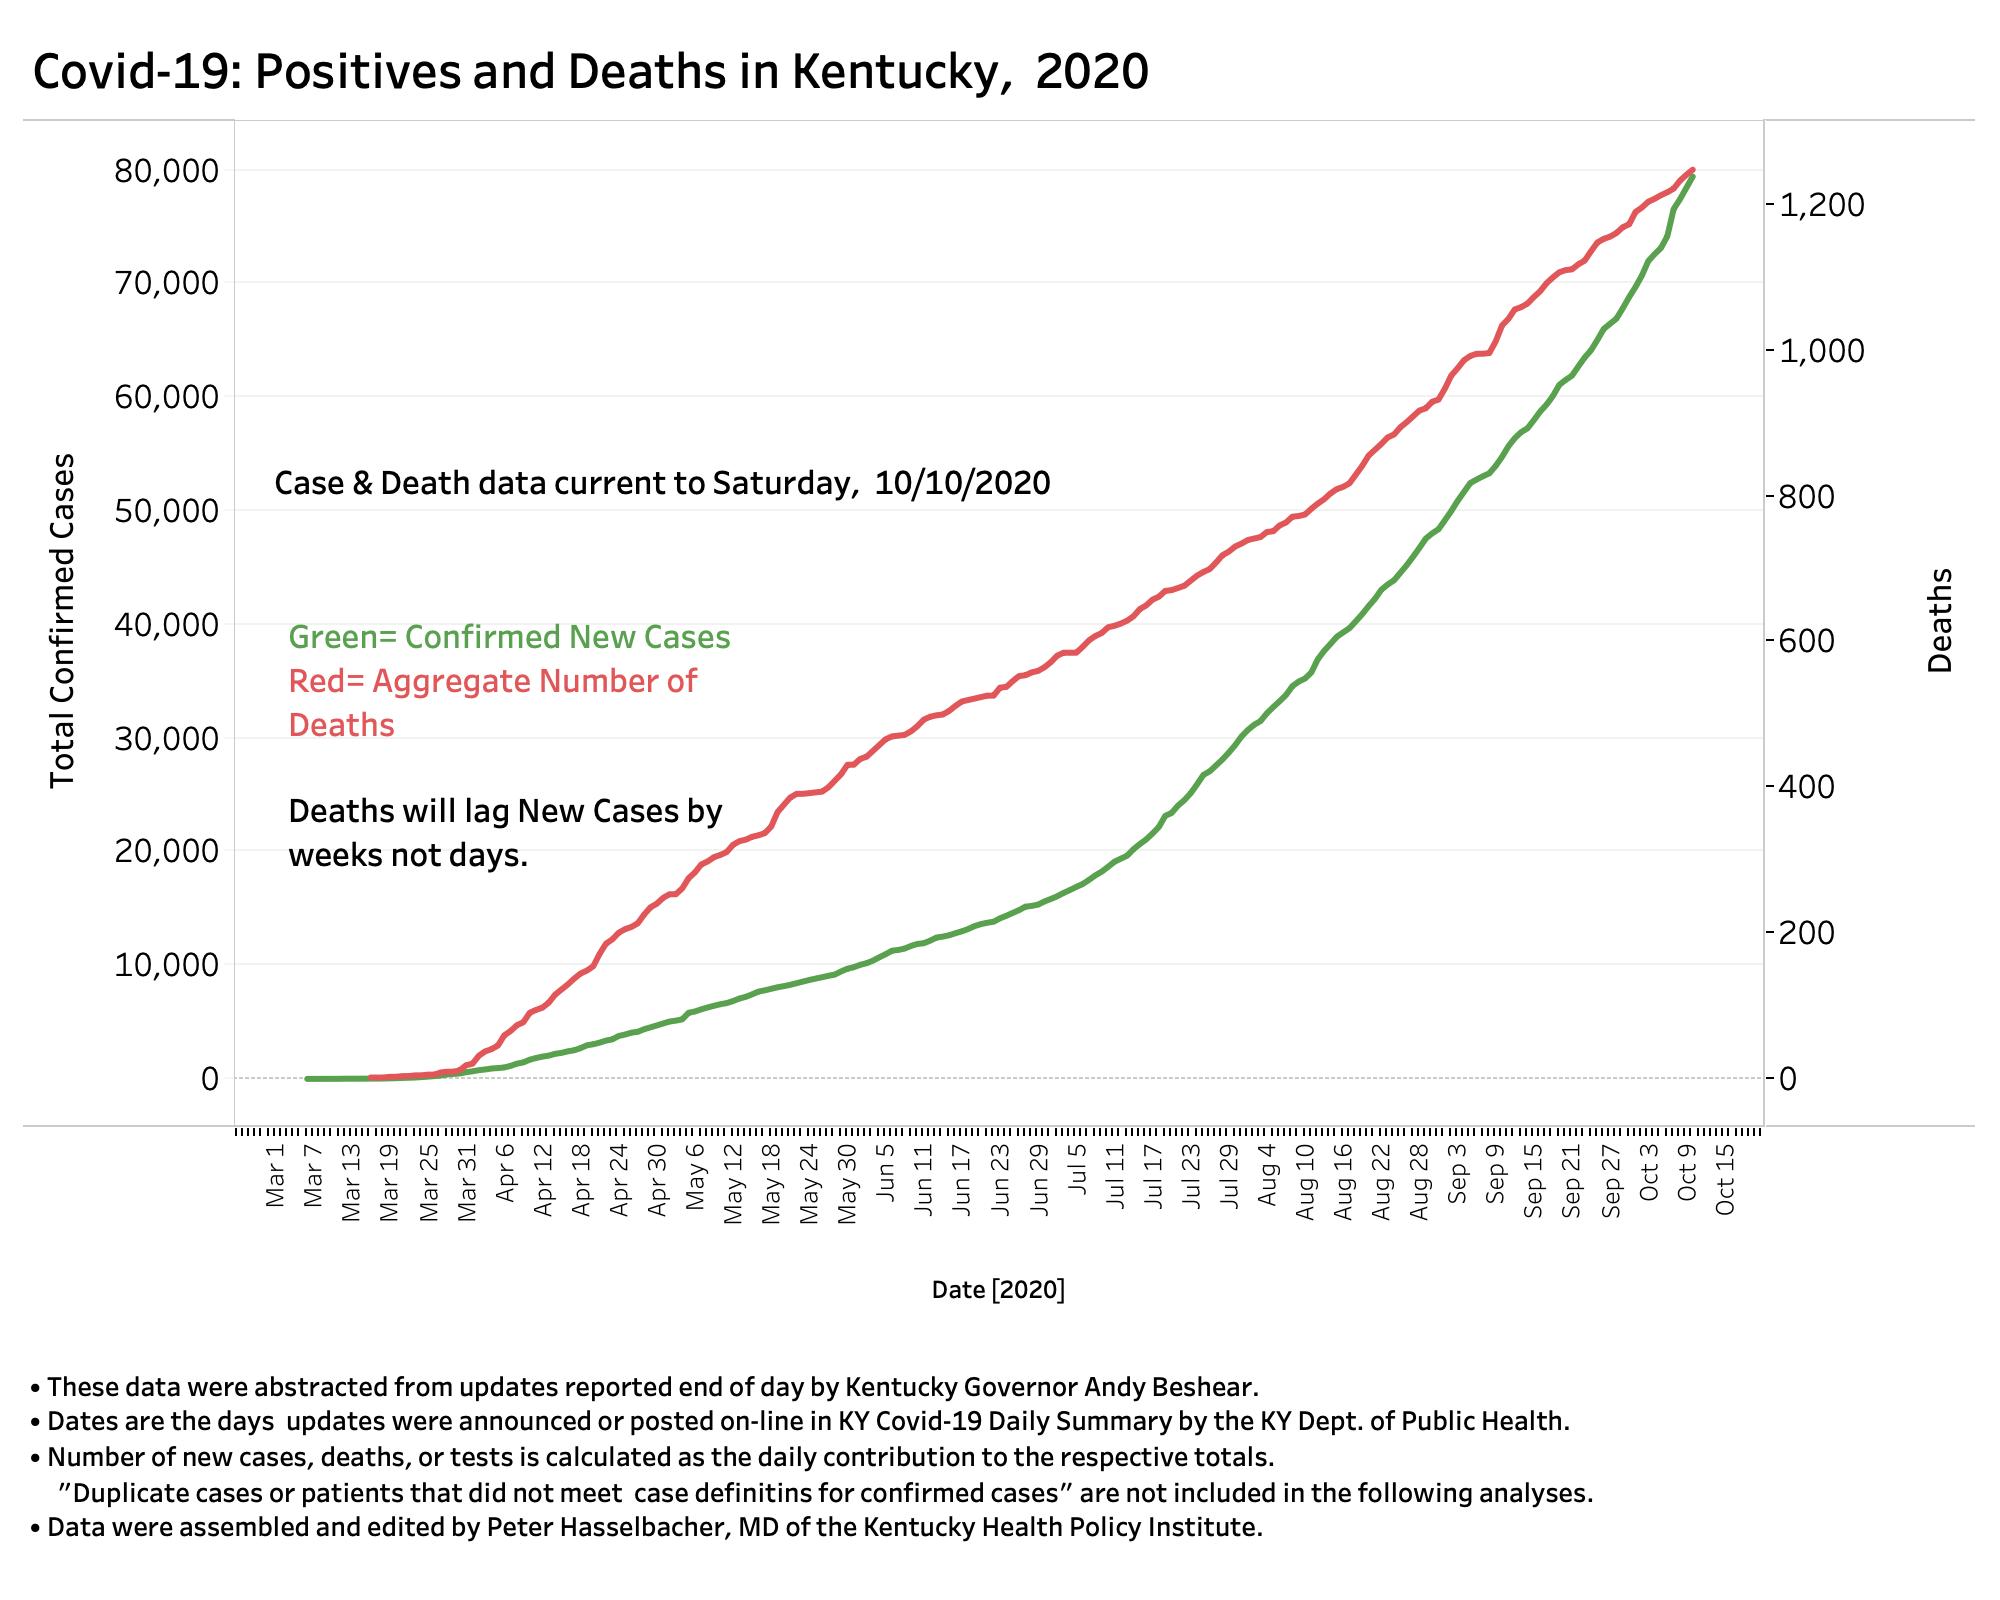
I do not have the information needed to venture much more commentary. I am not aware such has been made public. I offer below a limited assortment of KHPI data visualizations. The full workbook of Covid-19 Tracking graphics is available on KHPI’s Tableau Public website, along with a separate workbook of individual county Covid-19 epidemiologic curves as described in the most recent articles in this series. The following overview graphic shows as well as the more complex visualizations the relentlessly increasing impact of this virus.
The following are bar charts of daily new confirmed cases, and of the weekly cases back to March.
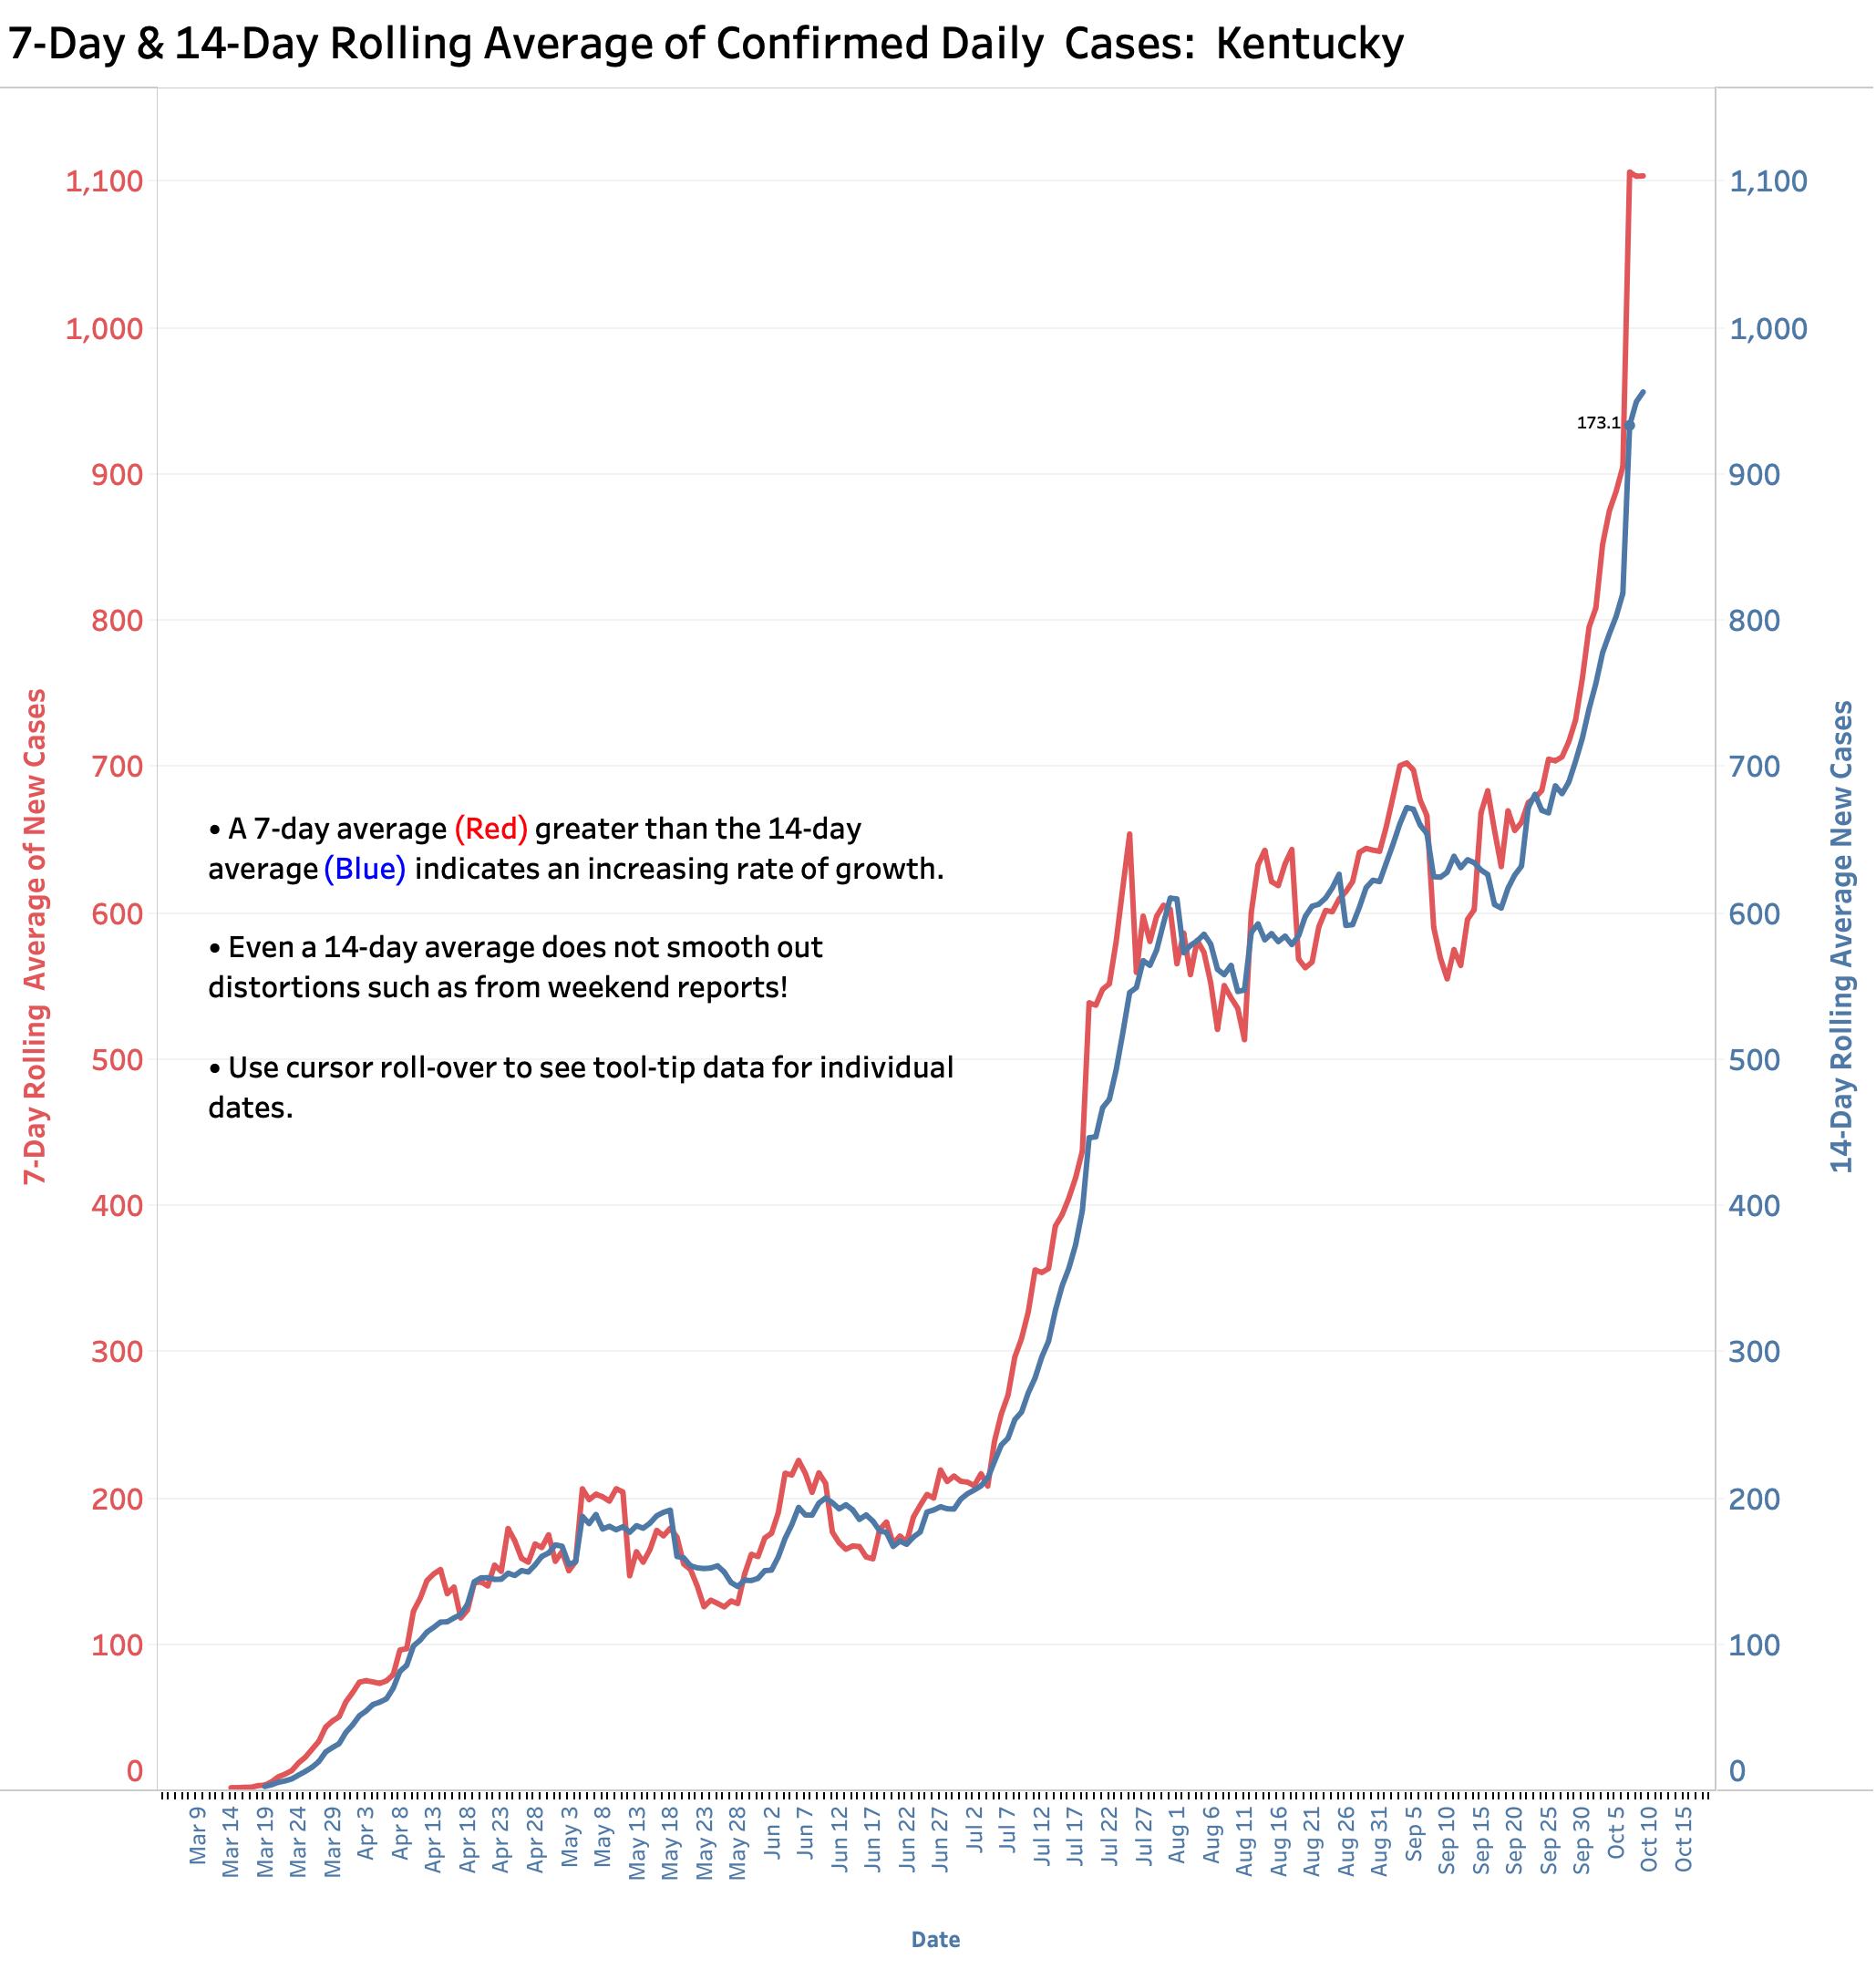
This plot of both 7-Day and 14-Day rolling averages of new cases makes clear the dramatic rise in the rate of growth of the epidemic in October. Even before the October 7th Fayette report, the 7-Day average was rising faster than the 14-Day average signifying an expansion of the rate of new infections.
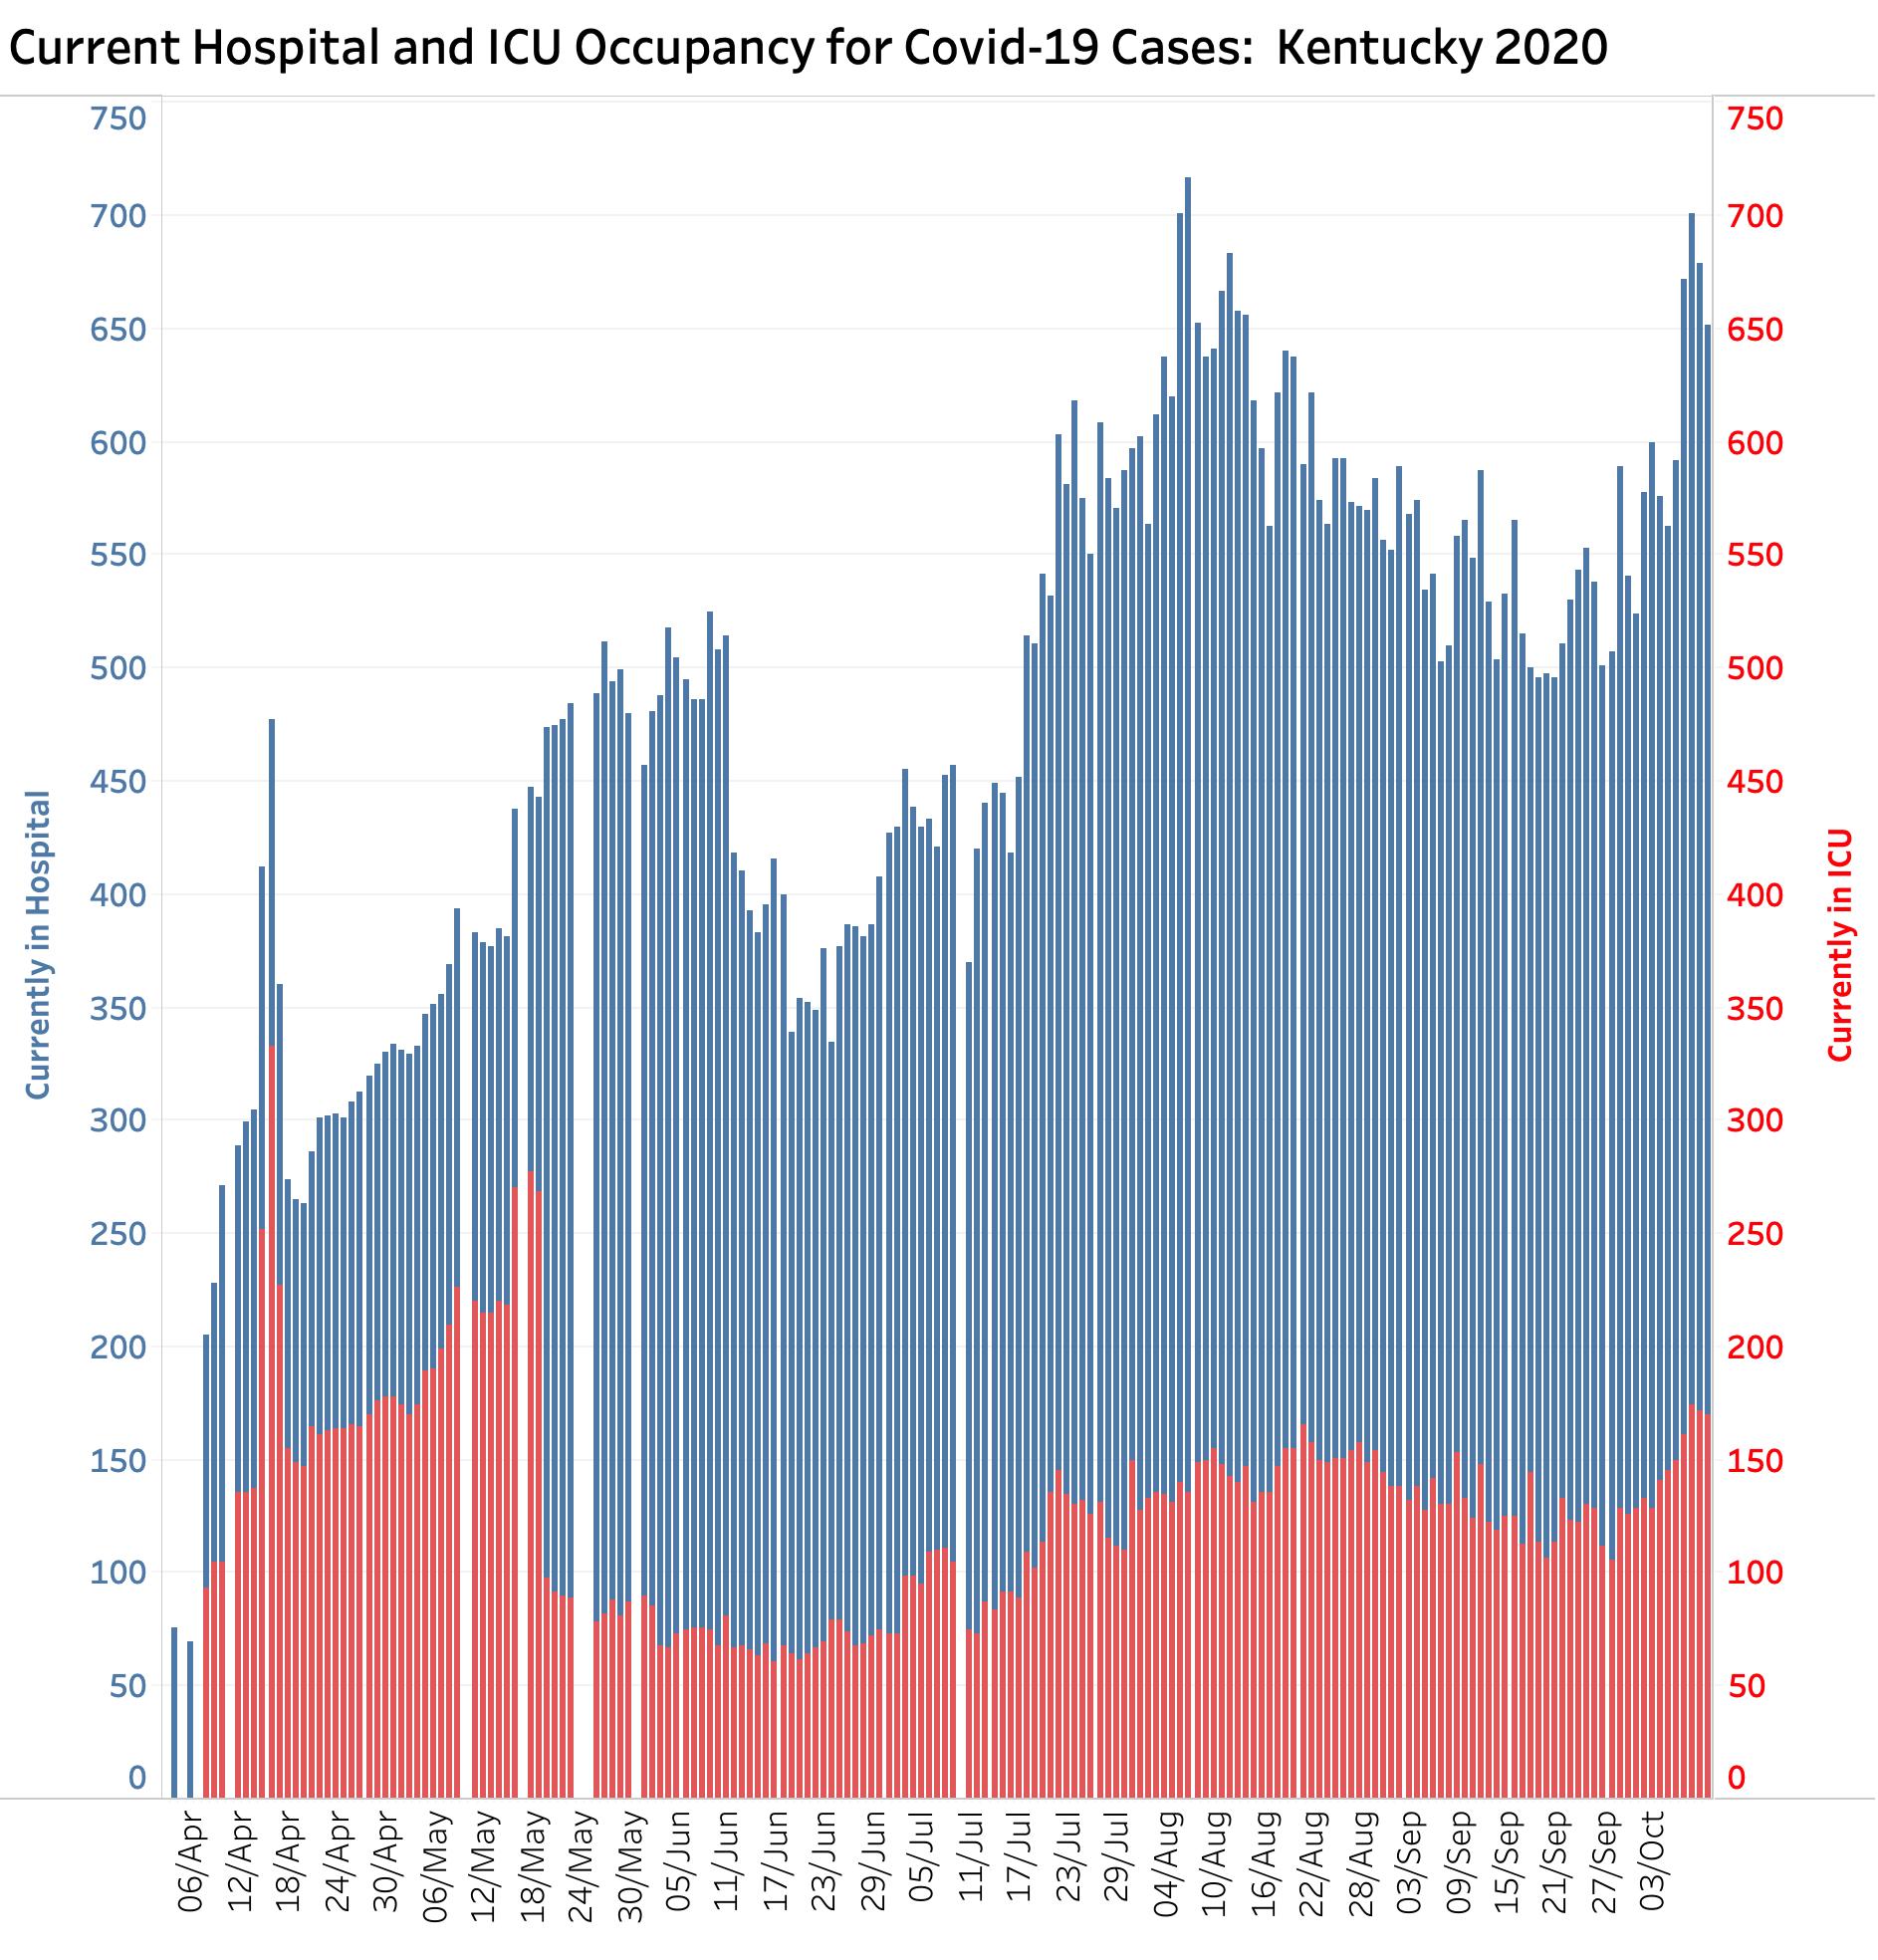
That our state-wide communities are actually getting sicker is supported by the most recent reports of hospital and ICU utilization for Covid-19 patients. We are approaching new highs, but these hospitalizations reflect new infections of around one month earlier. We probably have not yet begun to see the effect of October’s new cases.
Kentuckians– we are our own best hope!
In a recent pair of articles in this series, I was able to document that the Covid-19 virus is alive, well, and reproducing in every county of the Commonwealth. An excuse not to wear masks or follow other basic public health measures because the epidemic is a problem only for somebody else as in big cities is no longer rational. I would like to believe that the inhabitants of every county, indeed every community of any size throughout the Commonwealth would feel some responsibility to take care of each other. Without such a sense of neighborly good will, I can only assume the worst is yet to come.
Peter Hasselbacher, MD
President, KHPI
Emeritus Professor of Medicine, Uofl
October 11, 2020