
New Cases.
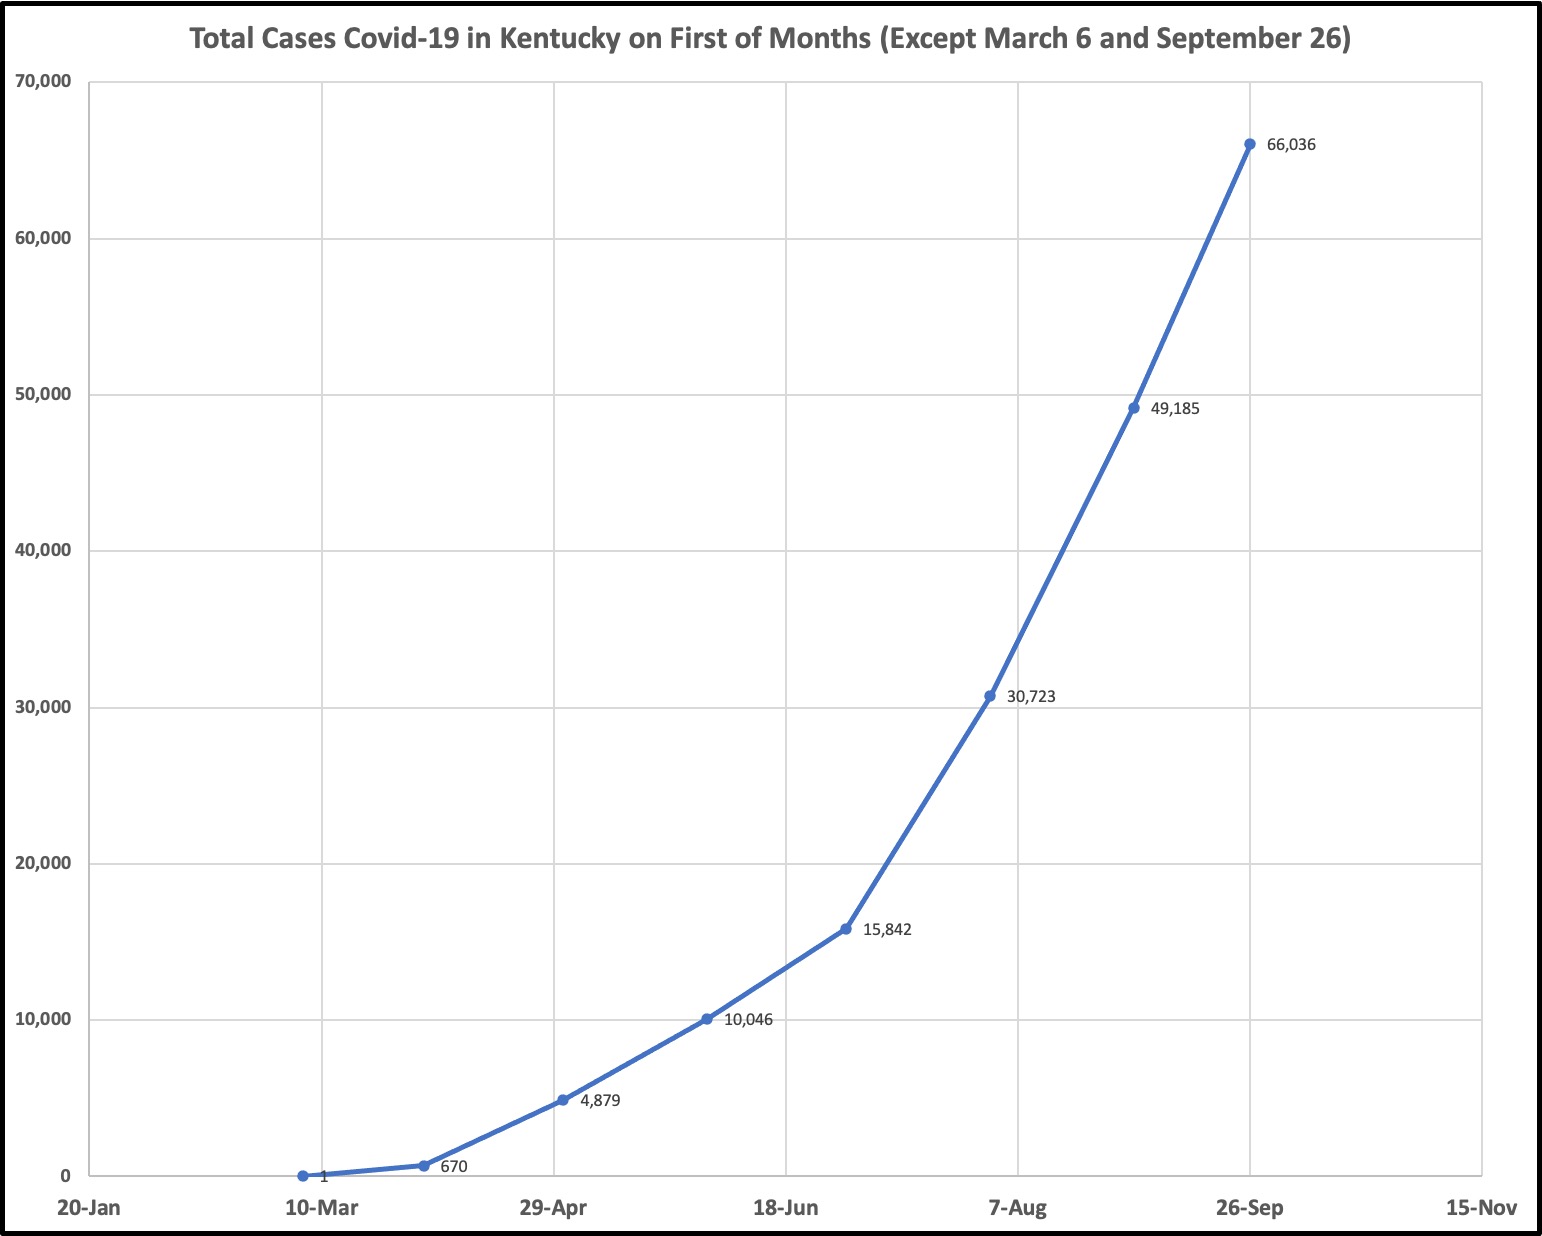
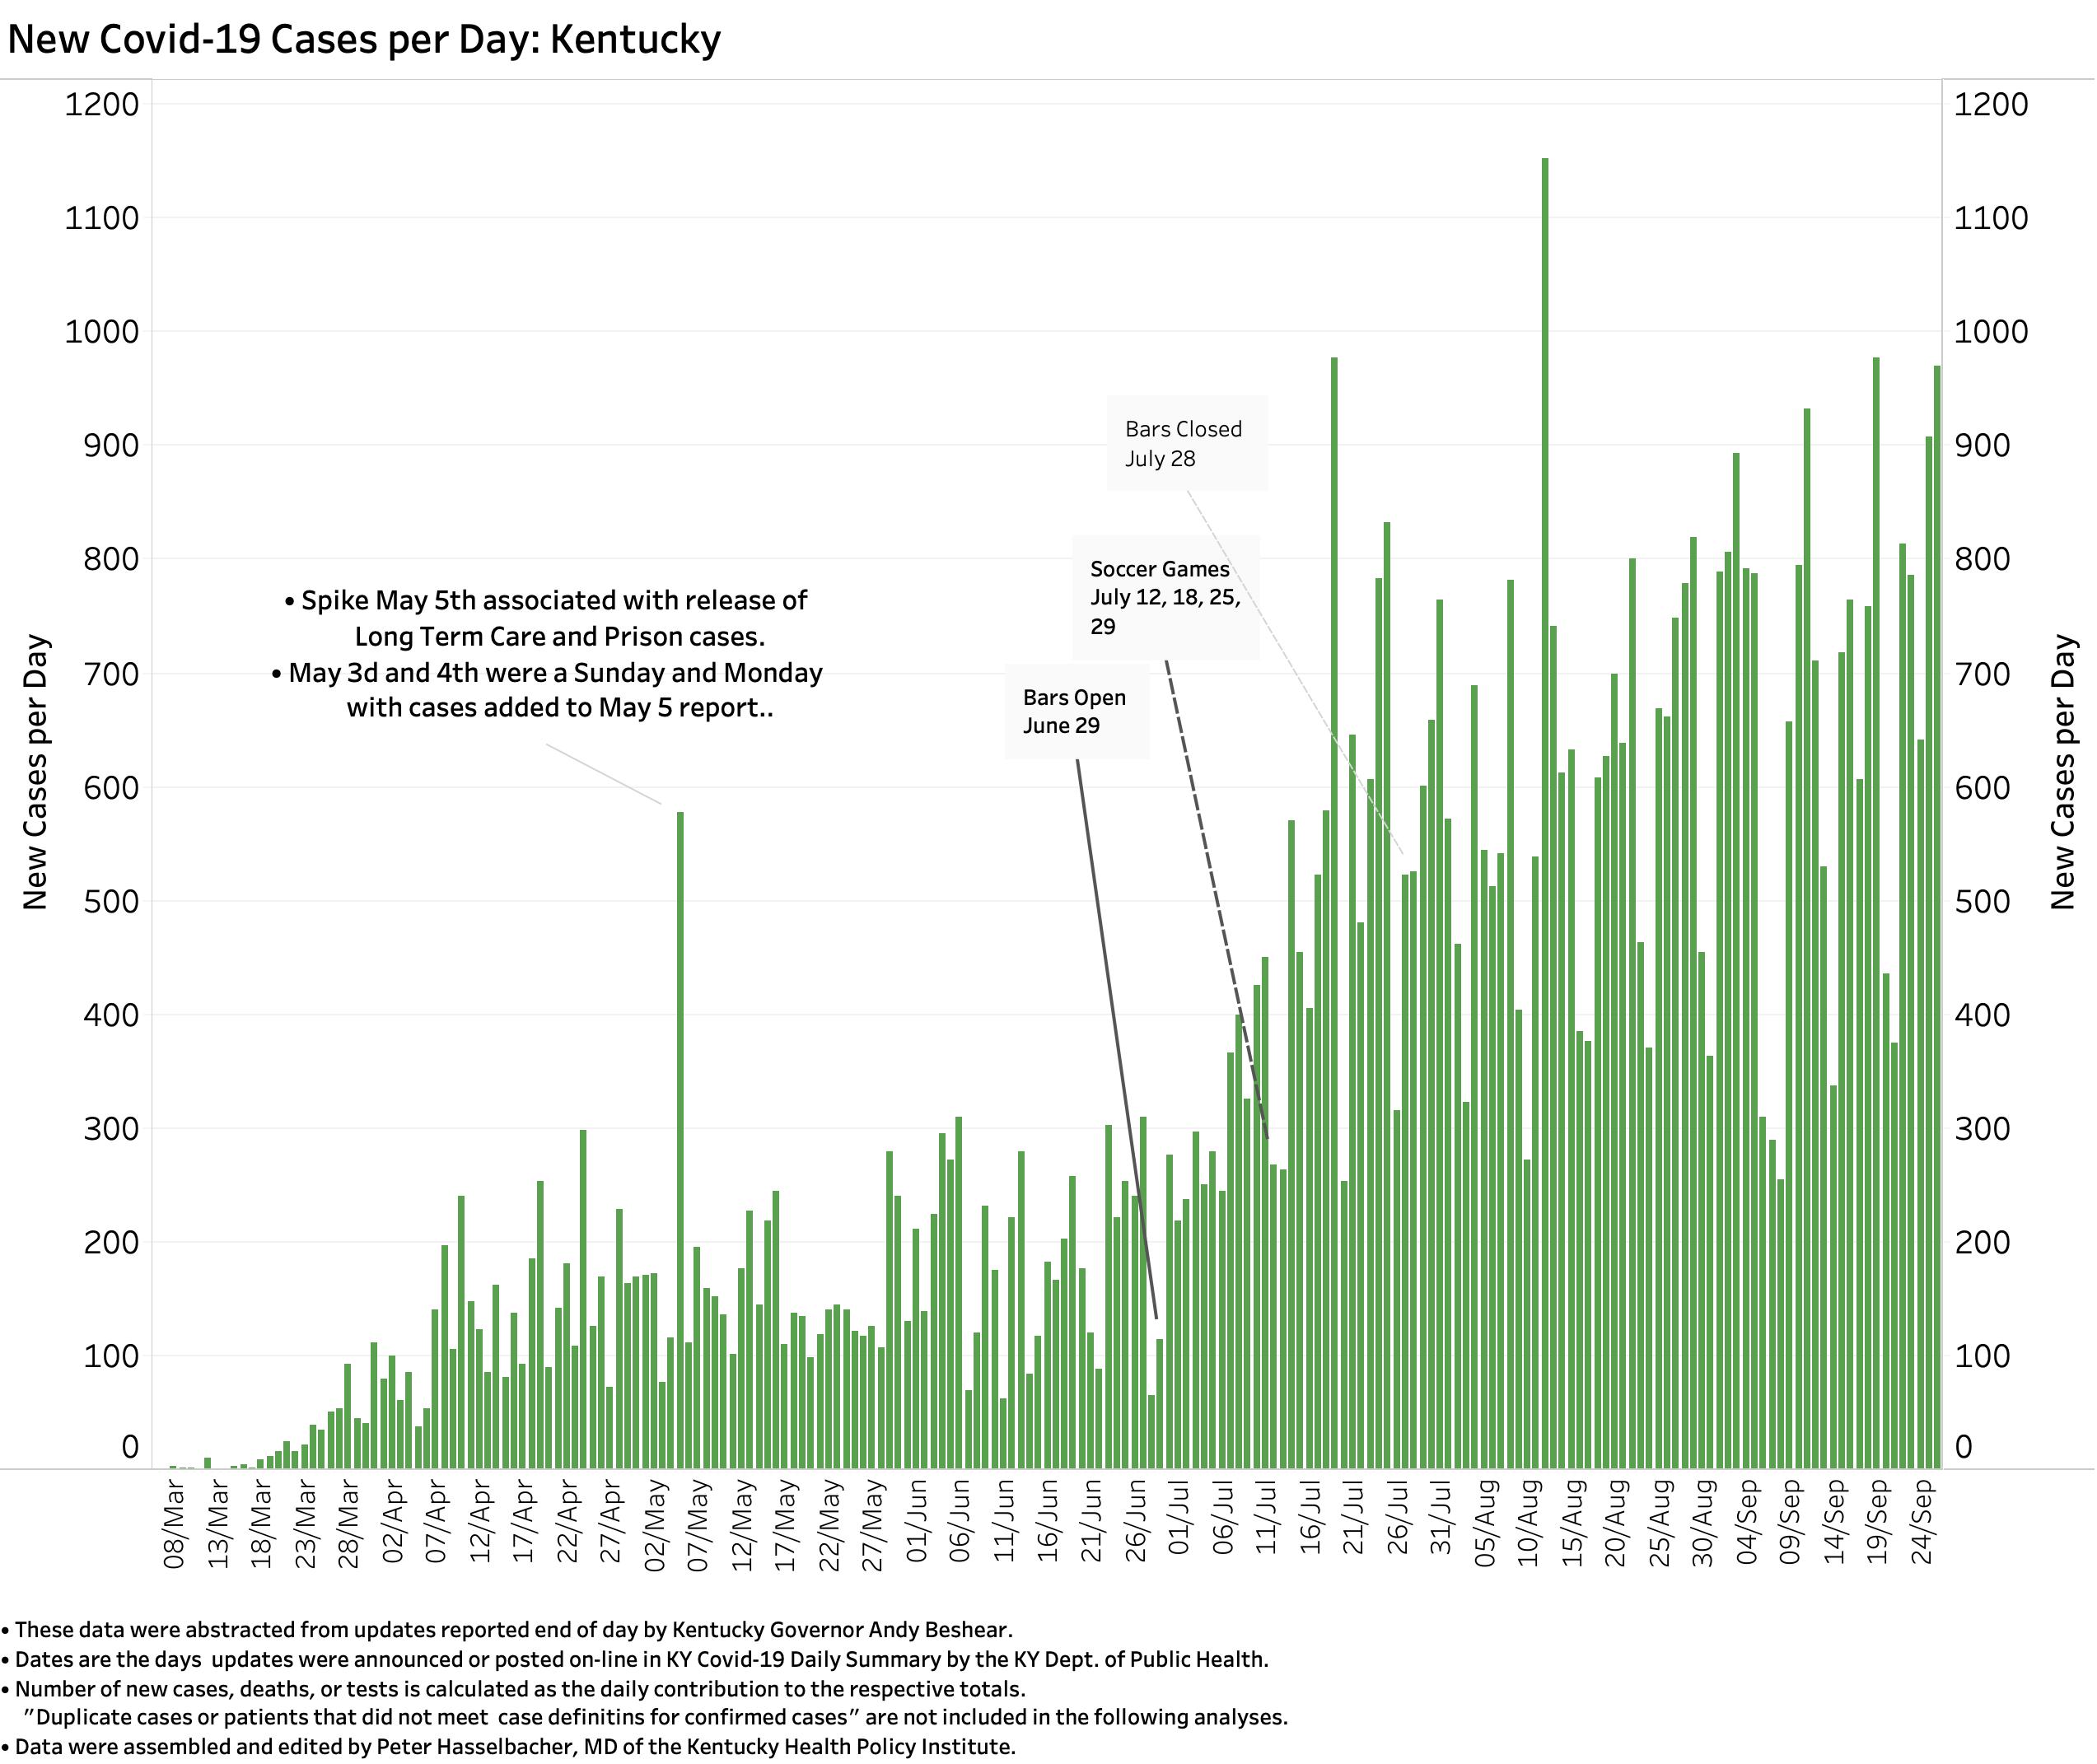
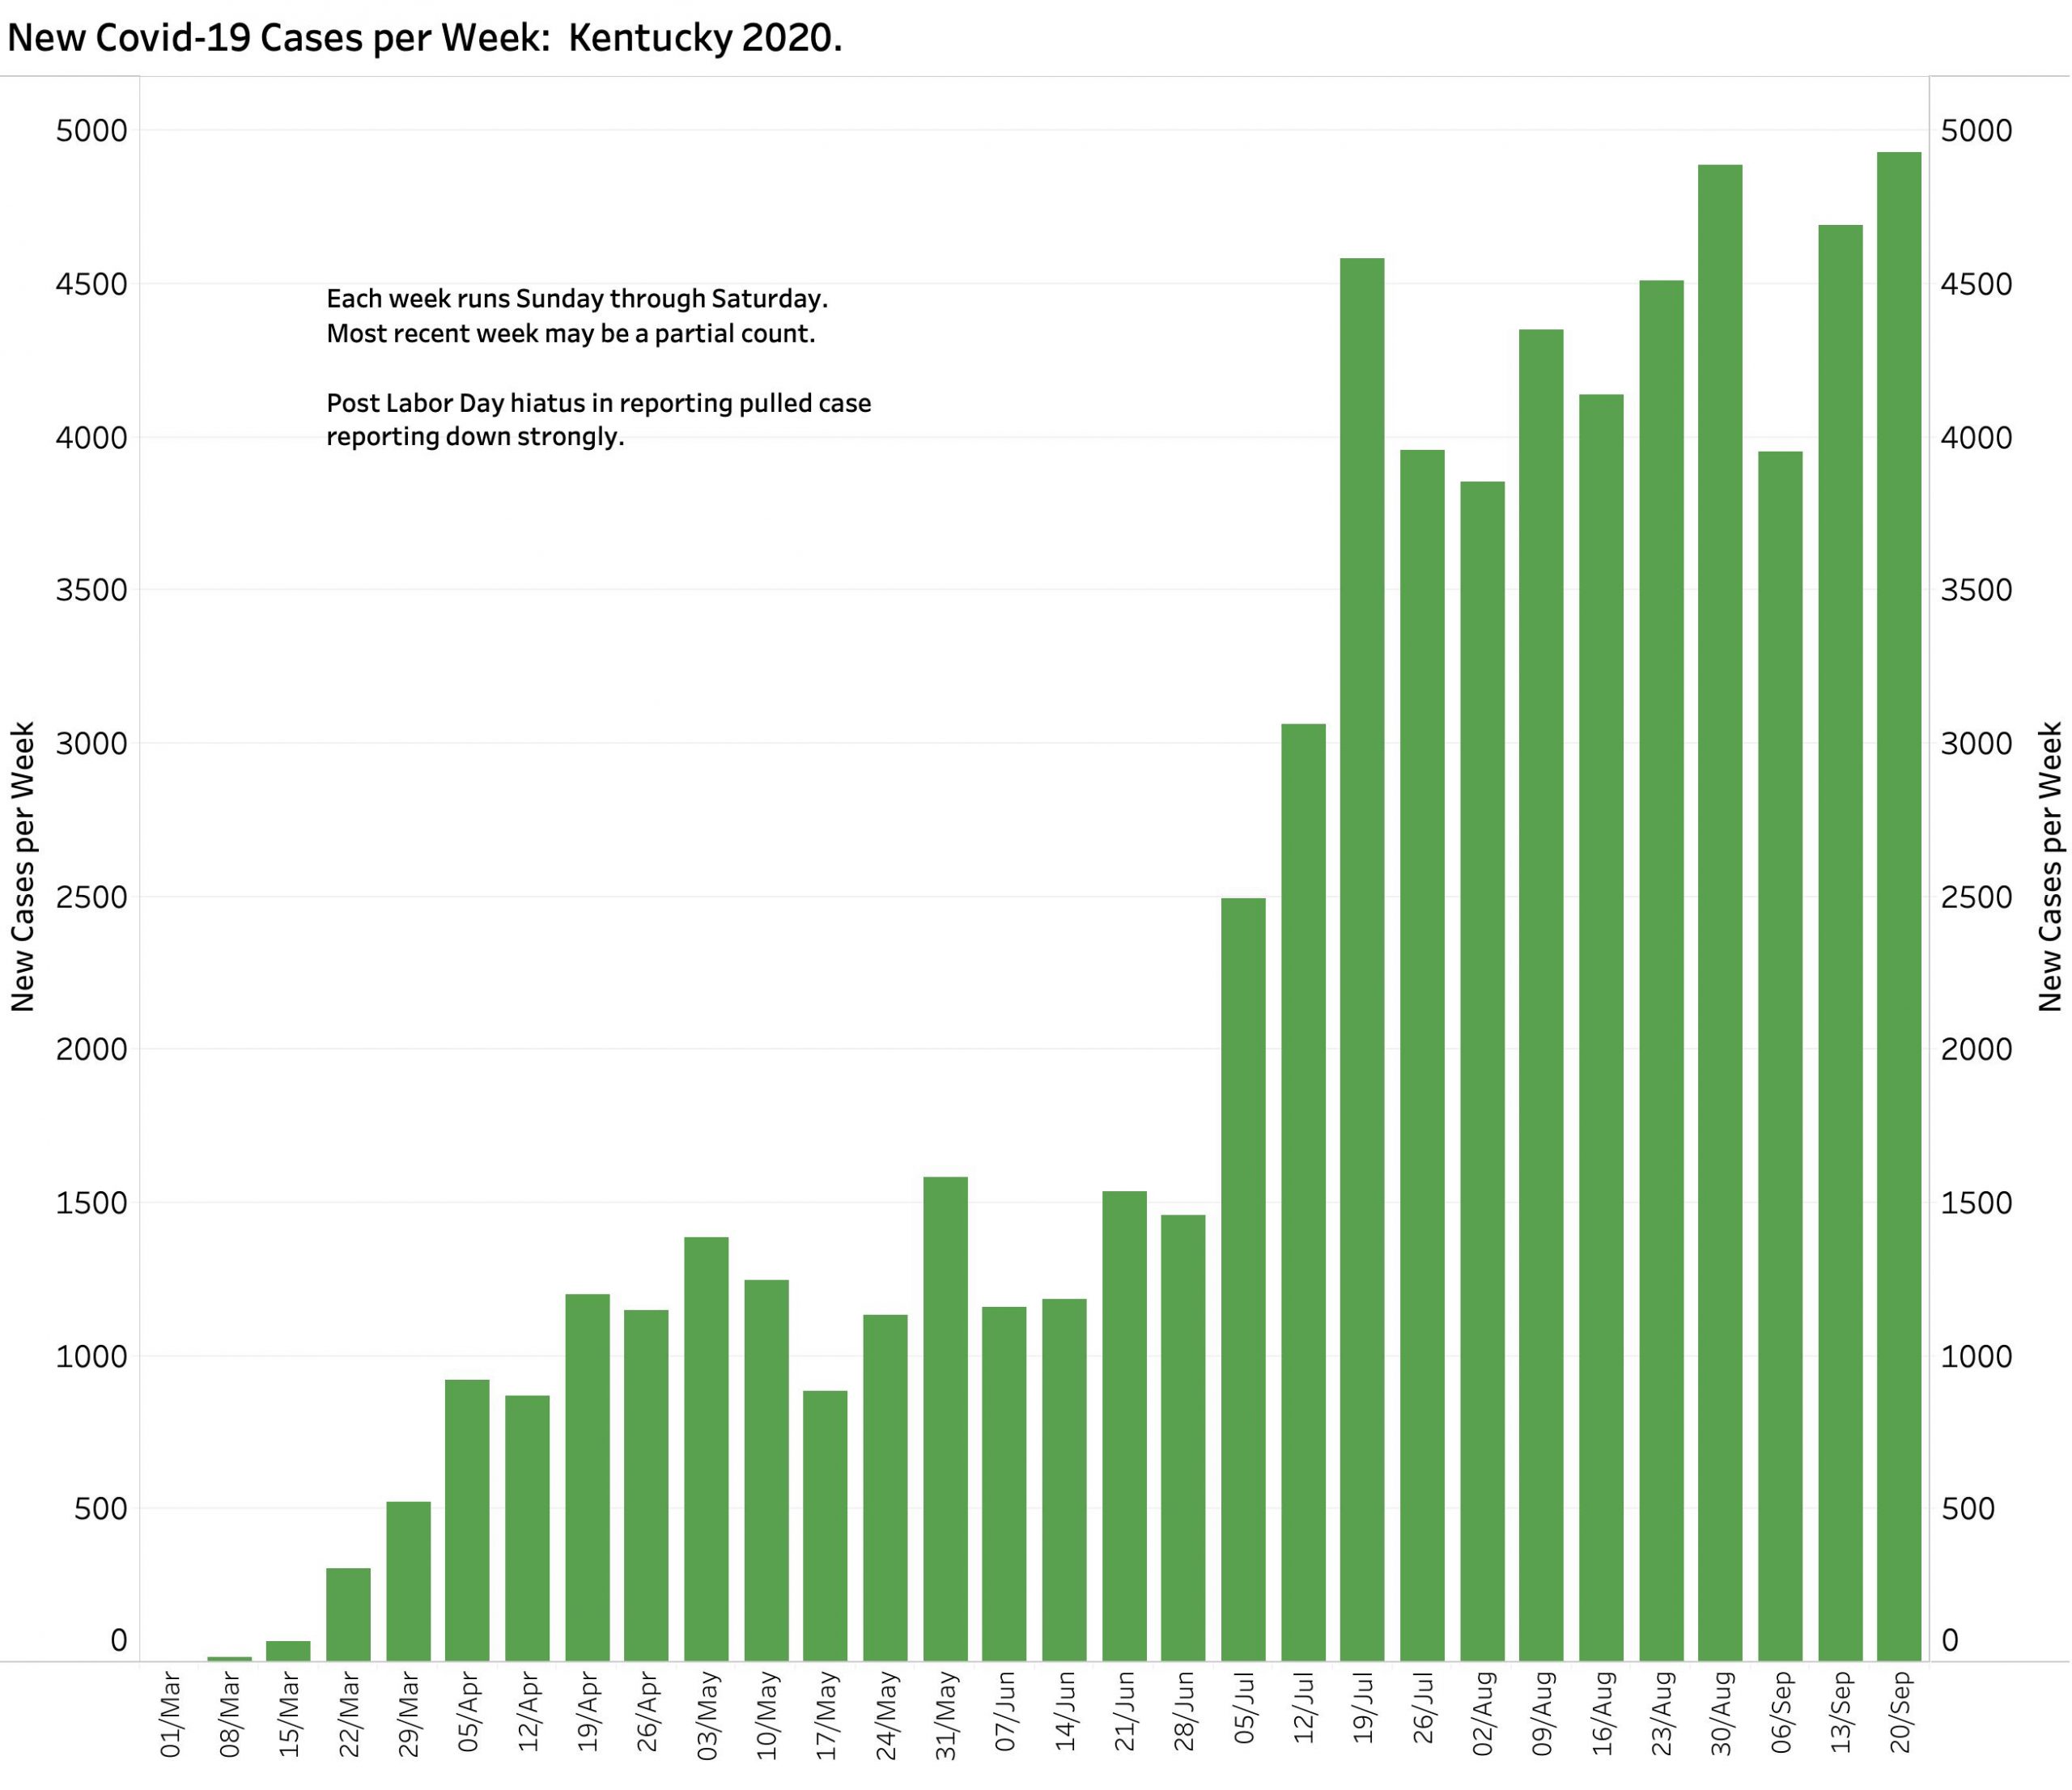
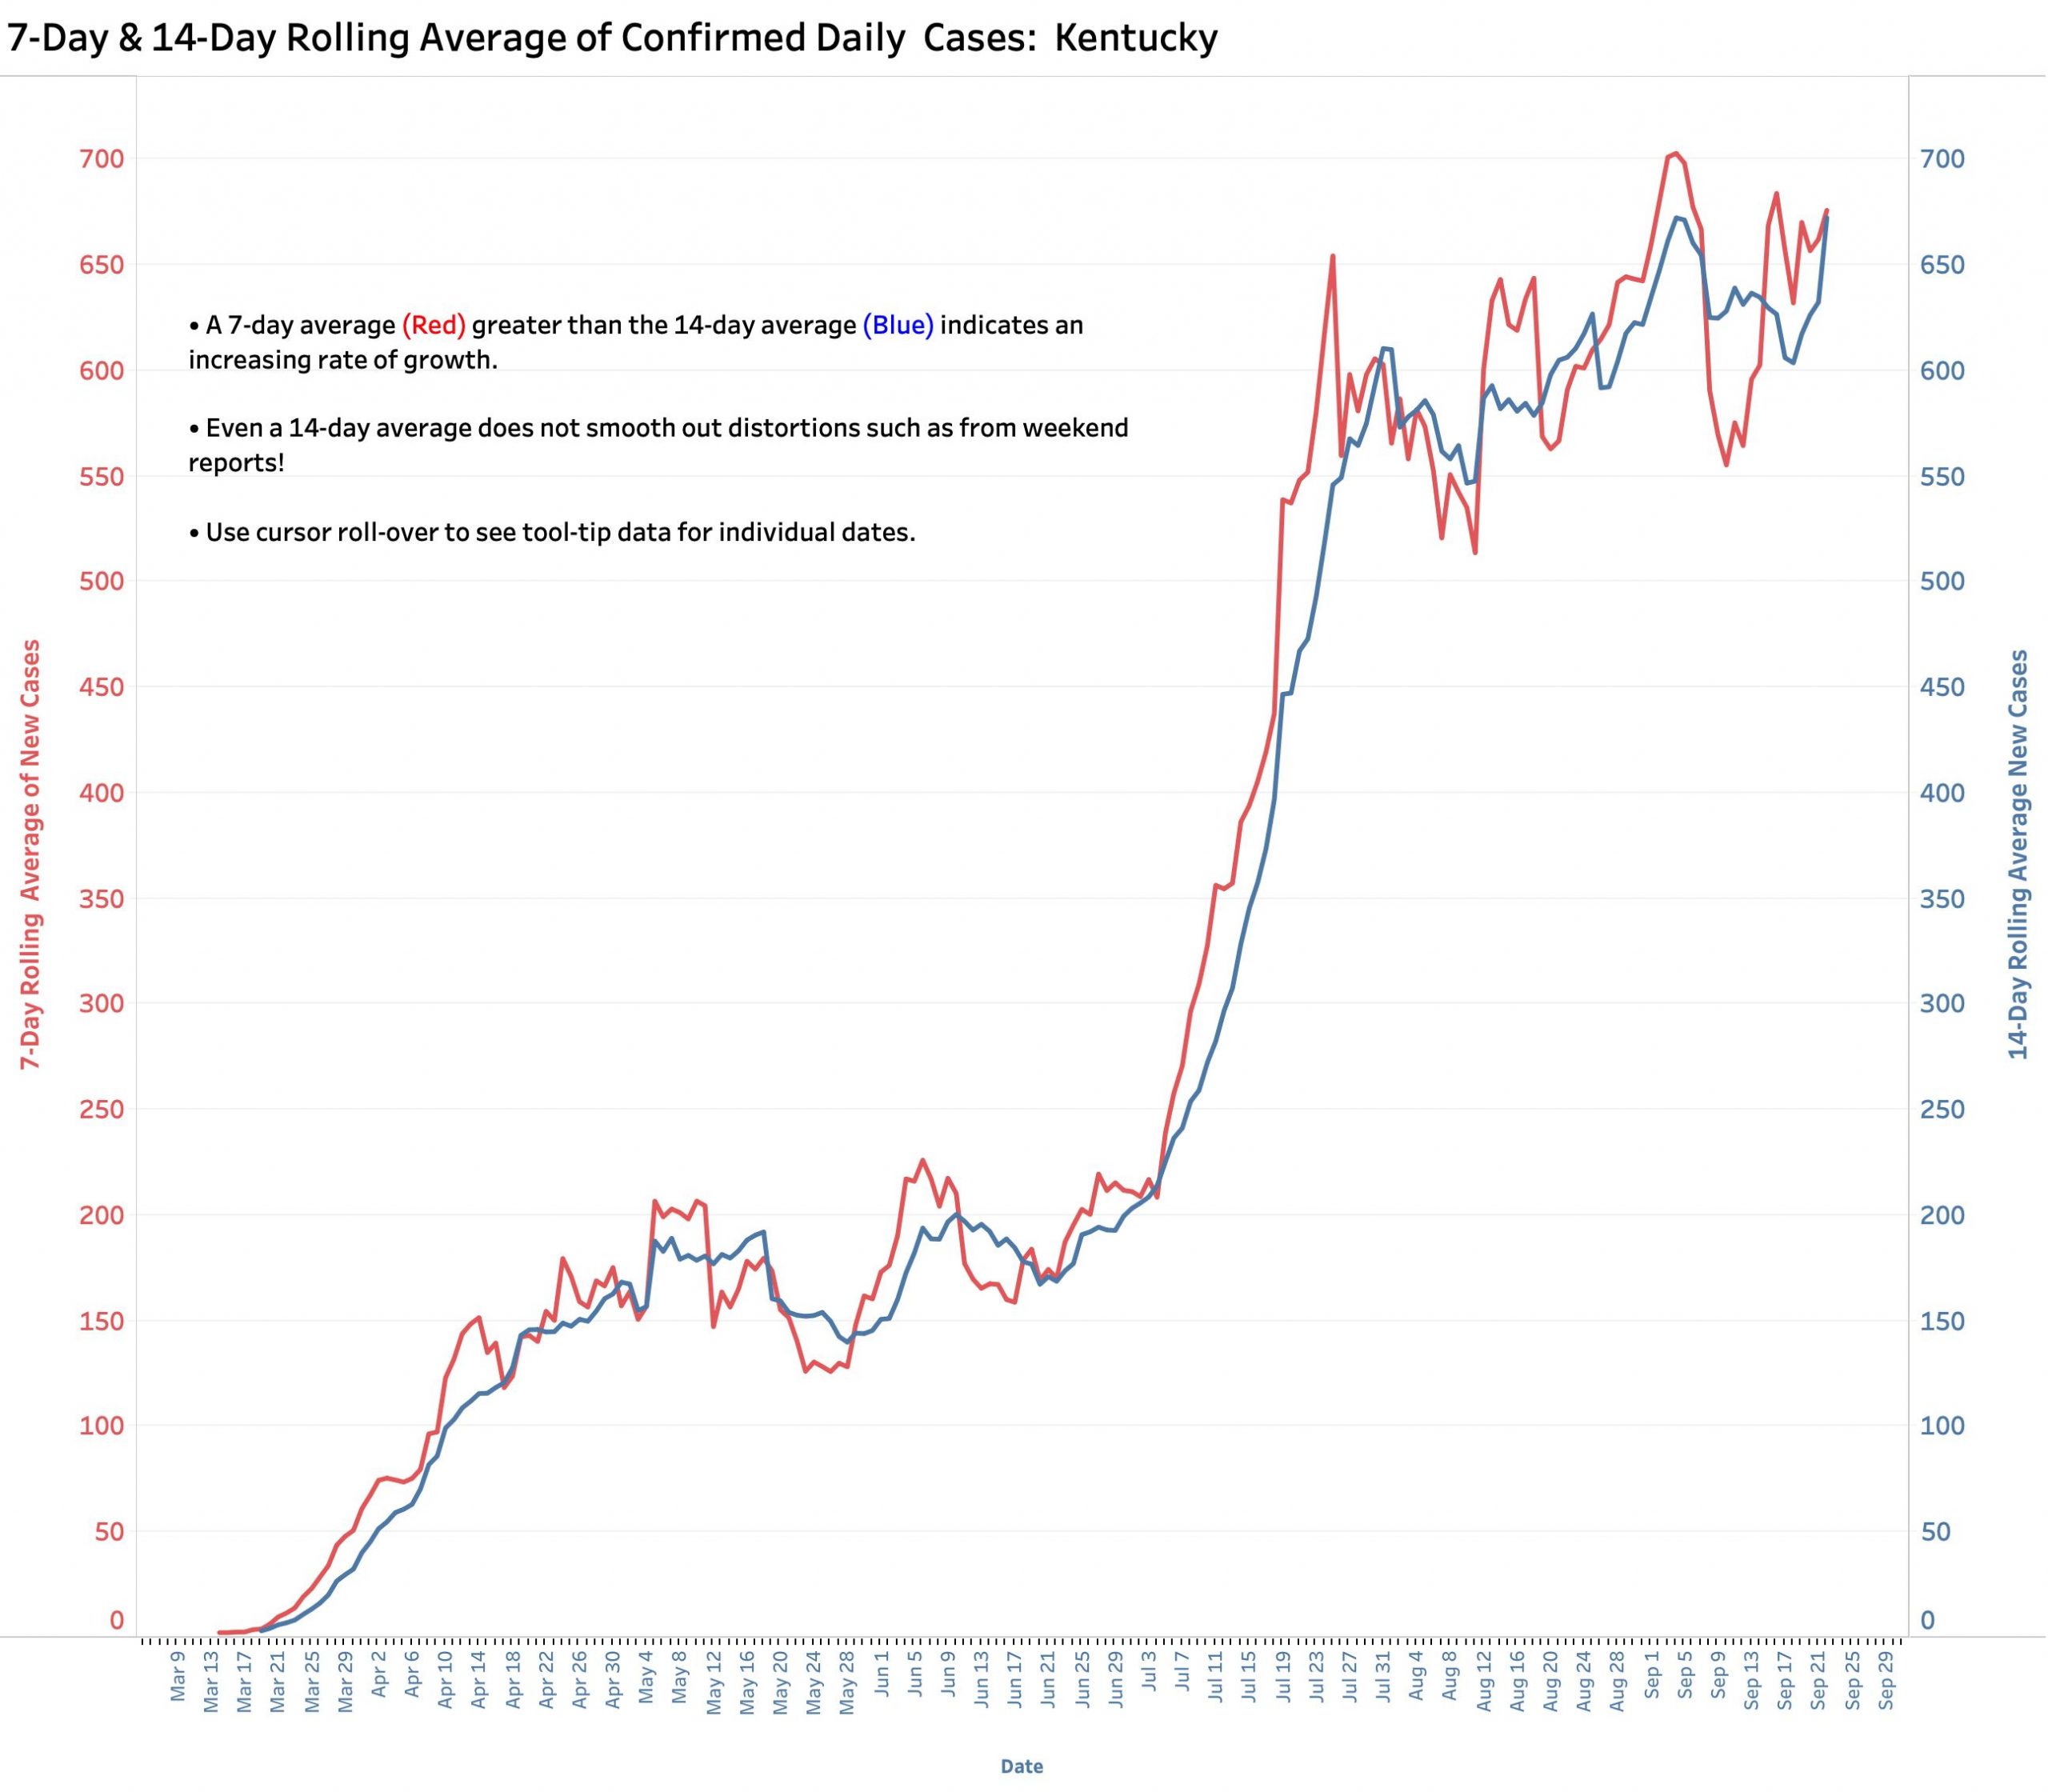
The number of new confirmed cases of Covid-19 infection during the week ending September 26, 2020 reached a new high of 4930– presumably unique– individuals. The number of new cases reported to the public continues to vary dramatically day-to-day, but so far, September has given us more days with counts exceeding 800 than all of August (7 vs. 3). The 7- and 14-day rolling averages of new daily cases continue to rise, albeit a little more slowly than since June 1. This likely reflects the success of the degree of adherence to public health measures that Kentucky Citizens have been willing or able to muster. However, with recent 7-day averages ranging between 600 and 700 cases, the aggregate number of cases adds up meaningfully. A simplified plot of Total Cases on the first day of each month since March shows an unrelenting and relatively constant accumulation of cases in which new cases in non-urban counties and in younger people make up higher relative contributions.
I have updated, standardized formats, and decreased the overall number of data visualizations in KHPI’s Tableau Public portfolio. These allow the viewer to view data details and filter the analyses to different ranges of dates.
Here are plots of daily and weekly new case counts.
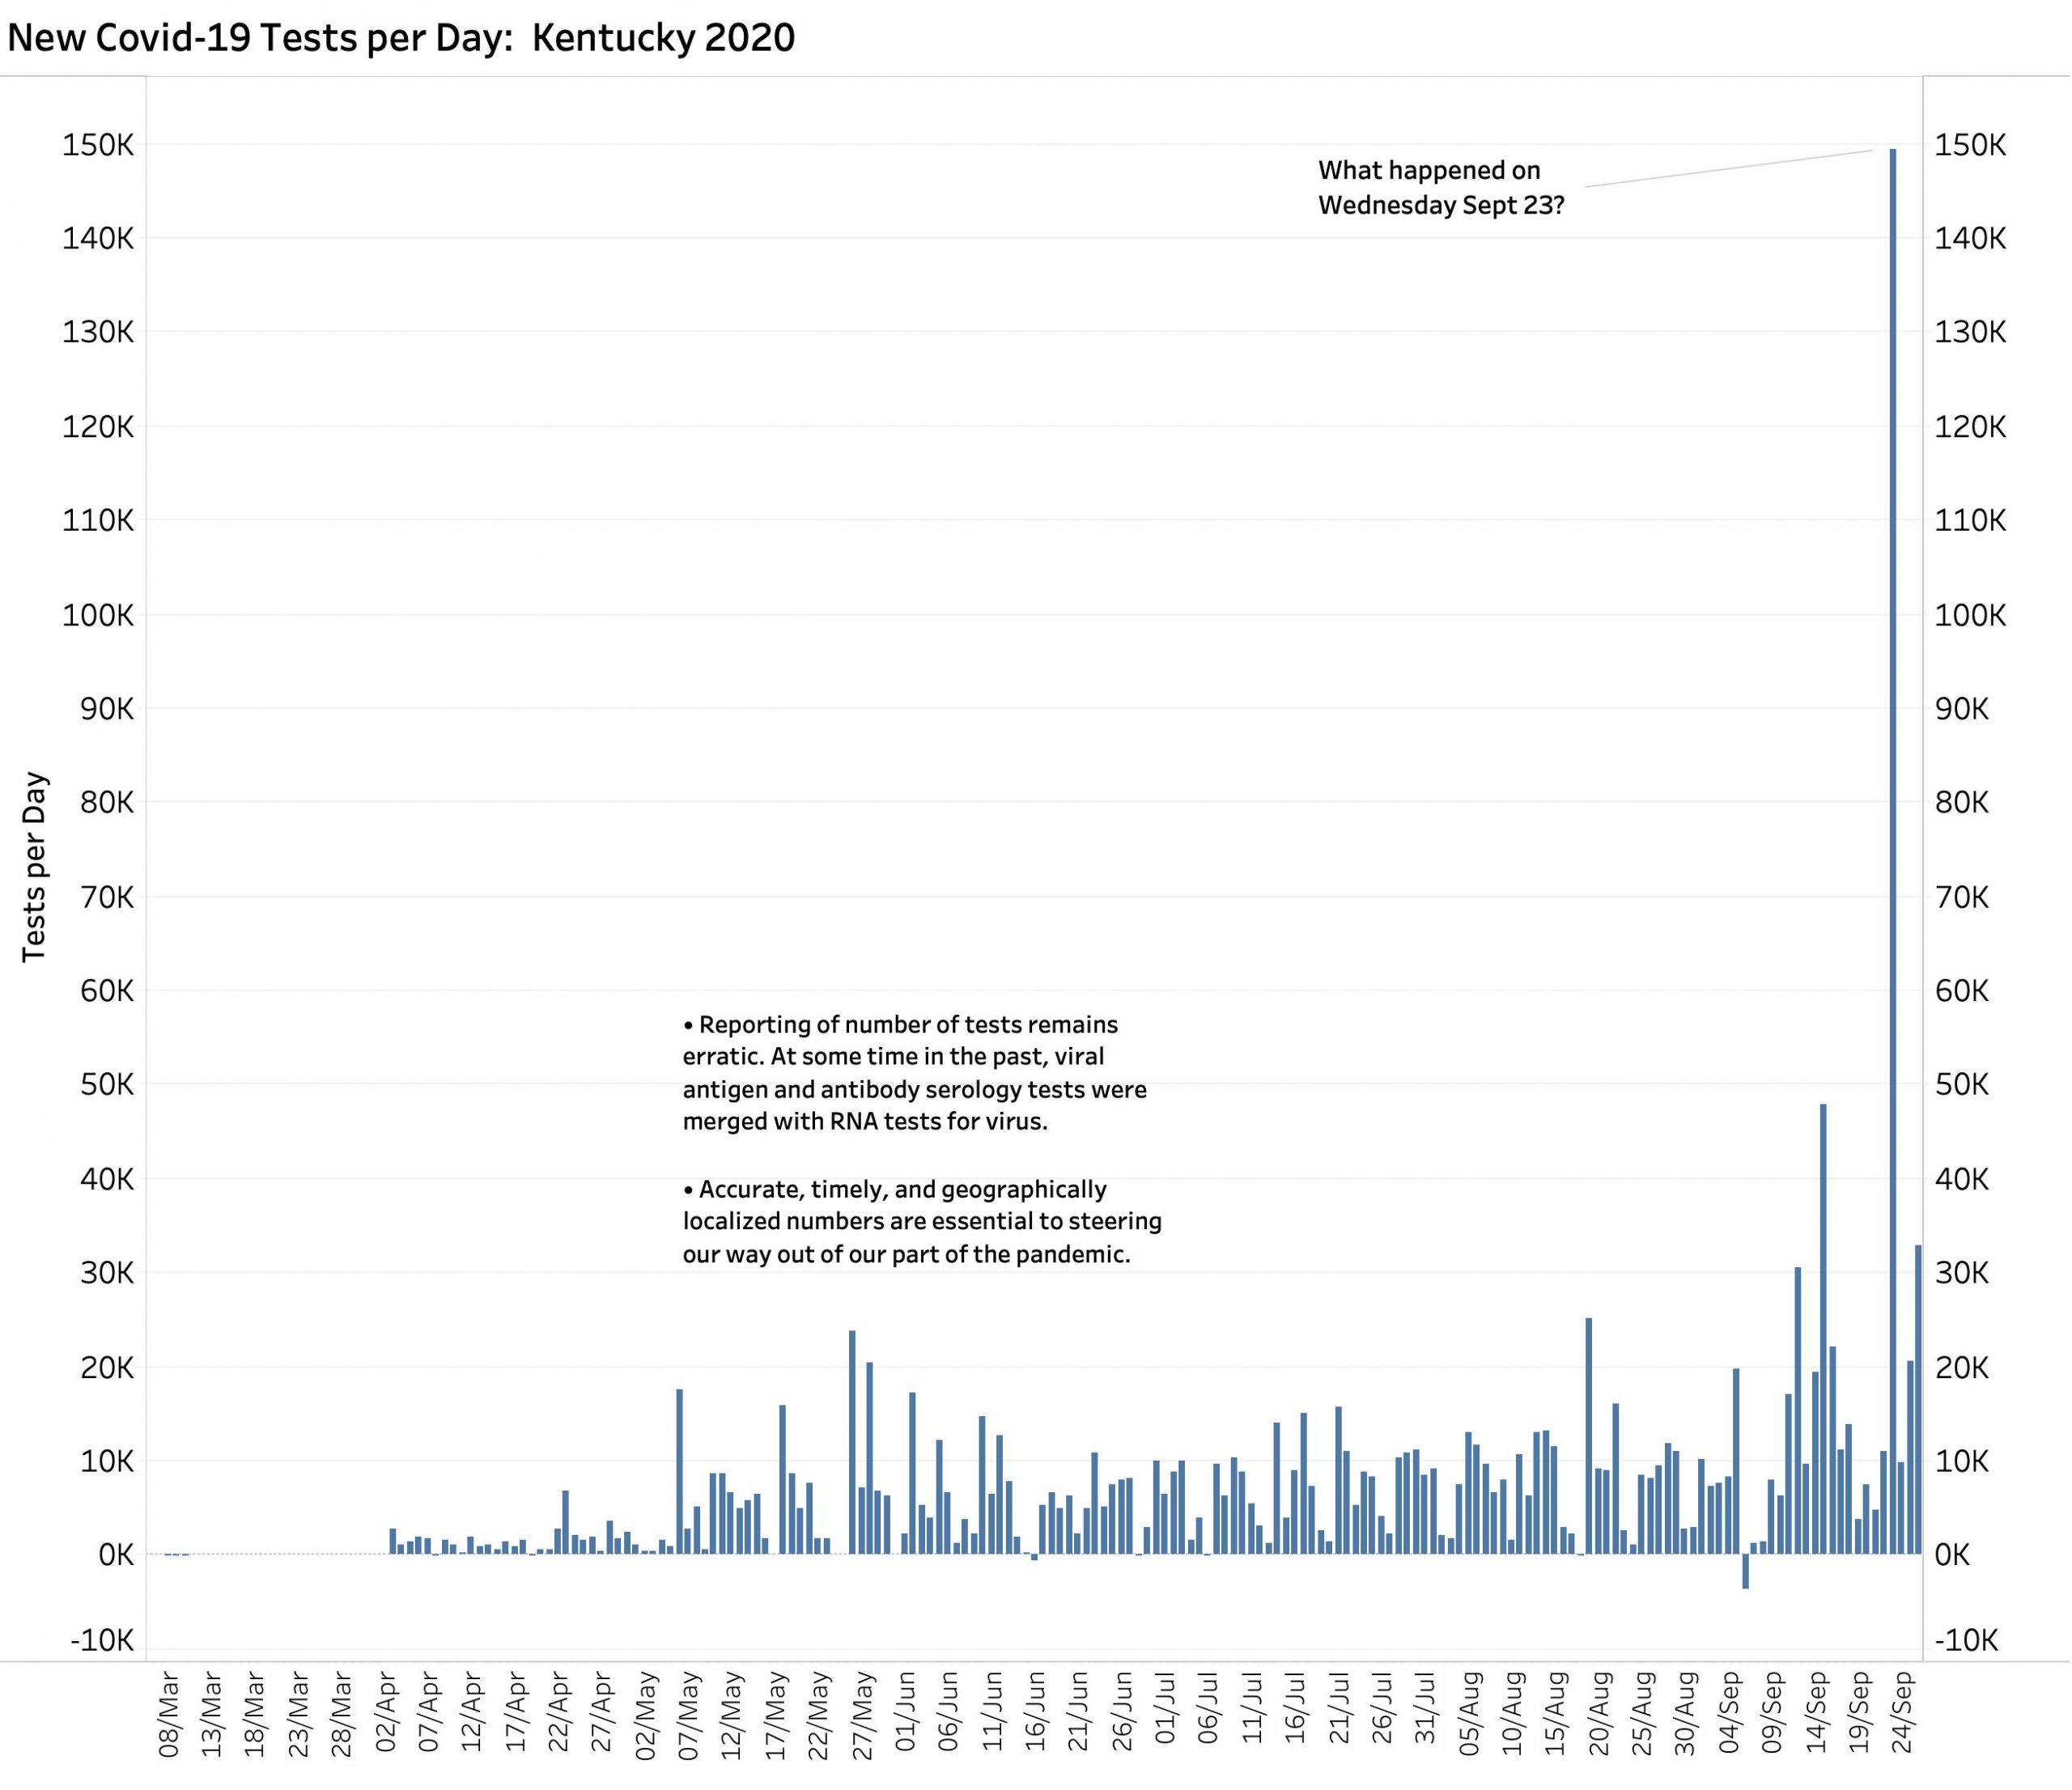
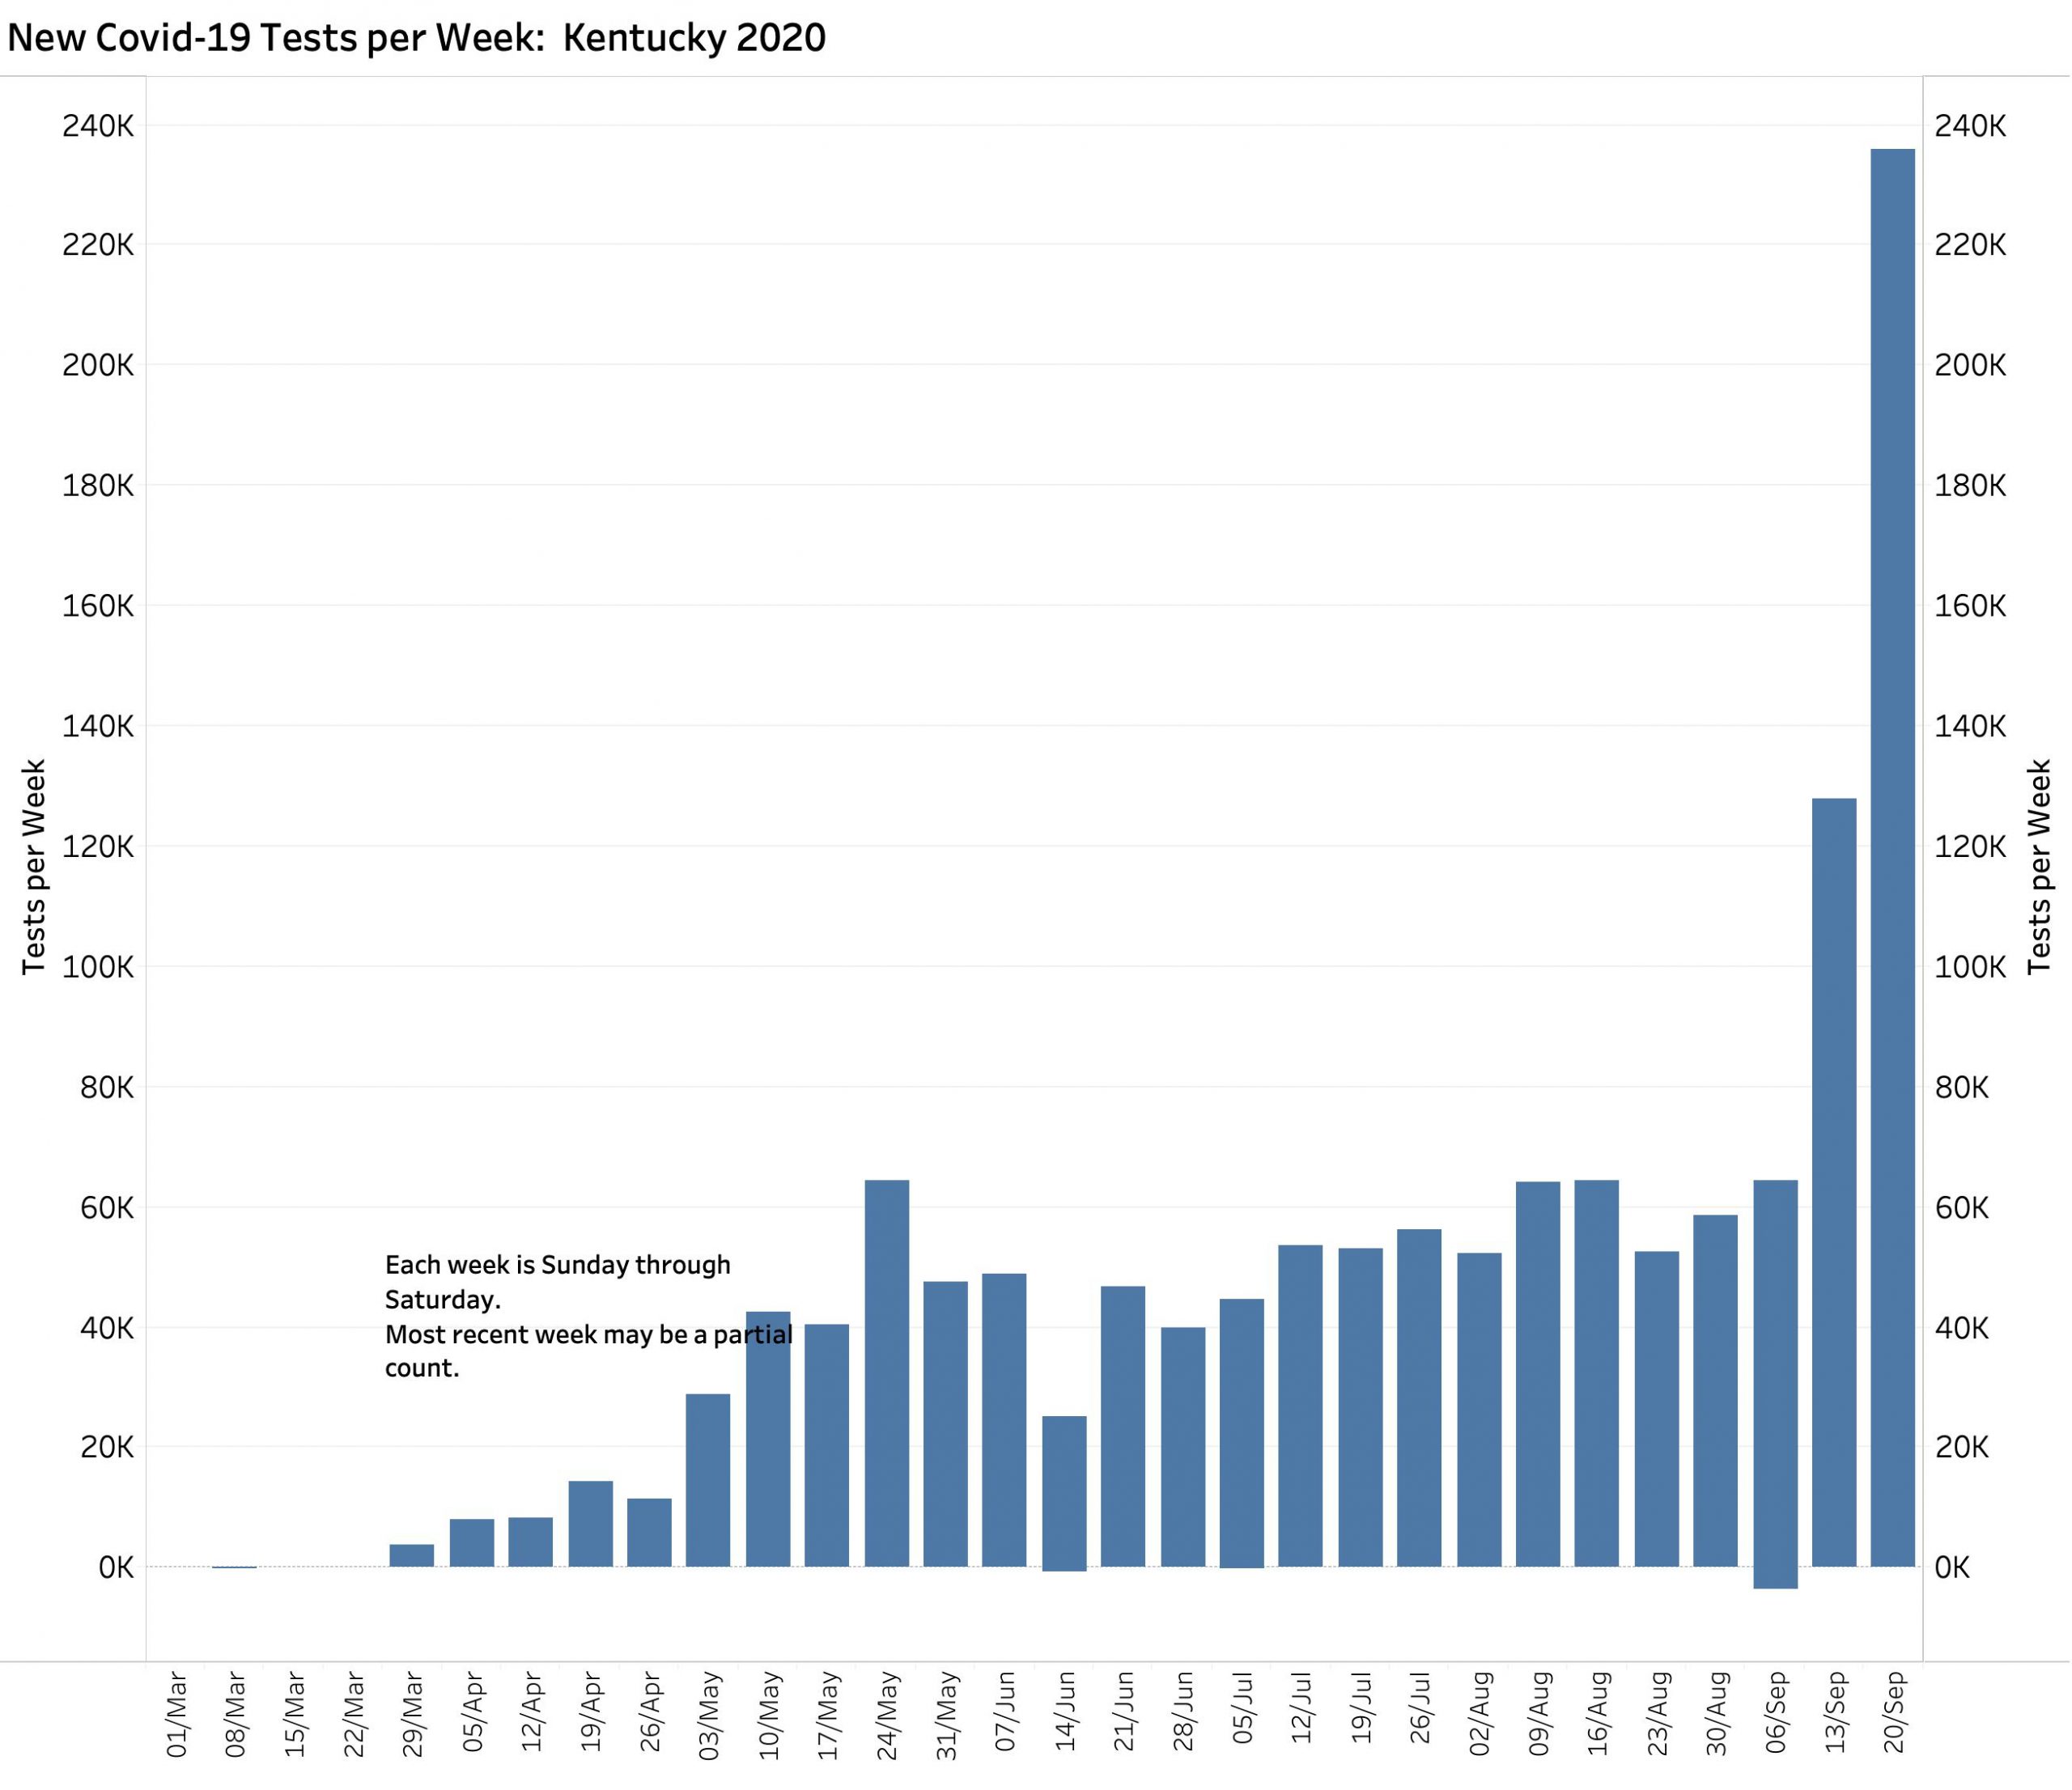
Testing.
It is not possible to fully interpret the number of new Covid-19 cases without considering how many of what kinds of diagnostic tests are being performed. It is a truism that the more tests that are performed, the more cases will be discovered and eventually reported. Of the three metrics (Cases, Deaths, and Tests) reporting of latter is the one for which the Commonwealth has the least control because tests are performed by many local and national laboratories as well as individual hospitals and doctor’s offices. Not surprisingly the number of tests reported daily by the Kentucky Department of Public Health have very large swings and have even included negative corrections that remain in the national databases. What are we to make of the 149,517 tests reported one day last week on Sept 23? Starting with a national failure to prepare and launch a program of Covid-19 testing, we should be proud in Kentucky that we have processed 1.4 million tests with recent 7-Day averages of new tests approaching 30,000 daily.
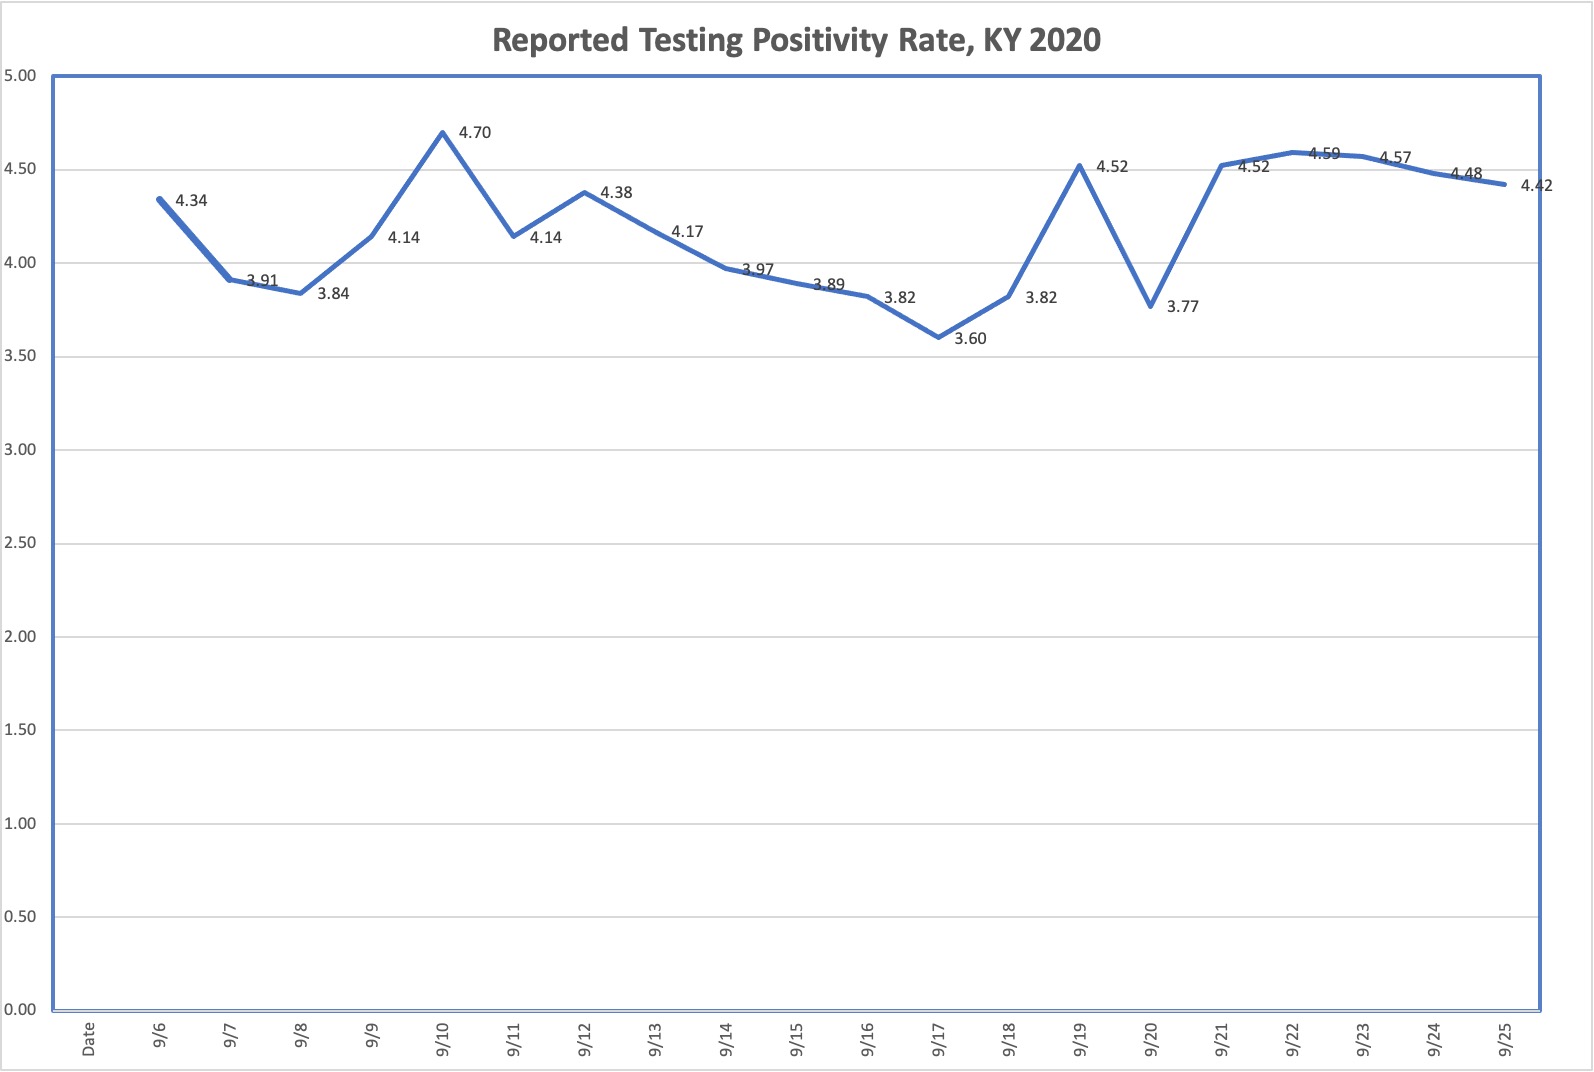
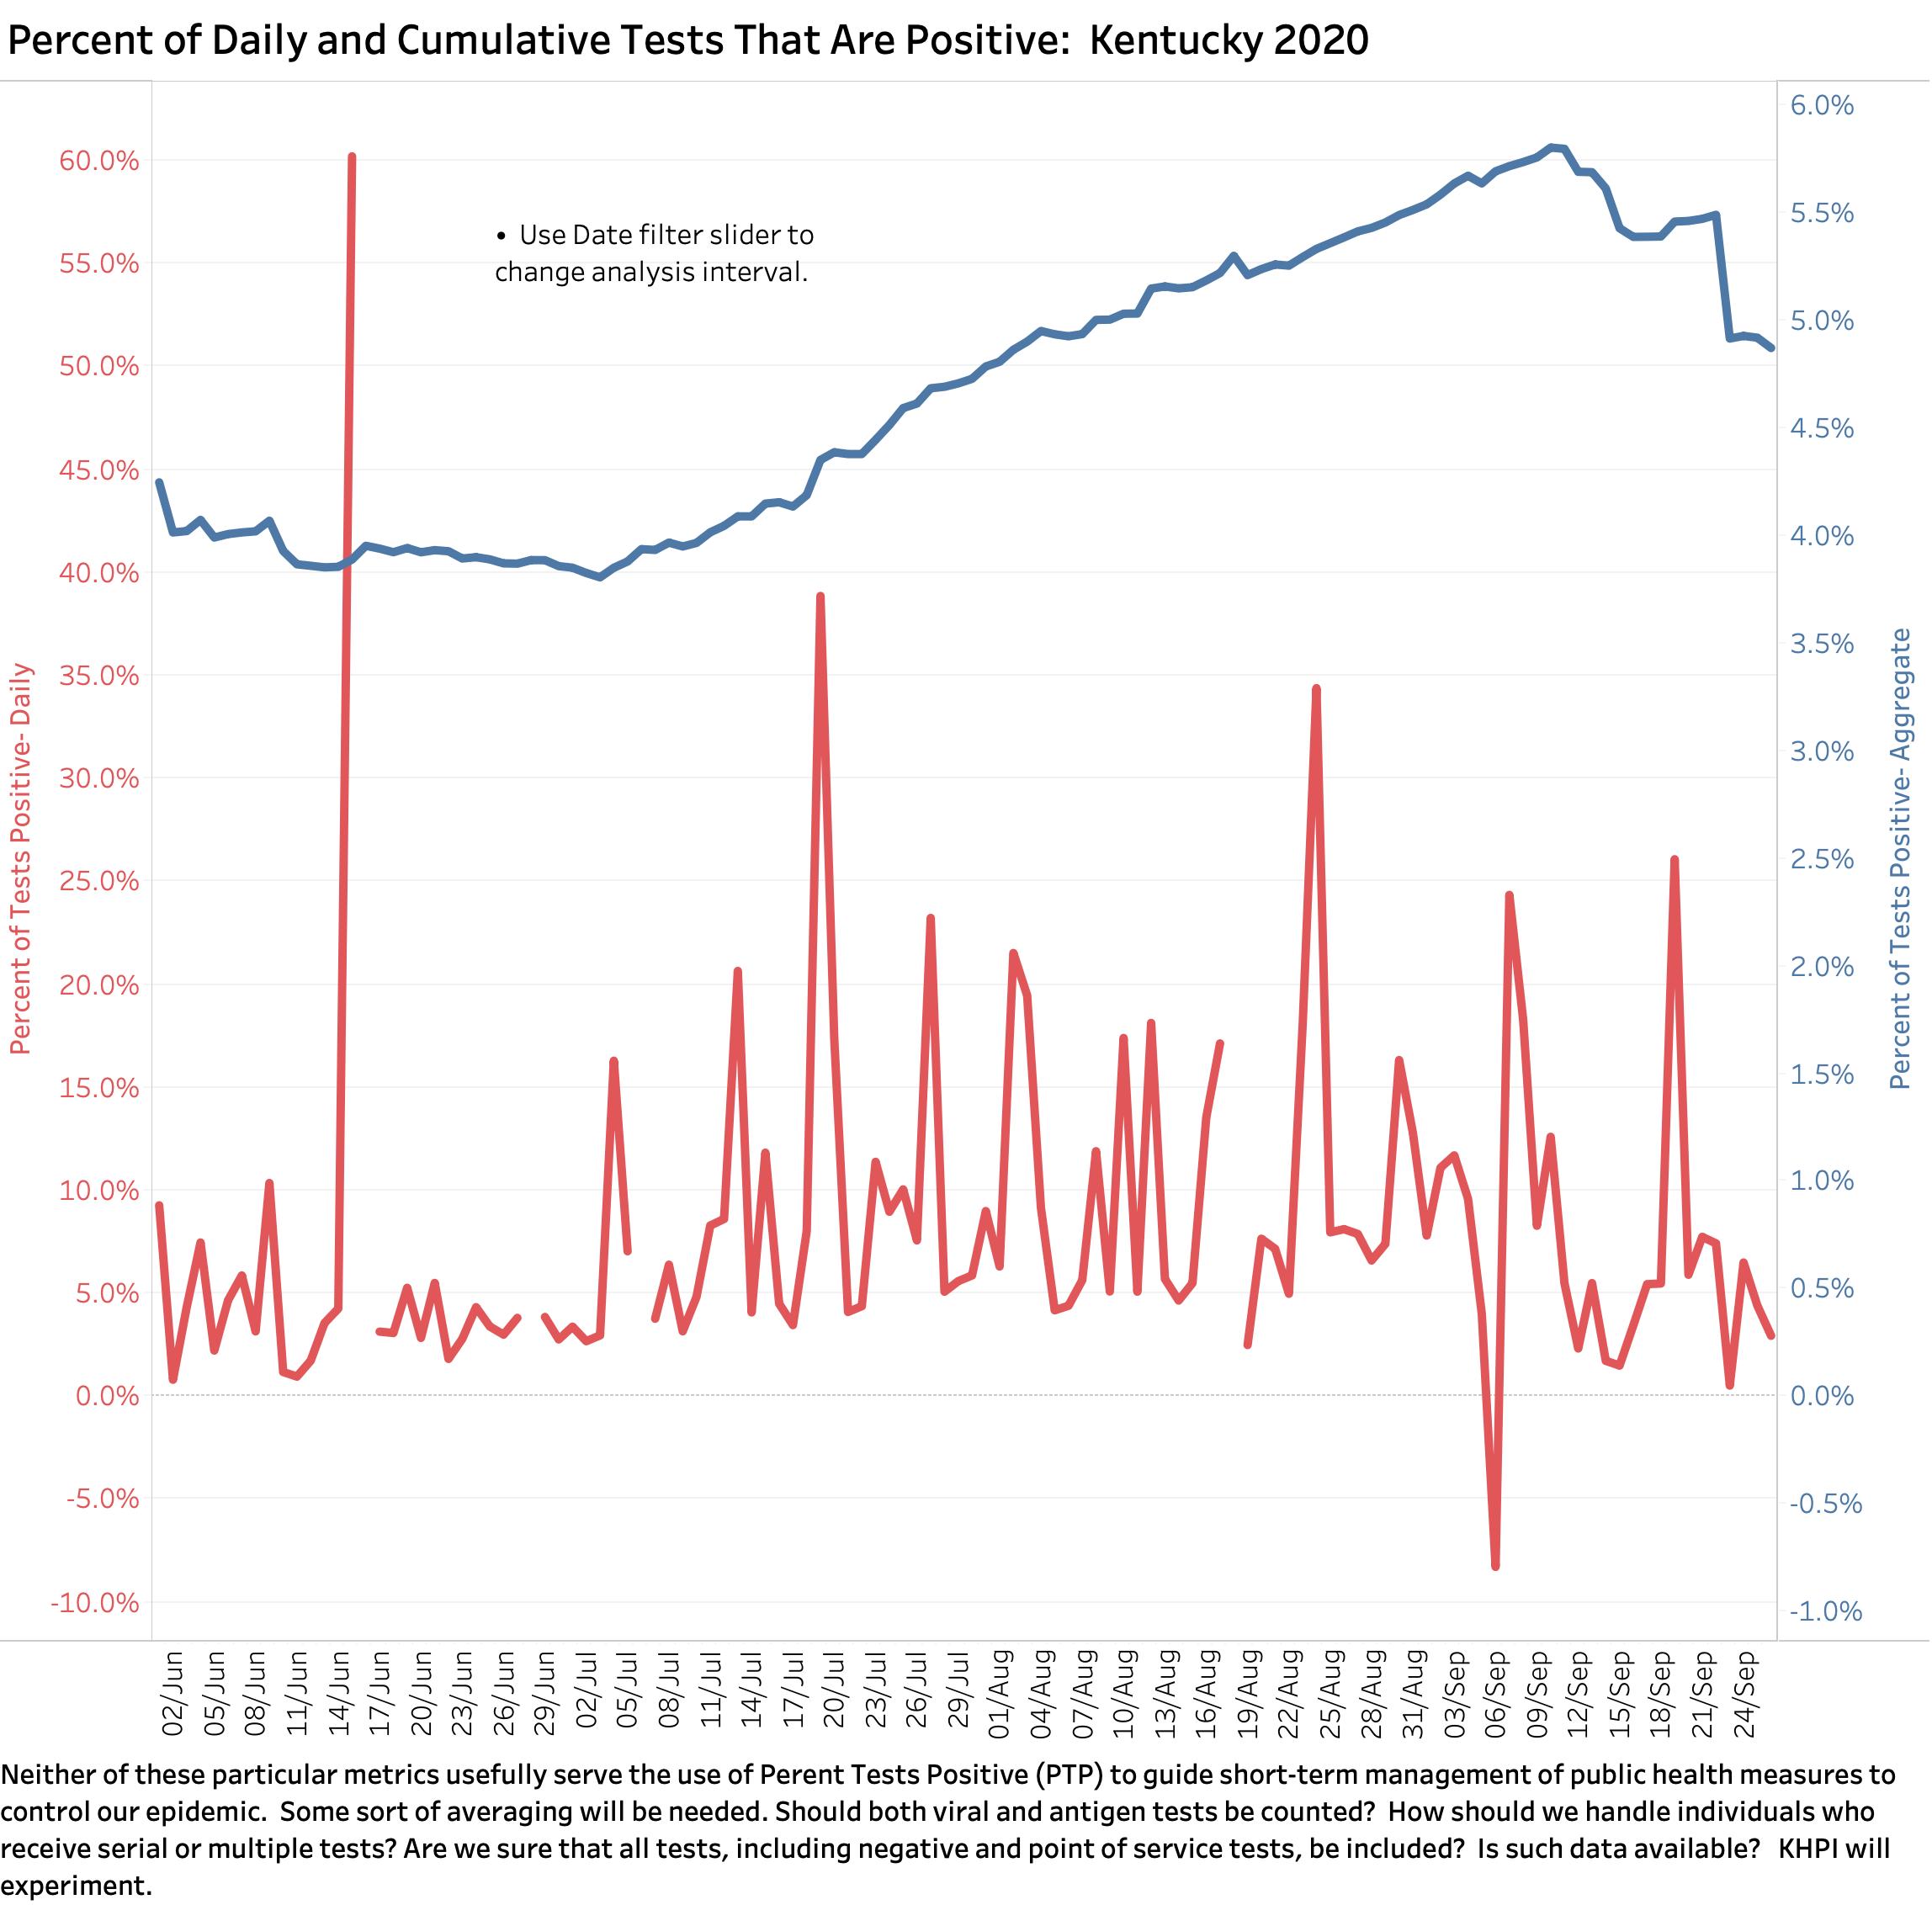
The relationship between cases and tests, be they positive tests or uniquely newly infected individuals has become central to public policy such as when to open schools or alter public health guidelines one way or the other. However, I have not been able to reproduce what Kentucky reports as “Covid-19 Testing Positivity Rate” from the numbers reported daily or on Kentucky’s Covid- 19 website regardless of whether they are averaged or not. A different set of data seems to be being used, otherwise the 150,000 test day last week would have shown up in the Positivity Rate– which it did not! My repeated requests to Ffrankfort for this information have not been responded to. Somebody help me out on this! Until how this metric is more clearly derived and from what definitions and numbers, I am inclined to rely more on the raw numbers and locations of new cases and deaths and must make that recommendation to others.
Percent of Tests reported by Frankfort as “Testing Positivity Rate.”
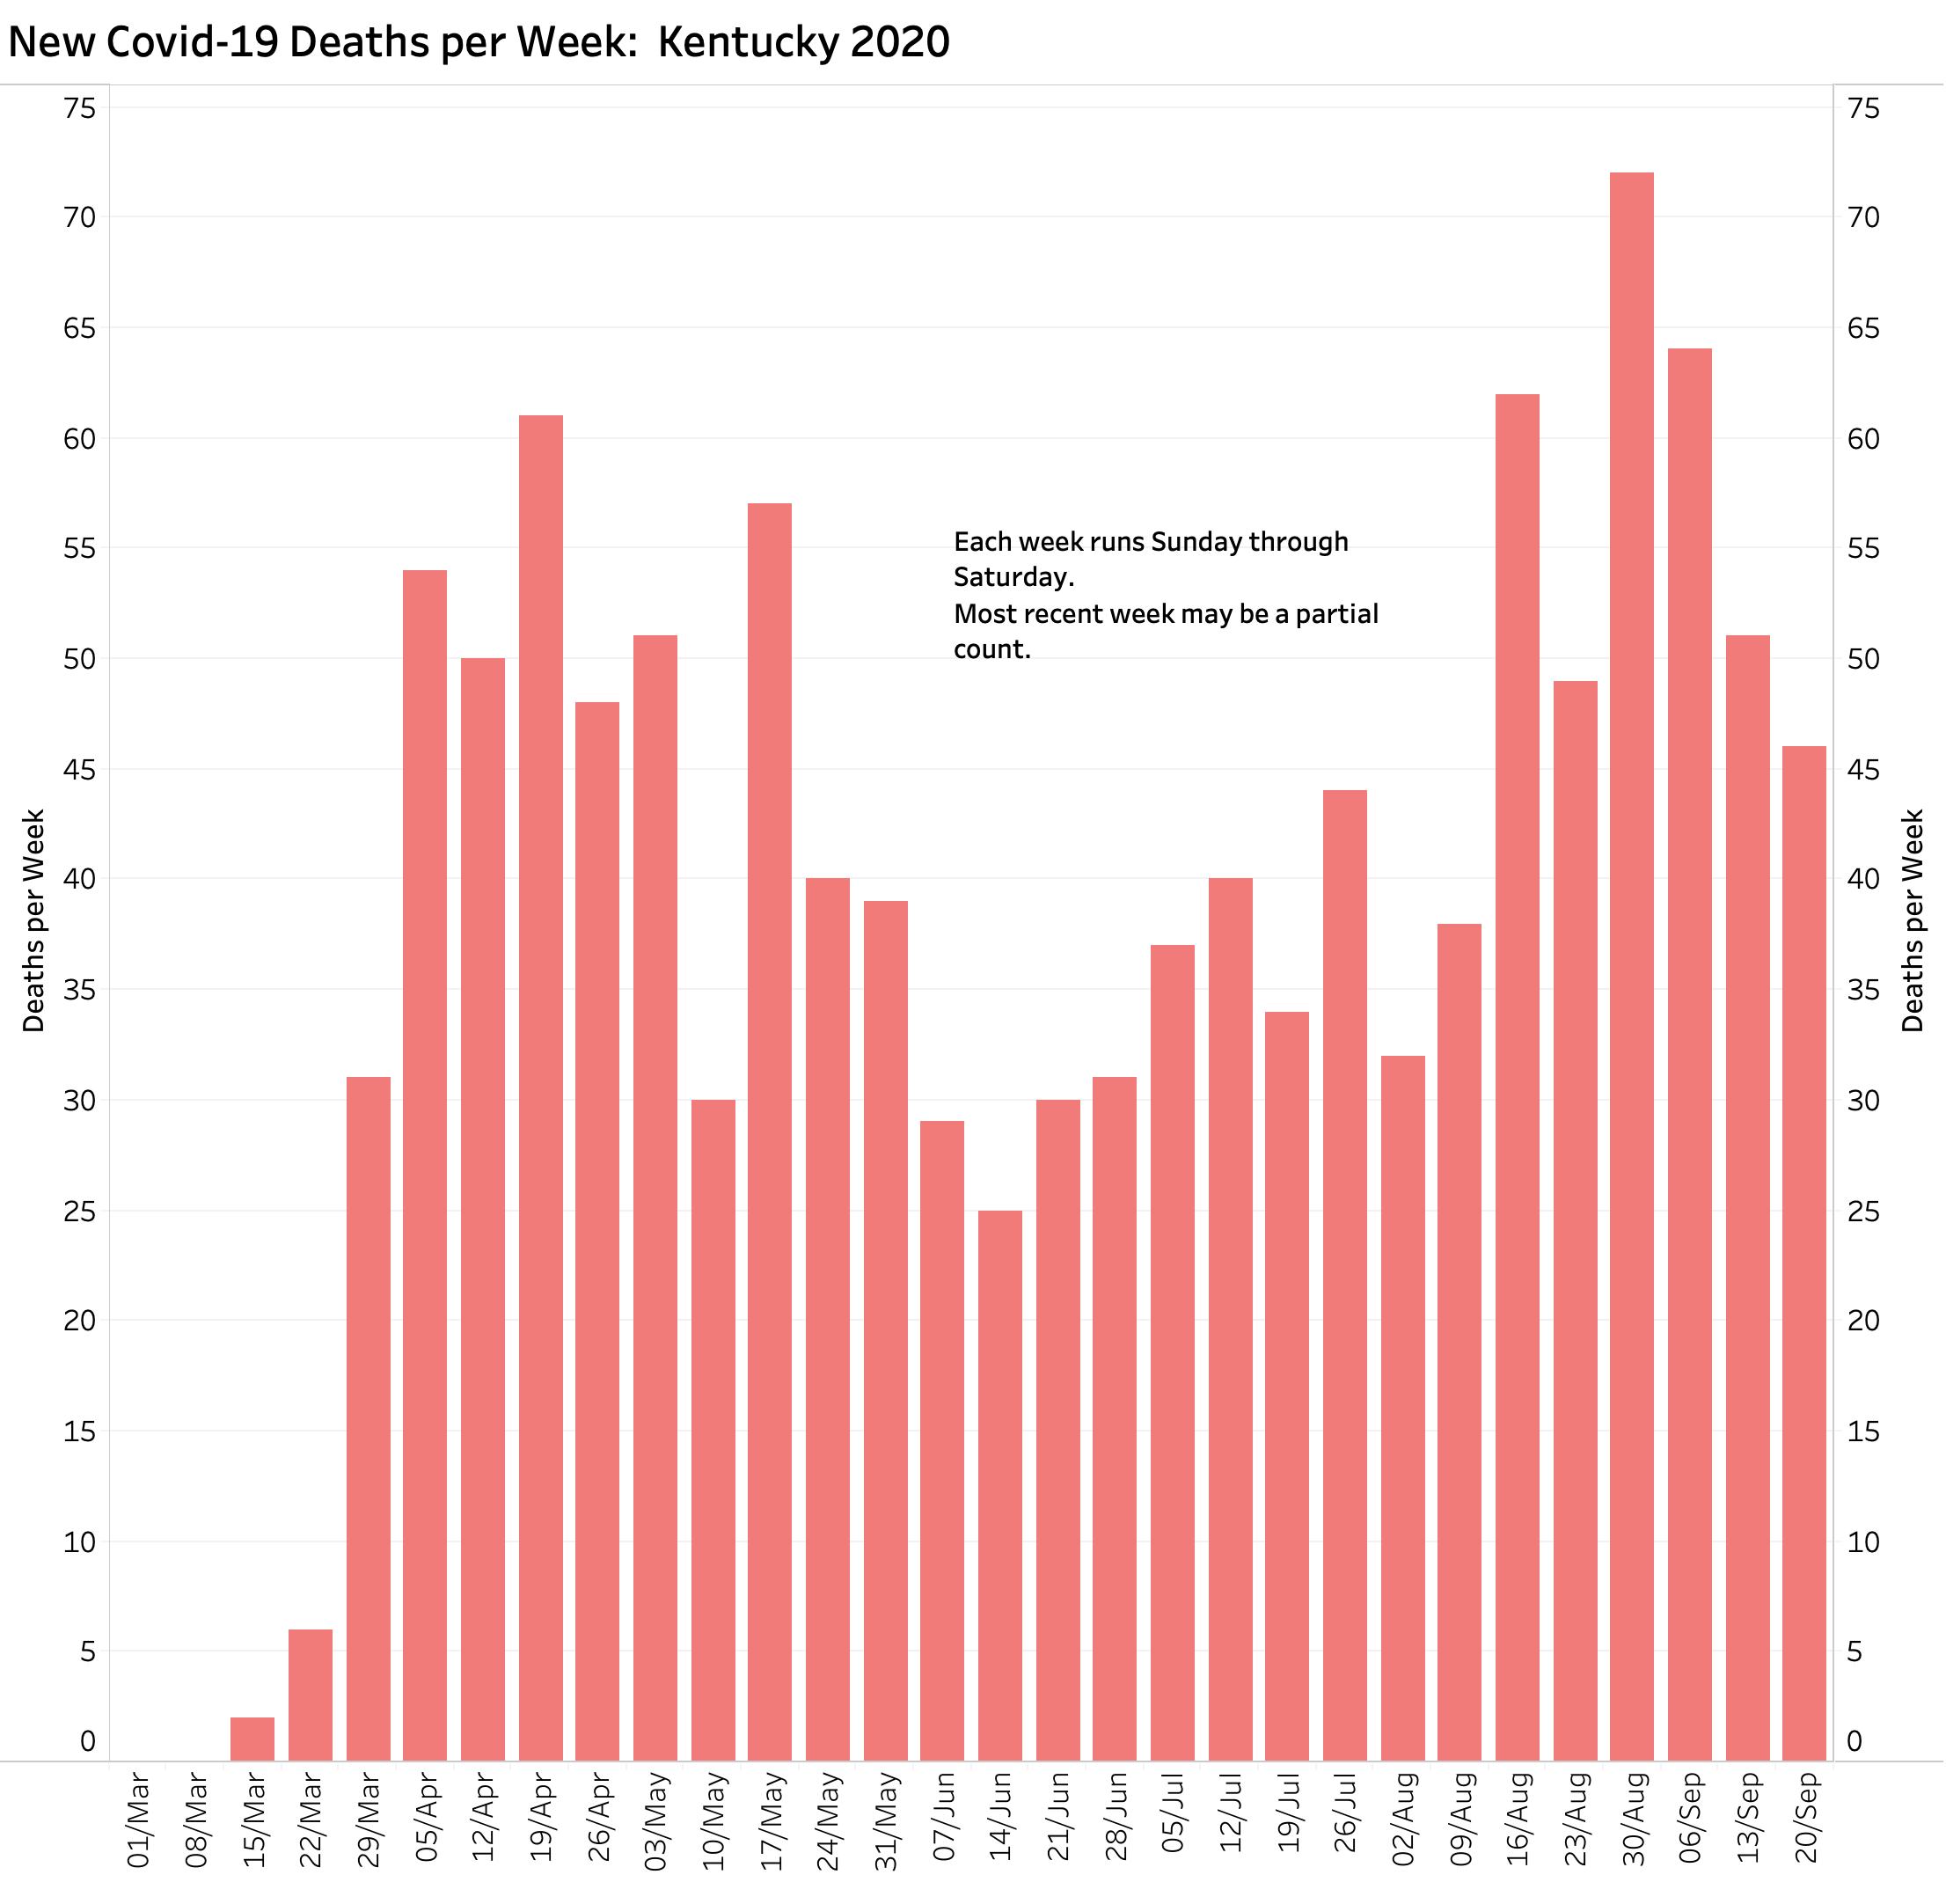
Deaths.
Weekly deaths have been falling. This was a pleasant surprise for me as comments from Frankfort referred to a backlog of deaths that were still being confirmed. The decrease in reported deaths in a time of increasing cases, if accurate, is likely attributable to several factors. These include that more testing will find more cases including individuals with asymptomatic or less severe disease who are much less likely to die. More younger individuals with Covid-19 infection are being identified but who are less likely to have the more acute and severe forms of the disease. Because serology tests (including antibodies) are now included in the Total Number of Tests, we are counting individuals who were infected at sometime in the past but who survived. Not the least relevant is the fact that with increasing clinical experience, medical management is able to effectively treat even very sick people. This includes the use of drugs like steroids for patients on ventilators, and being more careful about who needs to be on ventilators in the first place when things like simple positioning in bed make noticeable differences in survival. These counts of death do not include “excess deaths” from individuals without Covid-infection who die earlier because of disruptions in “usual” healthcare systems.
Who is actually dying of Covid-19 disease.
An issue that has become controversial nationally is what constitutes a coronavirus death? Does someone with bad preexisting heart or lung disease who just so happened to also have Covid-19 infection count as a Covid-death or not? In my view, and for the time being anyway, any sick person who dies within a relatively short number of weeks from acquiring Covid-19 infection should count as a Covid-19 death. We are learning more daily about the systemic nature of Covid-19 infection including its effects on the heart, lungs, kidneys, brain, and vascular system in general. I predict we are going to learn a lot more about how Covid-19 kills or damages its victims and how long its morbidity persists in its survivors. It is already fair to say Covid-19 is a bad actor.
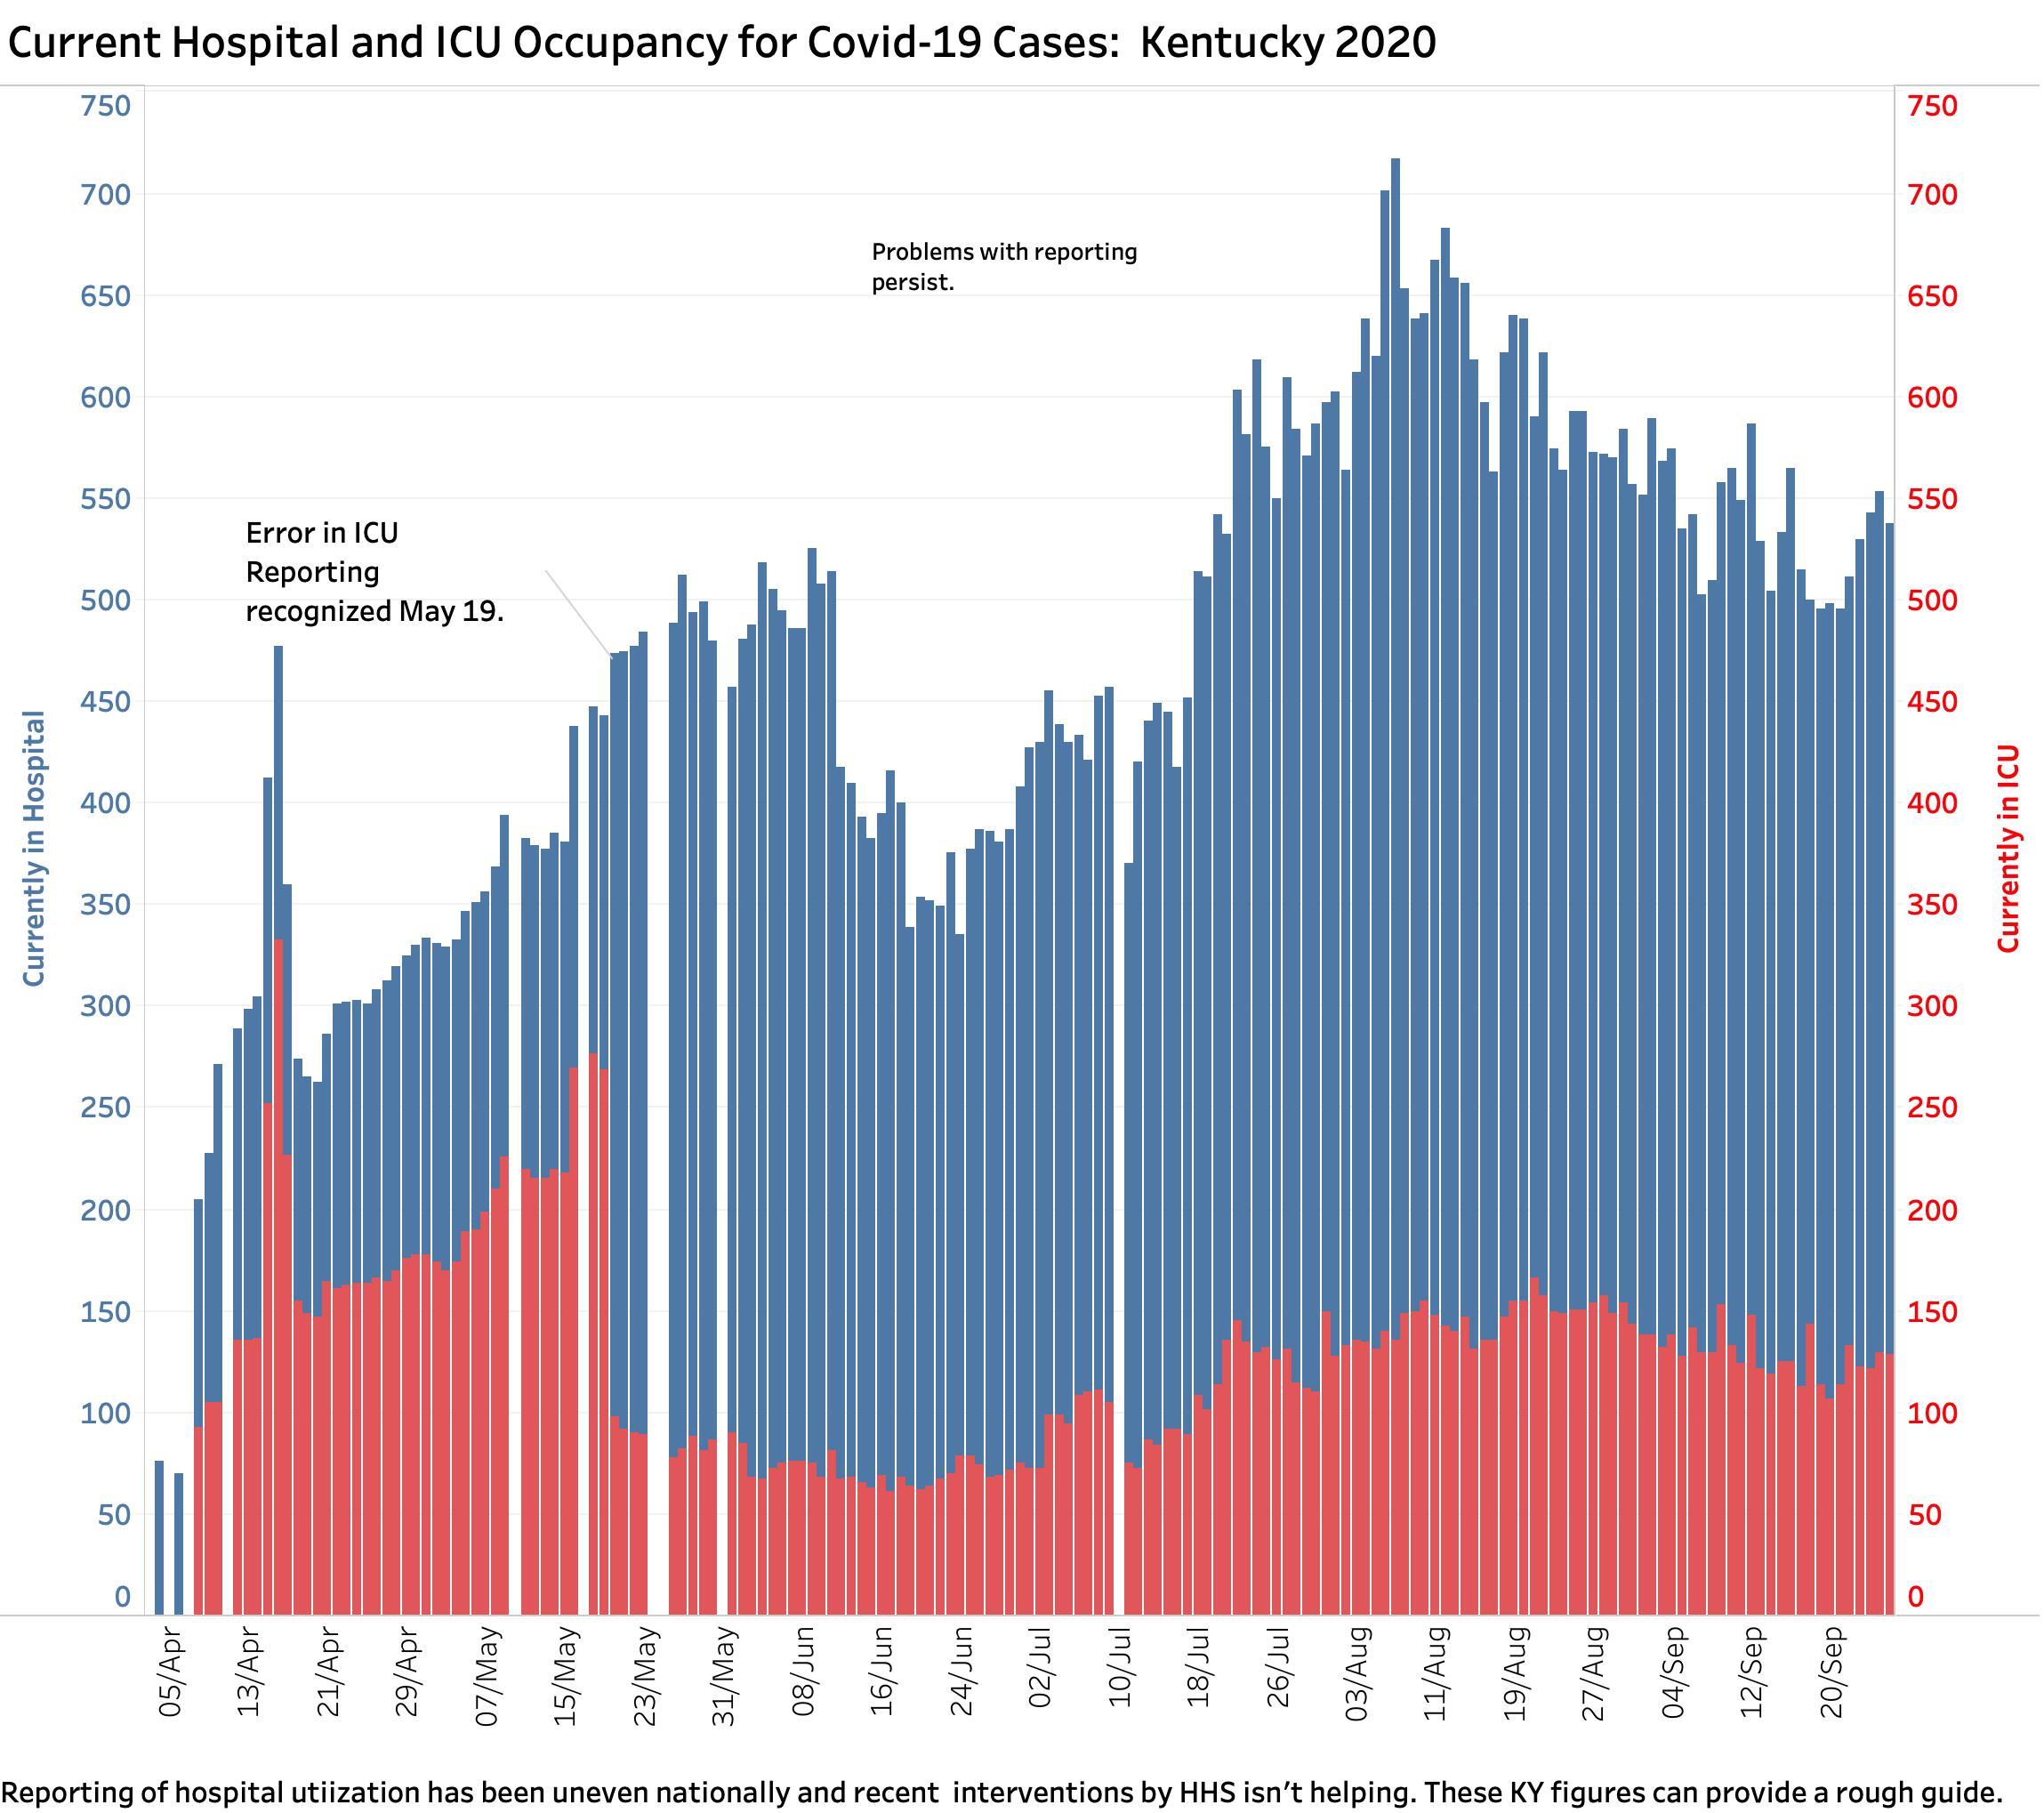
Hospital Utilization.
I am not prepared to say much about what is happening in hospitals. Certainly some hospitals are feeling intense capacity pressure more than others. If the hospital numbers are comparable, we are busier this last two months than we were in May and June. Hospitals nationally are vocal about the difficulties in reporting utilization in an accurate and timely way. This is to be predicted in our fragmented healthcare system.
Enough for now.
It is clear that our struggles to contain the spread and impact of our share of the Covid-19 pandemic are not over or even easier. Here and elsewhere in the country, counties are where the new virus action is. I would like think that in less populated counties that identification and contact tracking as well as the ability to intervene might be easier than in big cities. We shall see. Our combined efforts are made more complex and difficult as we seek to open schools, businesses, sporting events and the like; as we face large public protests; all in the the context of Coronavirus and political fatigue. I do not see us getting much better fast. I would still like to be wrong.
Peter Hasselbacher, MD
Board Certification in Diagnostic Laboratory Immunology
Emeritus Professor Medicine, UofL
28 September 2020
I have updated the individual county data for Kentucky cases and deaths and will place a link here later.