
A blip, or an accelerated new trend?
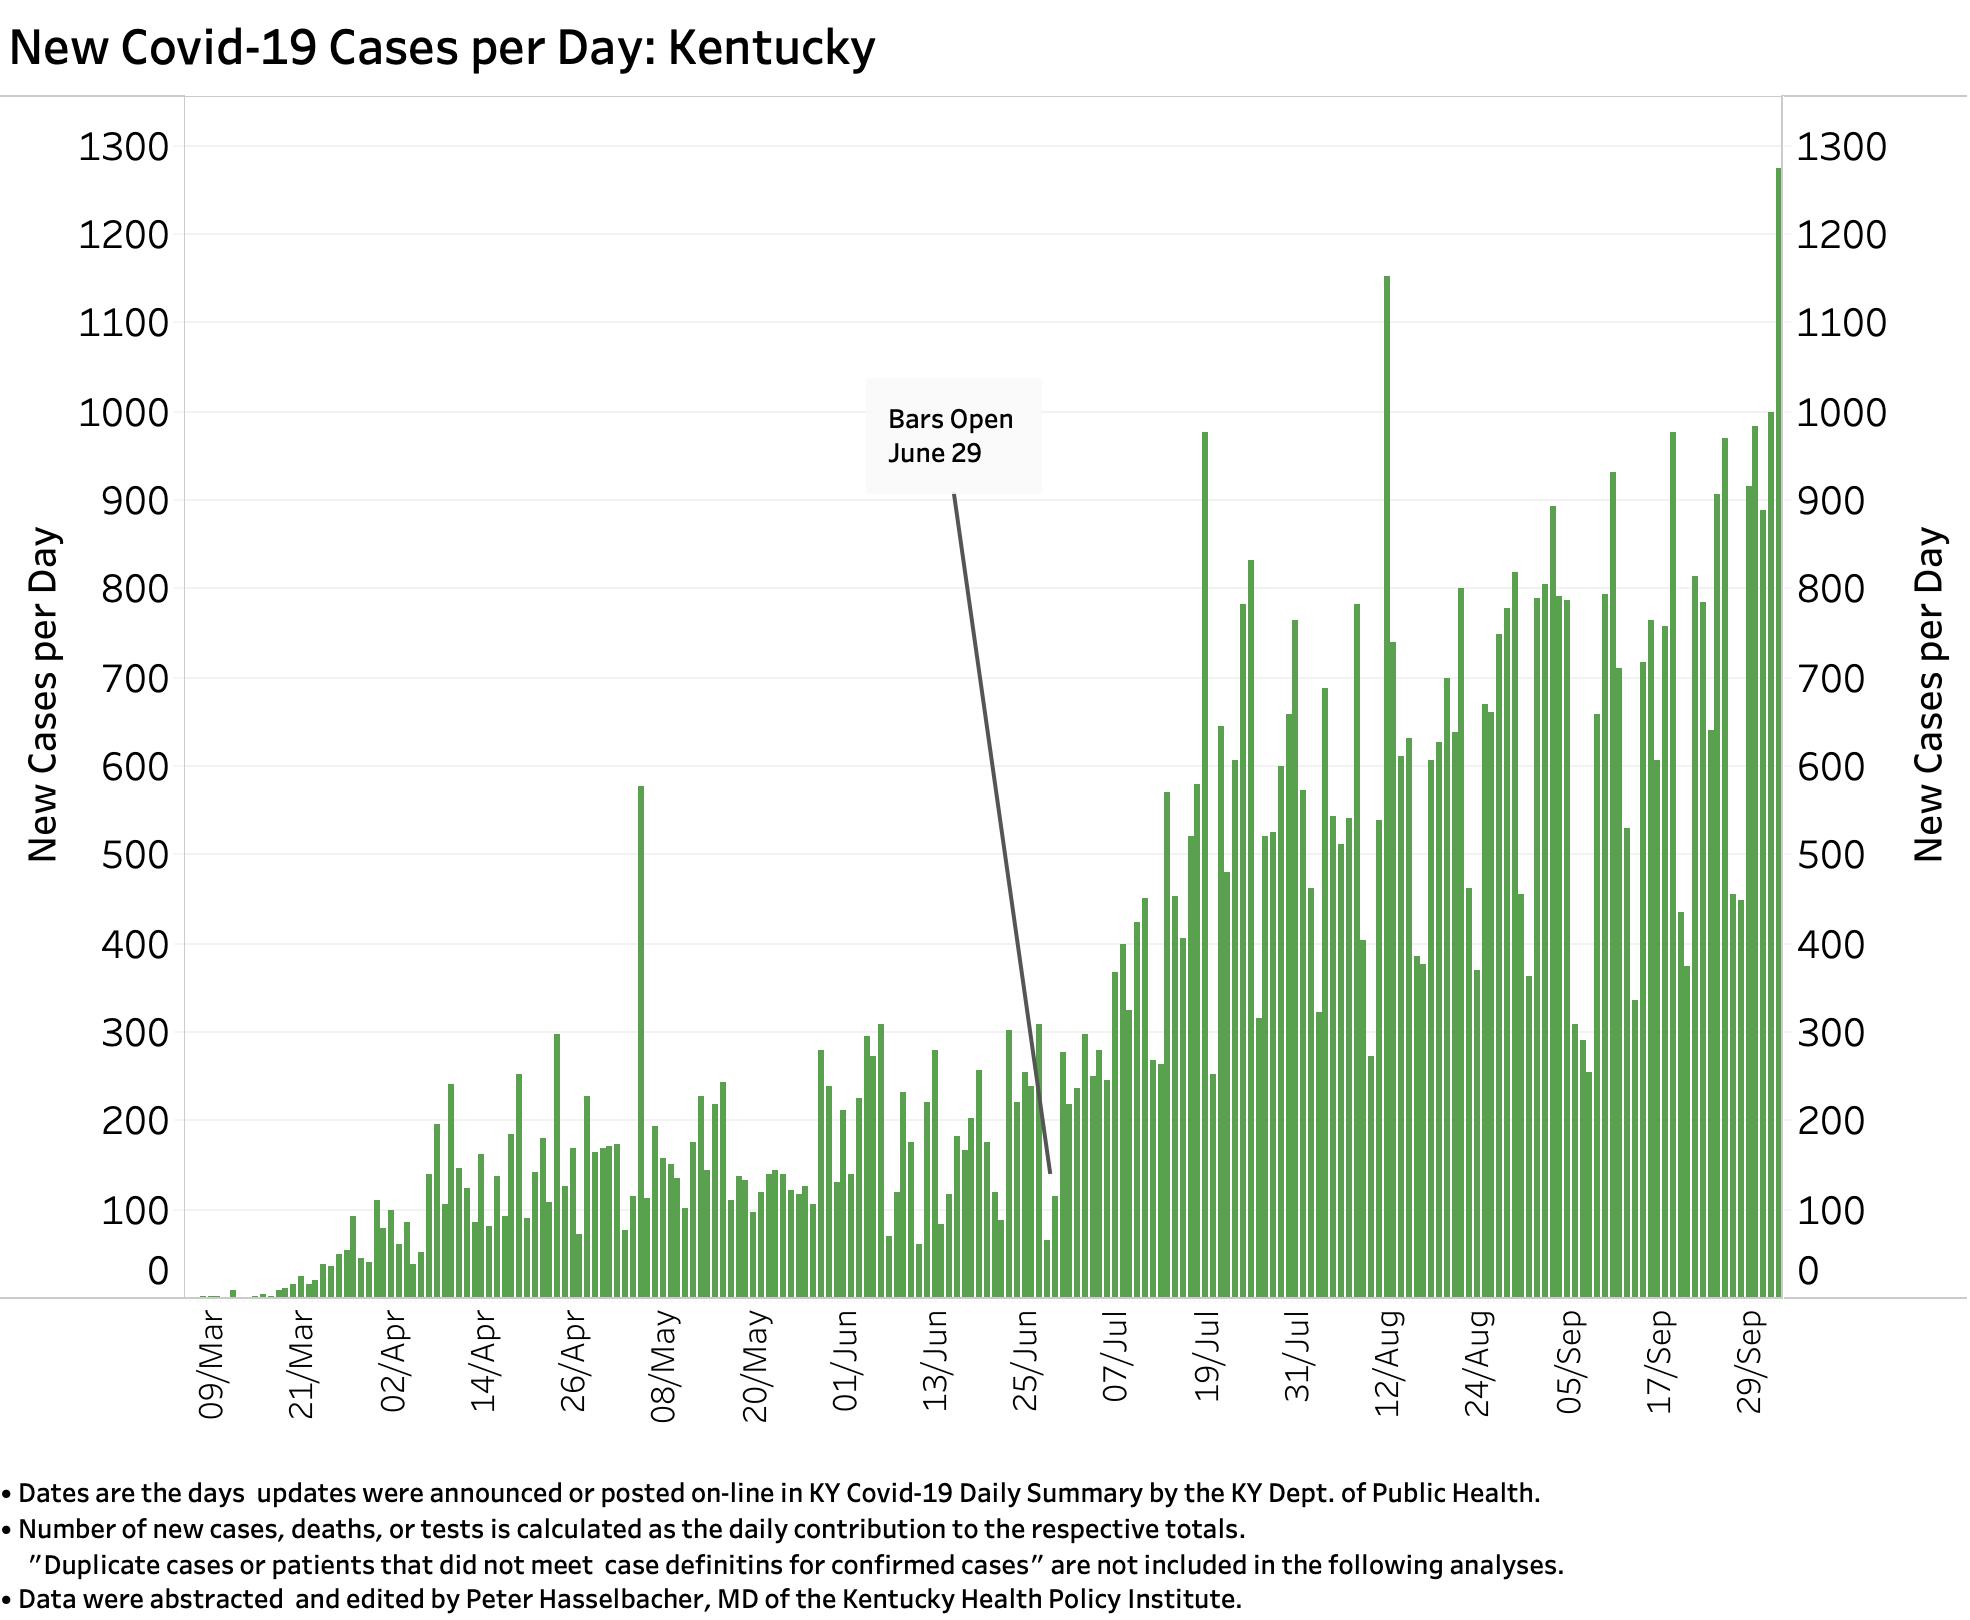
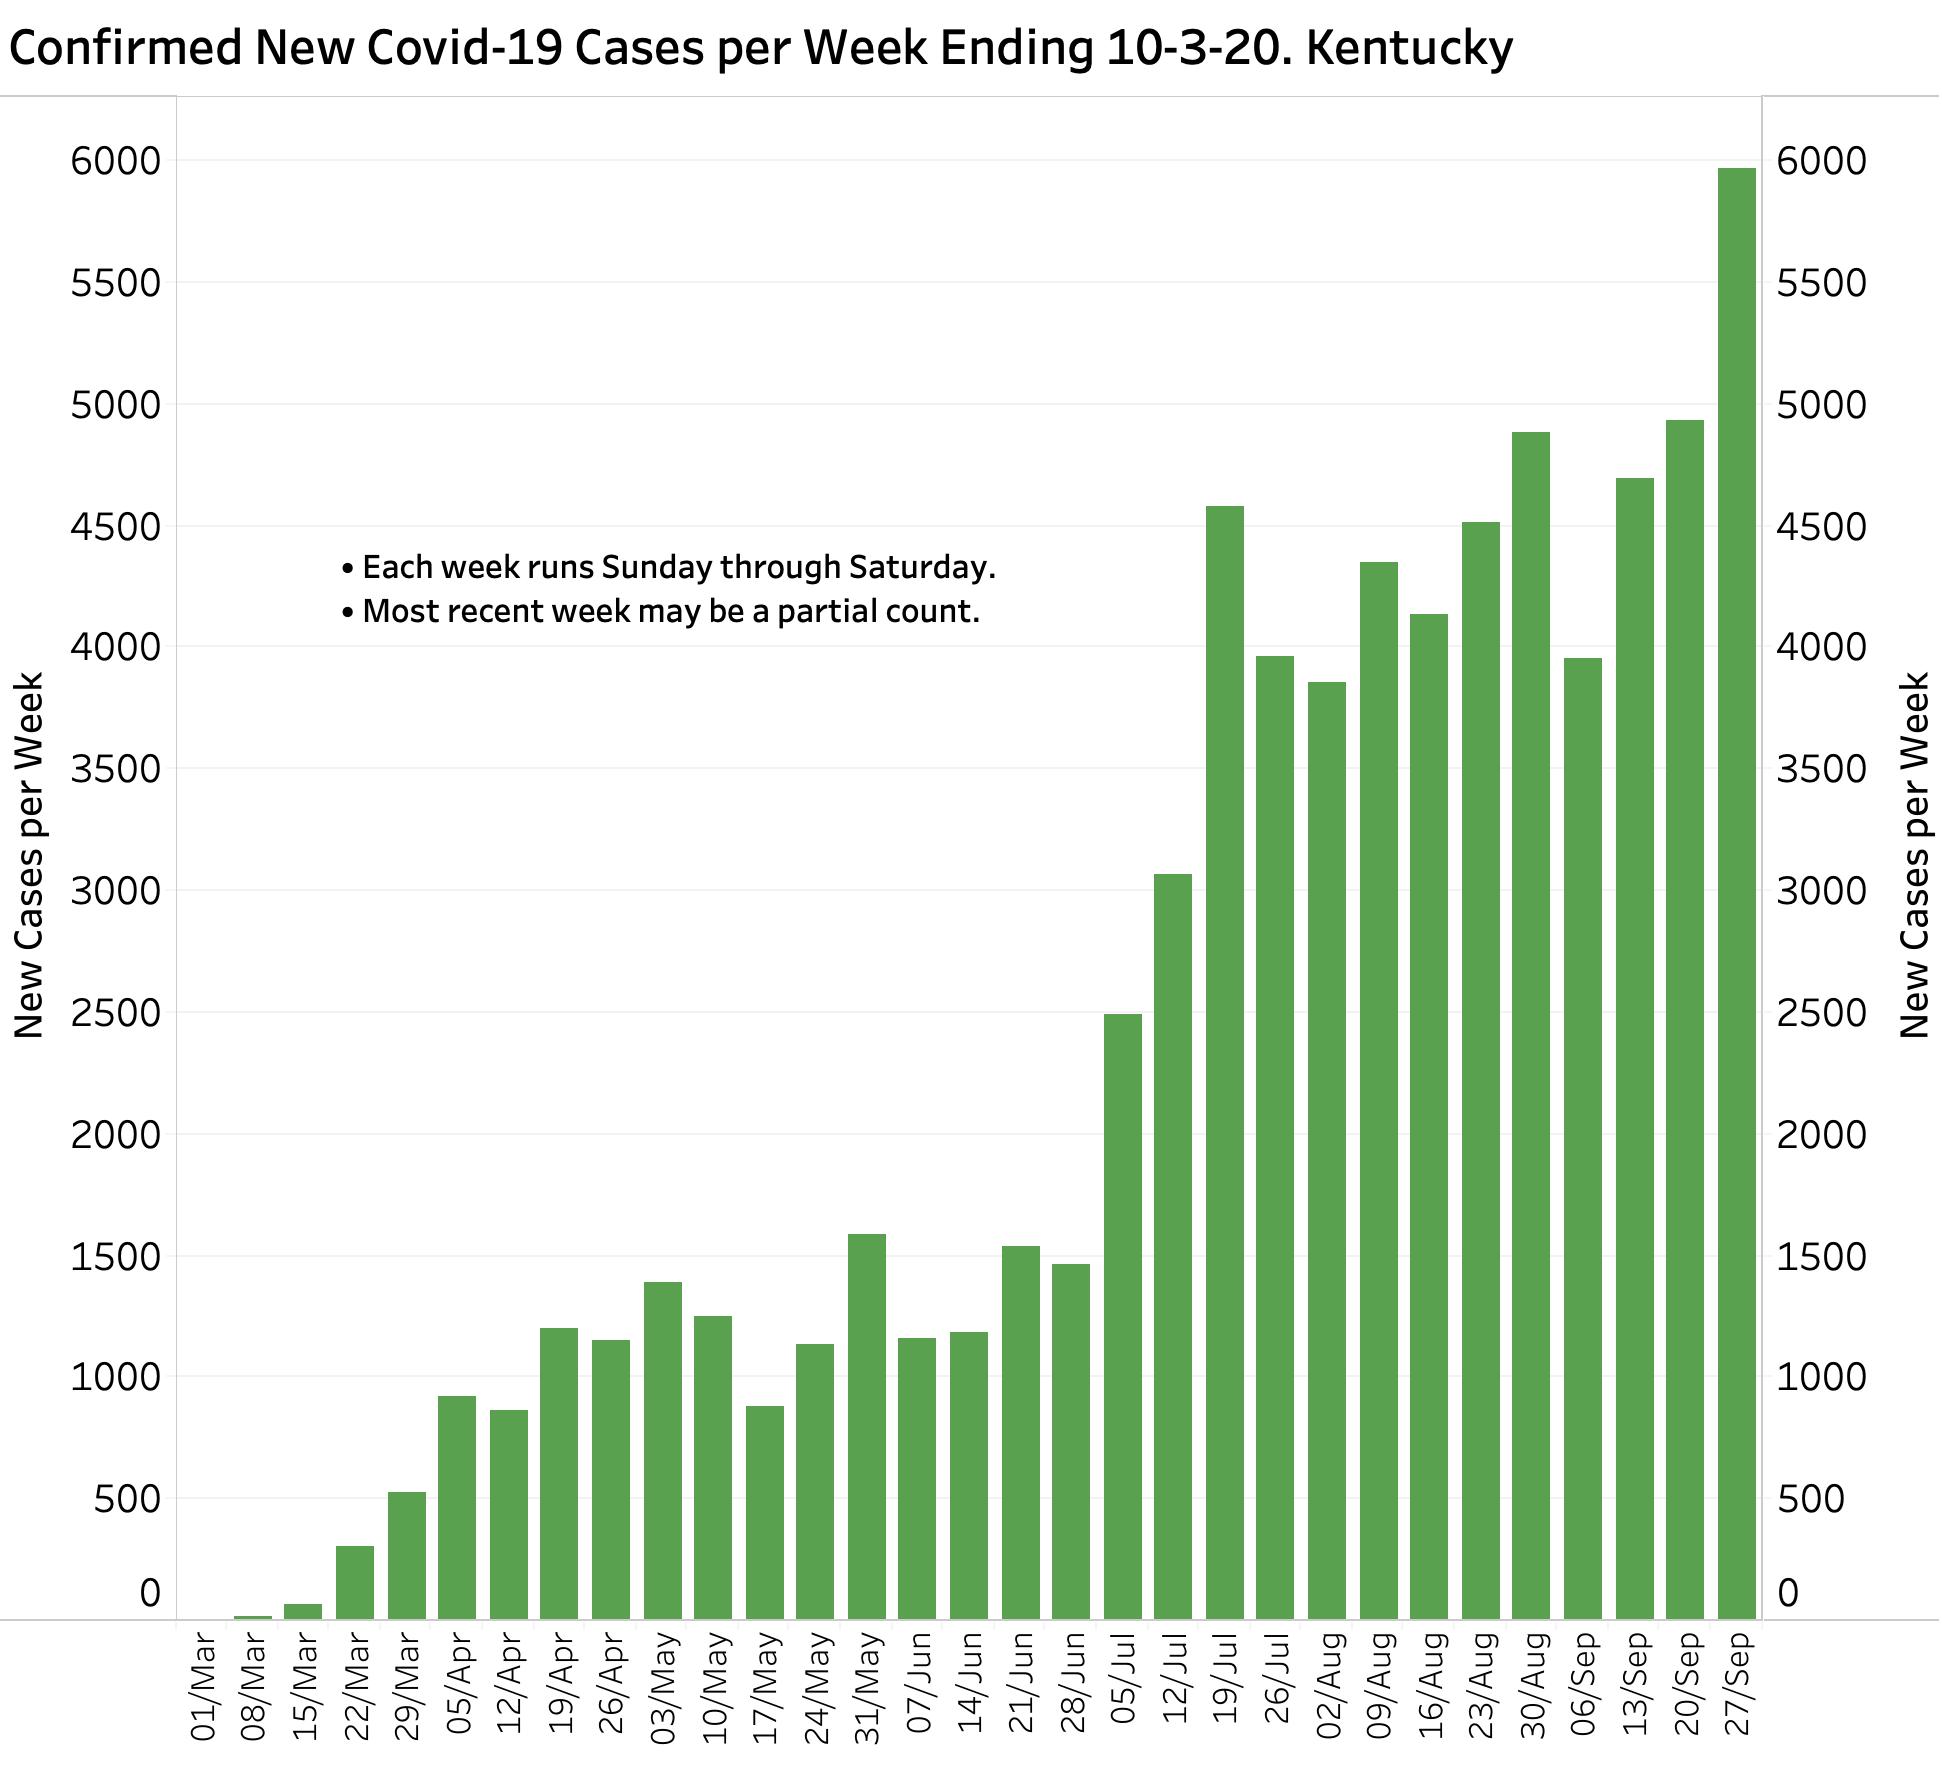
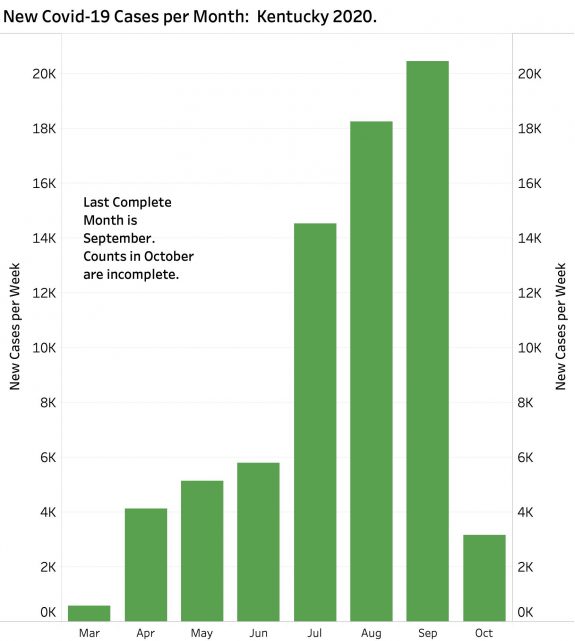
Last week’s count of Confirmed New Cases of Covid-19 gave us new highs for both a single day and the week– and by no small measures. On Saturday, 1274 confirmed new cases were added to Kentucky’s total. The total for the week (Sunday to Saturday) was greater than 1000 new cases higher than the previous week–which was itself a record high. Monthly new cases continue to rise at a similar pace.
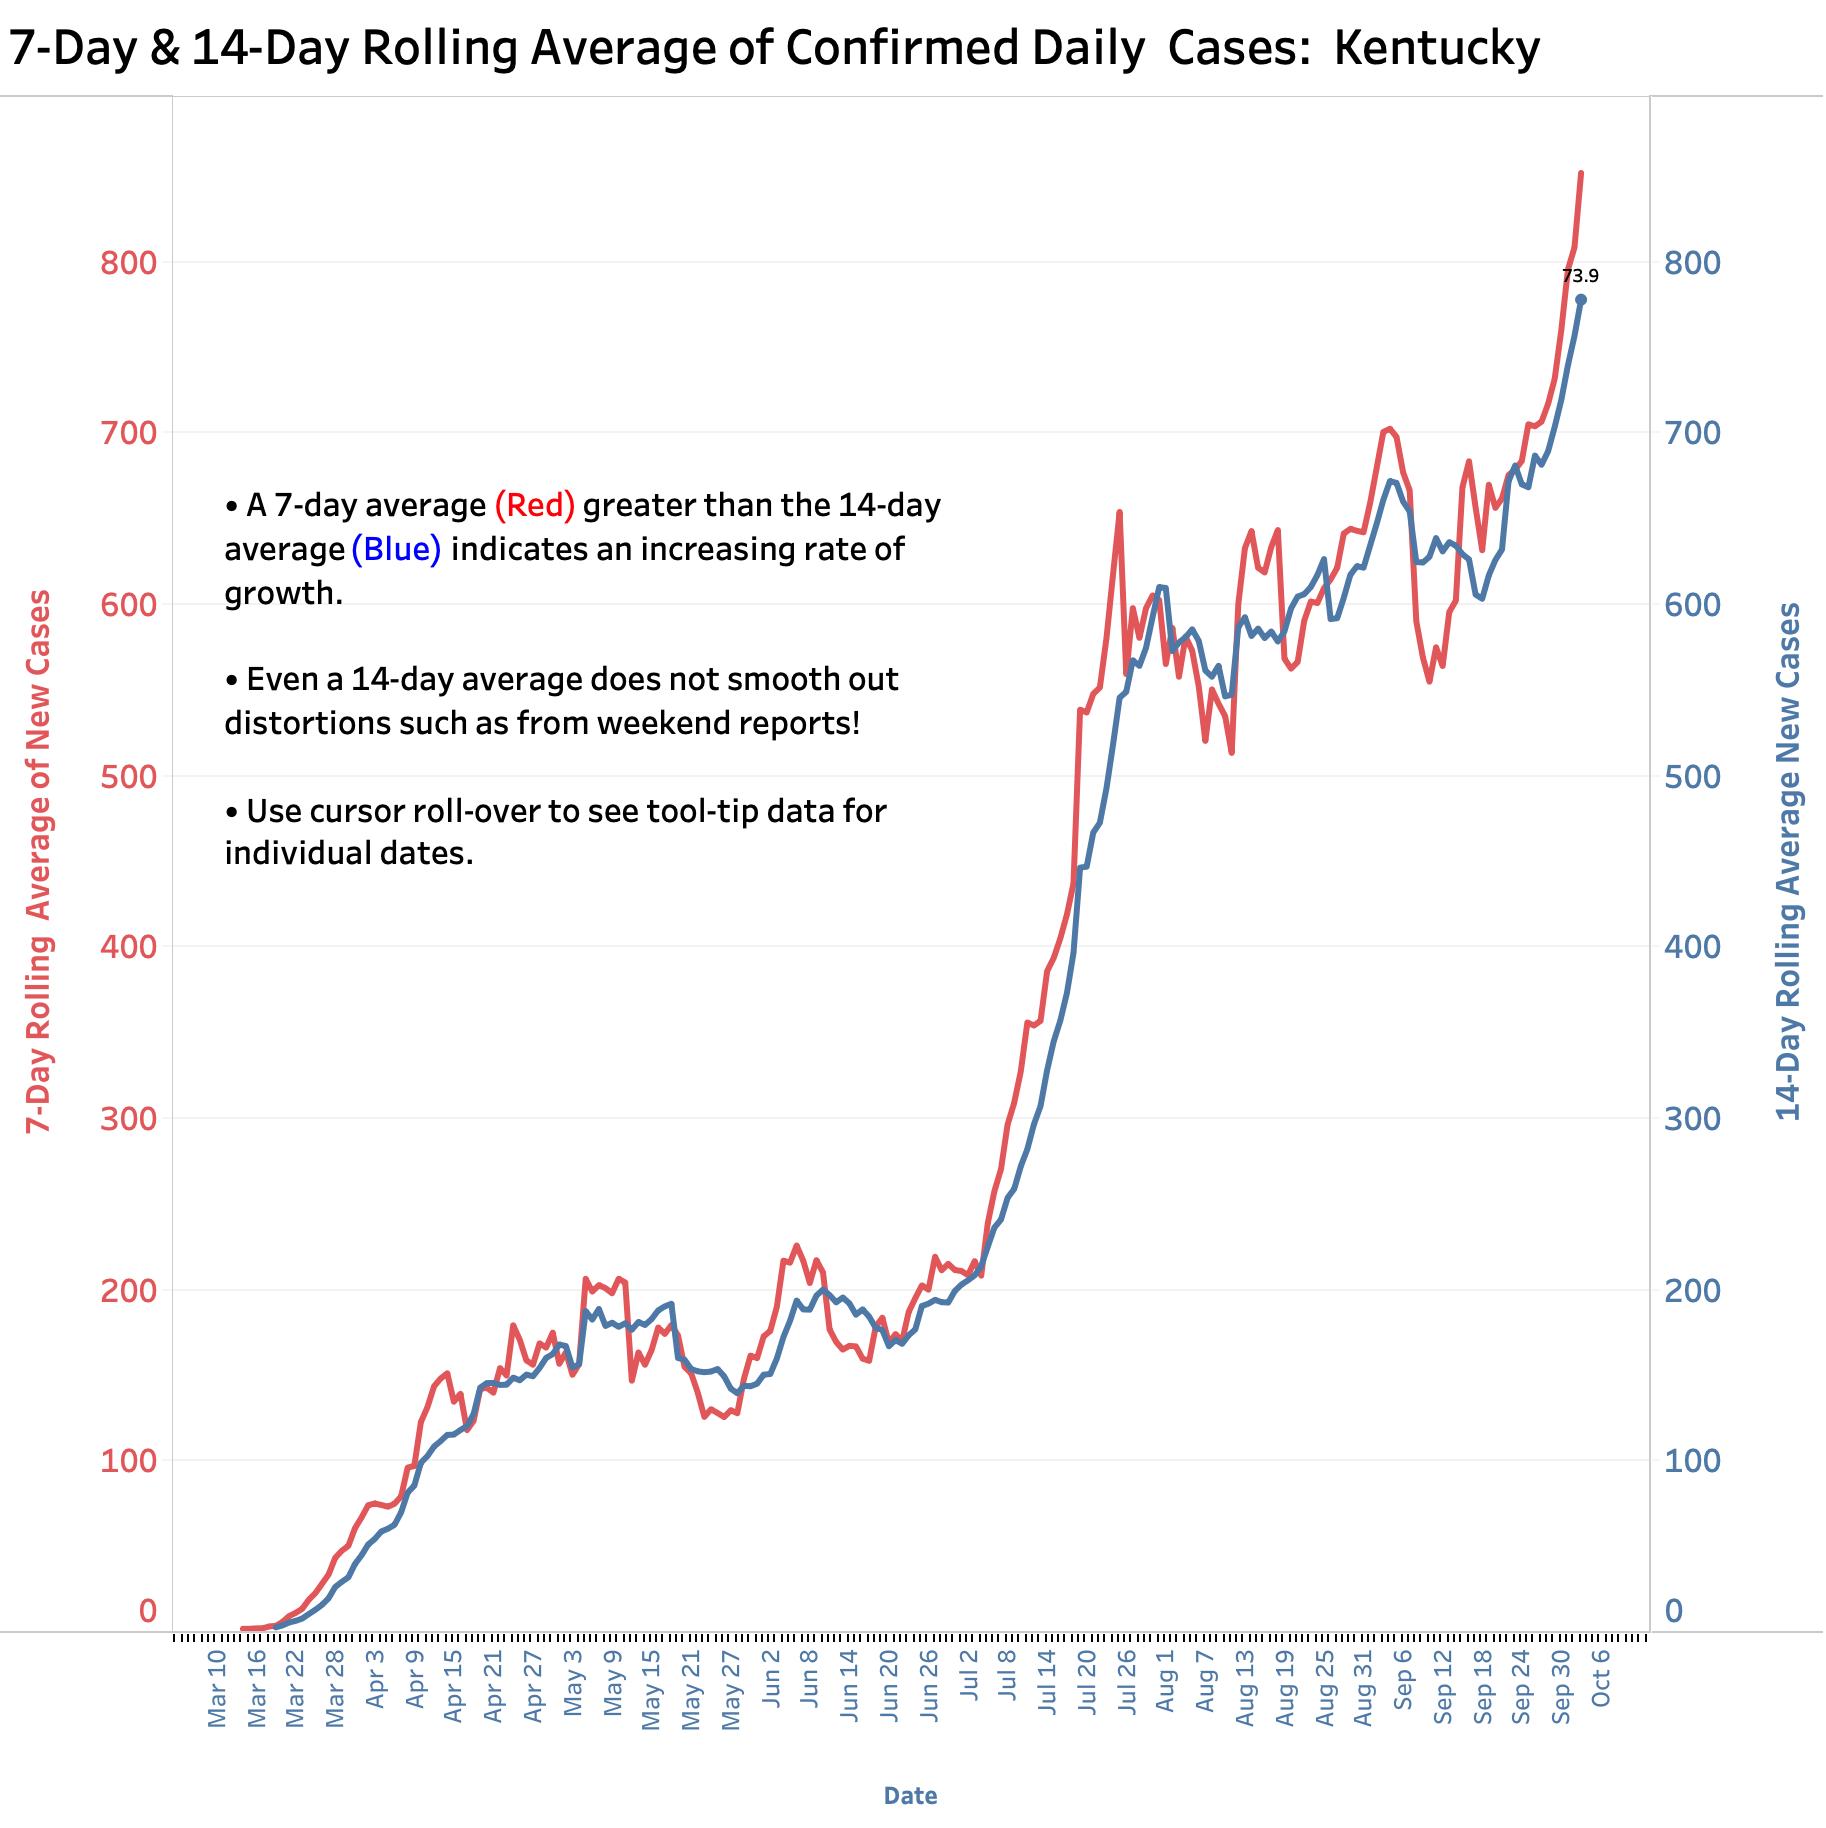
The difference between the 7-Day and 14-Day averages of new confirmed cases has not been higher than during the July expansion of the epidemic indicating a faster rate of growth. The experience of the next week will make it clear whether we have launched into a sustained accelerated phase as after those of June and July.
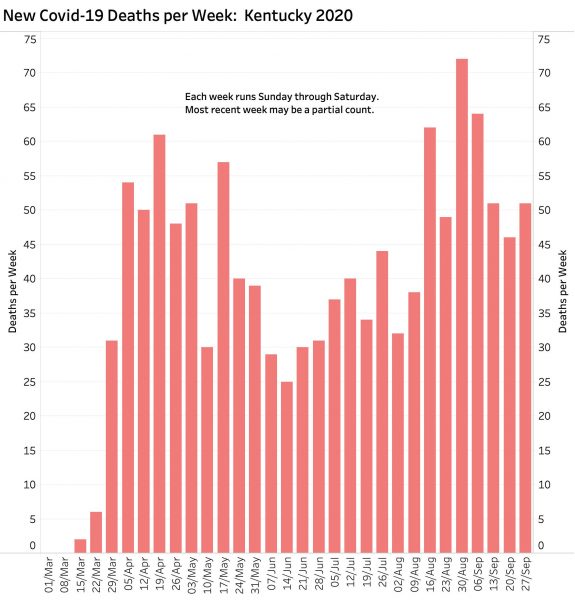
Deaths have not been rising in parallel, but there is no reason not to expect them to over the next few weeks as the illness takes its predictably delayed toll.
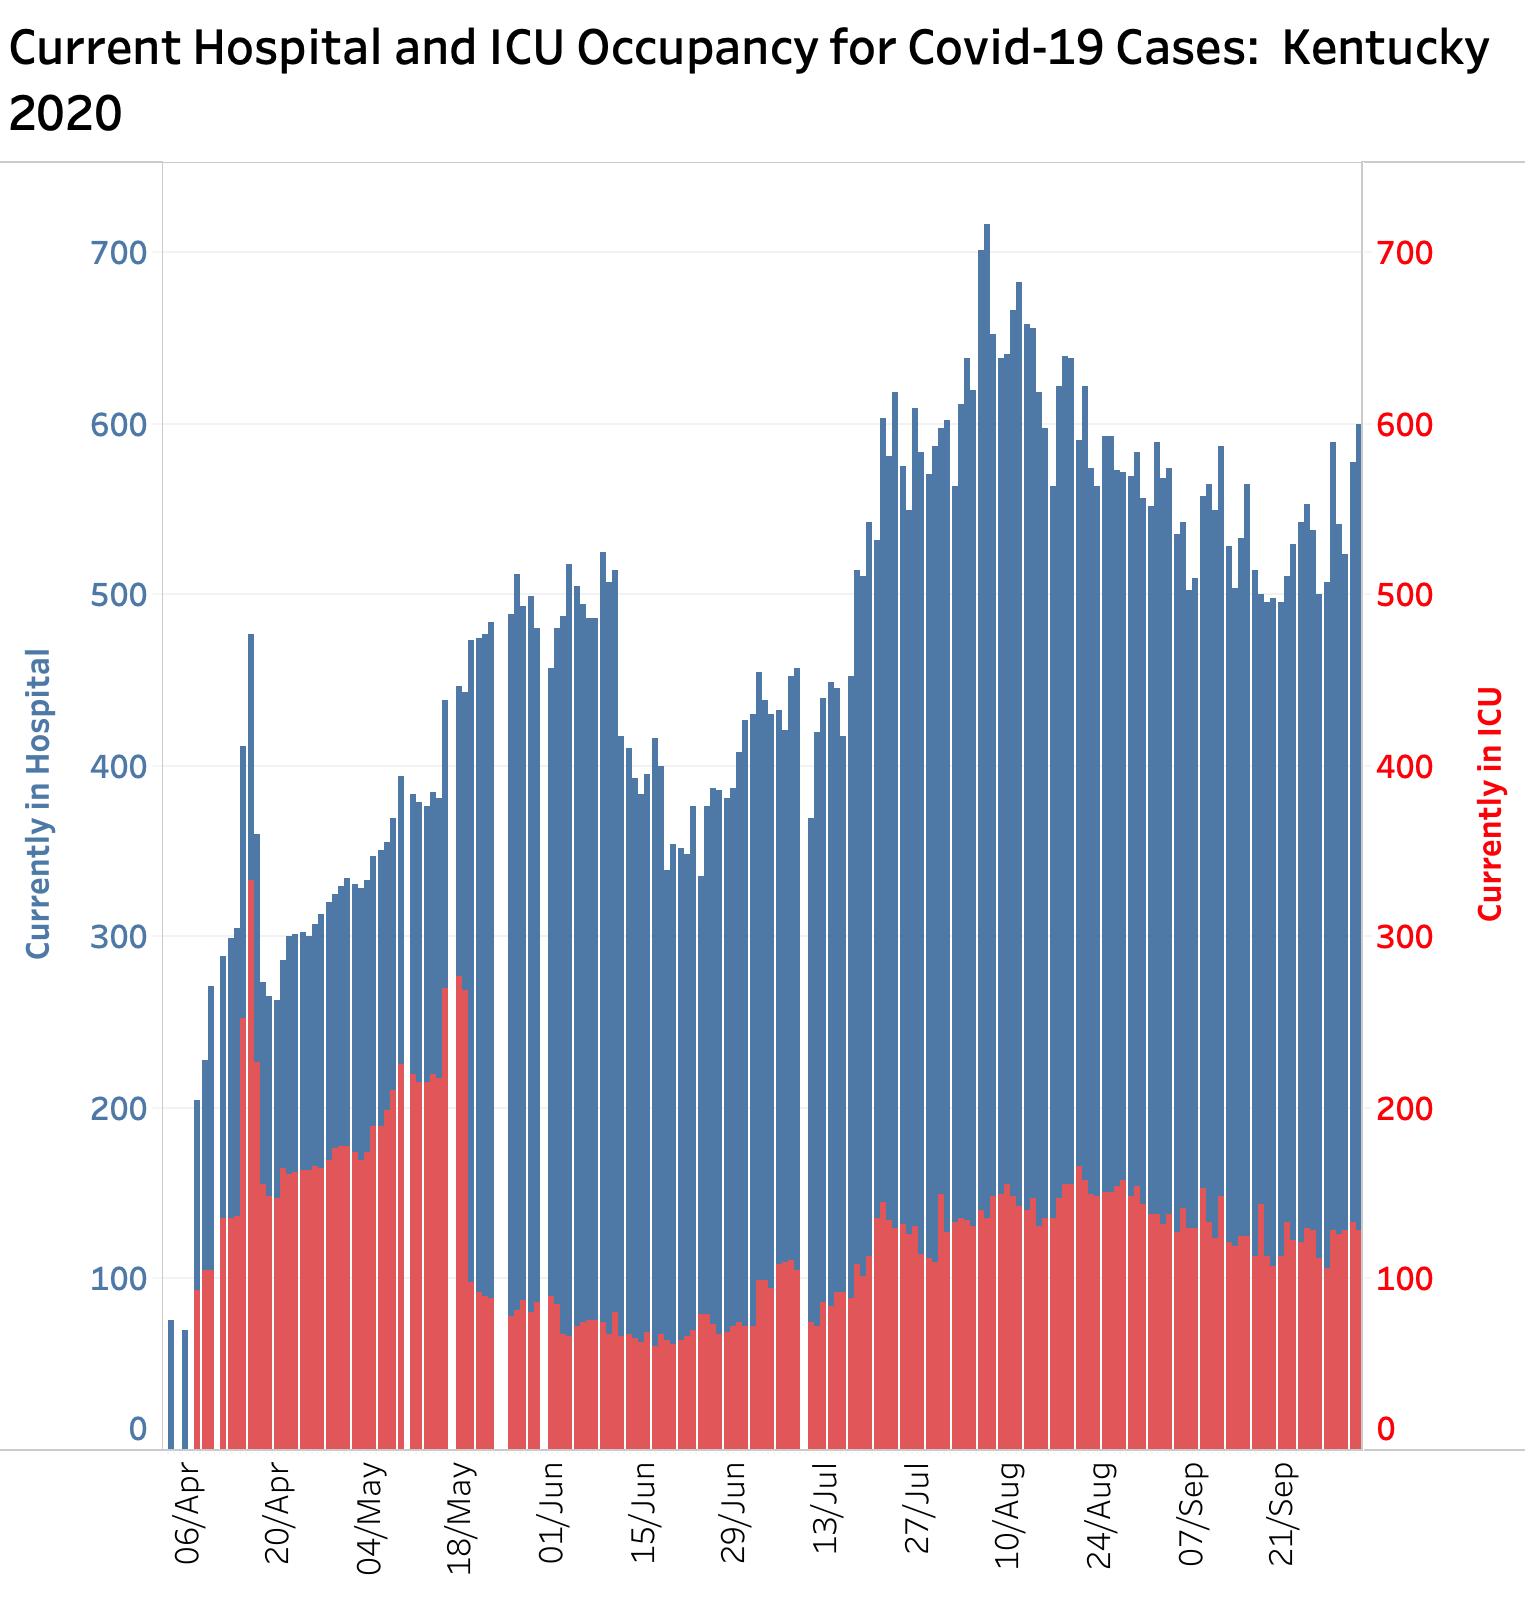
Hospital utilization has been difficult to get a handle on nationally where hospitals complain about the complexity and difficult in reporting. Current Kentucky data may show a hint of an increase. I am hearing that things are busy but not overwhelming locally.
Comments:
Even the meddling amateur epidemiologists that Kentucky’s Commissioner of Public Health warned us about last week might reasonably be concerned that our Covid-19 epidemic in Kentucky has entered a new phase of rapid expansion deserving of more robust cooperation from the public at risk.
Where are these new additional patients coming from from either geographically or based on other risk factors? Was it the opening of K-12 schools or colleges and universities? Did the protests that have roiled counties such as Jefferson and brought in out of state individuals made the epidemic worse? Did large-scale sporting events, albeit with conditions of reduced numbers of spectators and efforts to protect players, have a role? Is in-person worship as risky here as it has been elsewhere? Urban vs. Rural? Red vs. Blue. Poor vs. rich? Bars, restaurants and other public places of congregation? Is our rising caseload the predictable effect of Coronavirus-fatigue and a weakening of personal or community resolve? I am not aware that we have the necessary evidence to estimate the impact of any of the above.
The data available publicly from national Covid-data aggregators like Johns Hopkins or the New York Times, or even from our own Kentucky Public Health Website is helpful to count cases and give some high-level indication of where people are getting sick, but is very limited in helping to answer the questions or issues I raise above. A conversation I had with one of the public health directors of one of Kentucky’s more rural set of counties convinced me that public health leadership on the ground is in the best position to see where the virus is coming from in a timely way, and where best to apply targeted public health measures to limit the disaster of our current a plague on our bodies, both physical and politic.
Today is Monday. Yesterday’s number of new cases was 616 which is high for a Sunday. I am holding my breath with the rest of my readers for today’s count.
Peter Hasselbacher, MD
October 5, 2020
Comment:
I have updated my Kentucky version of the New York Times “Cases and Deaths” counts which is available to the public on a county level (Why not from Frankfort?) I wondered how much of Kentucky epidemic surge was occurring in larger urban counties vs. smaller and rural ones. You can explore for yourselves, but my initial look reveals similar epidemic curves for virtually all 120 Kentucky Counties. That is to say, since early July, the epidemic is expanding at nearly the same rate all over the state. Posting the data here would lengthen my already overly-long article. I will present the data and representative charts soon. As before, I will make the supporting Excel file available to all.
I also extracted the ages of Kentucky cases from recent daily .pdf documents released by the state. I wanted to test the hypothesis that it was increasing numbers of students of all ages that was driving the recent surge as has been reported in other communities. Surely this is information that is critical to the process of returning our students to schools. I find that individuals from ages 10-19 and 20-29 make up the fastest growing groups, but I did not expect some of the other findings. I will present this information and the extracted file in another article.
PH