
Can it really be a negotiation?
The United States House and Senate are on the cusp of passing what remains of the original “Build Back Better Bill” into a pared-down “Inflation Relief Bill.” What remains in the bill remains to be seen, but should it pass, it contains a major section, “Prescription Drug Pricing Reform,” that includes a “Price Negotiation Program to Lower Prices for Certain High-Priced Single Source Drugs.” The ability of the government to negotiate or have any sort of control over drug pricing is probably the one issue most resisted by the pharmaceutical industry. The bill is difficult for mere-mortals to understand with references to various internal and external laws. I do not fully understand all of it yet. In brief, the bill allows Medicare to “negotiate” with drug manufactures for 10 to 20 drugs at a time per year over the next few years. We customers will not see much effect for a while. Medicare will select the drugs to be negotiated from among the top 50 Part-B and Part-D drugs ranked by the total cost to Medicare and its beneficiaries. Since the top 50 drugs make up almost half of Part-D total drug costs, the potential impact on Medicare beneficiaries and drug companies alike may be great. The remainder of this article will explore the top-50 drugs of pre-pandemic 2019.
For the purposes of this article, I used Medicare’s Public Use File: Part-D Utilization 2019 Drug Summary. The file summarizes the total drug cost and unique numbers of prescribers and beneficiaries for each of 1847 generic (chemical-name) drugs, broken down additionally into 3380 brand names or marketed versions of each generic. These are presented below in list and tree map formats.
Comments about the data.
Note that the data are only for Medicare beneficiaries who receive drug insurance coverage through Medicare Managed Care plans or stand-alone Part-D drug plans. Individuals who have private, Medicaid, other, or no insurance at all are not included in this data base. Nonetheless, the file allows a representative overview of the most expensive or prescribed drugs for adults of all general ilk. Total Drug Cost includes all payments from Medicare, other insurers, and out-of-pocket cost to Medicare beneficiaries. Claims include the number of new prescriptions and refills. There are a few related non-drug entities in the generic list such as insulin syringes, alcohol wipes for injections, and the like.
Overview of Data.
The aggregate Total Drug Cost for all 1847 generic entries was $365.0B. The top 50 most expensive drugs by generic name had an aggregate Total Drug Cost of $177.4B. The top 50 drugs as a group made up only 2.7% of all the generic entities but accounted for 48.5% of the Total Drug Cost! Eighty-six of the generic drugs had a total cost to Medicare of greater than $1B. These raw numbers alone suggest the potential impact to government and individuals of what will be published Maximum Fair Prices that are part of the bill.
Below are two lists of the Top 50. The first aggregates all entries for a single given generic or “chemical” name with their Total Drug Cost and Total Claims. Most of these are expensive single-source drugs with monopoly patent protection. A few, such as levothyroxine (thyroid hormone) or atorvastin (a cholesterol lowering drug that includes the brand name Lipitor) are relatively inexpensive but are prescribed so many times that they make the Top-50 list.
The second list breaks down the generic/chemical name into the various brand names available including different versions of the same branded drug such as the method of administration or dosage strength. If the generic name is also in the brand name column, that should indicate that a generic version was available. It may be the case that a drug is sometimes prescribed by the provider as a brand name but dispensed as a generic by the pharmacist, but I must work with how Medicare has kept track of what it has paid for!
Comments to here:
Because there so few entries in the Top-50 list for which a generic was available, one cannot get much of a feel for the potential saving if only generic prices for a given drug– including brand names. (That is not the case when one goes further down the Total Cost List!) However, take Oxycodone HCl as an example. When dispensed as oxycodone generic, the cost calculates to $24/claim, vs. $632 for Oxycontin. For atorvastim calcium generic the cost is $17/claim vs. $877 for Lipitor. [I am not confident that the simple division of cost by claims is an exact way to know what is paid in the drugstore, but we all know that the world of drug pricing is more bizarre than that of Alice in Wonderland. A simple look at what your receipt says you have saved when you pick up your prescription has no discernable connection to reality!]
The next pair of Tree Maps shows how a relatively few drugs account for the majority of Total Drug Cost, or the flip side of how a relatively few drugs account for the vast majority of the prescriptions written for Medicare and the rest of us. For both graphics, every one of the 1847 generic drugs is represented in a white-bordered rectangle and sub-divided into the generic and brand versions of the drug. In the first, the size of the rectangle represents the Total Drug Cost, and the intensity of the colored shading the number of claims. In the second, the size and color relationships are reversed.
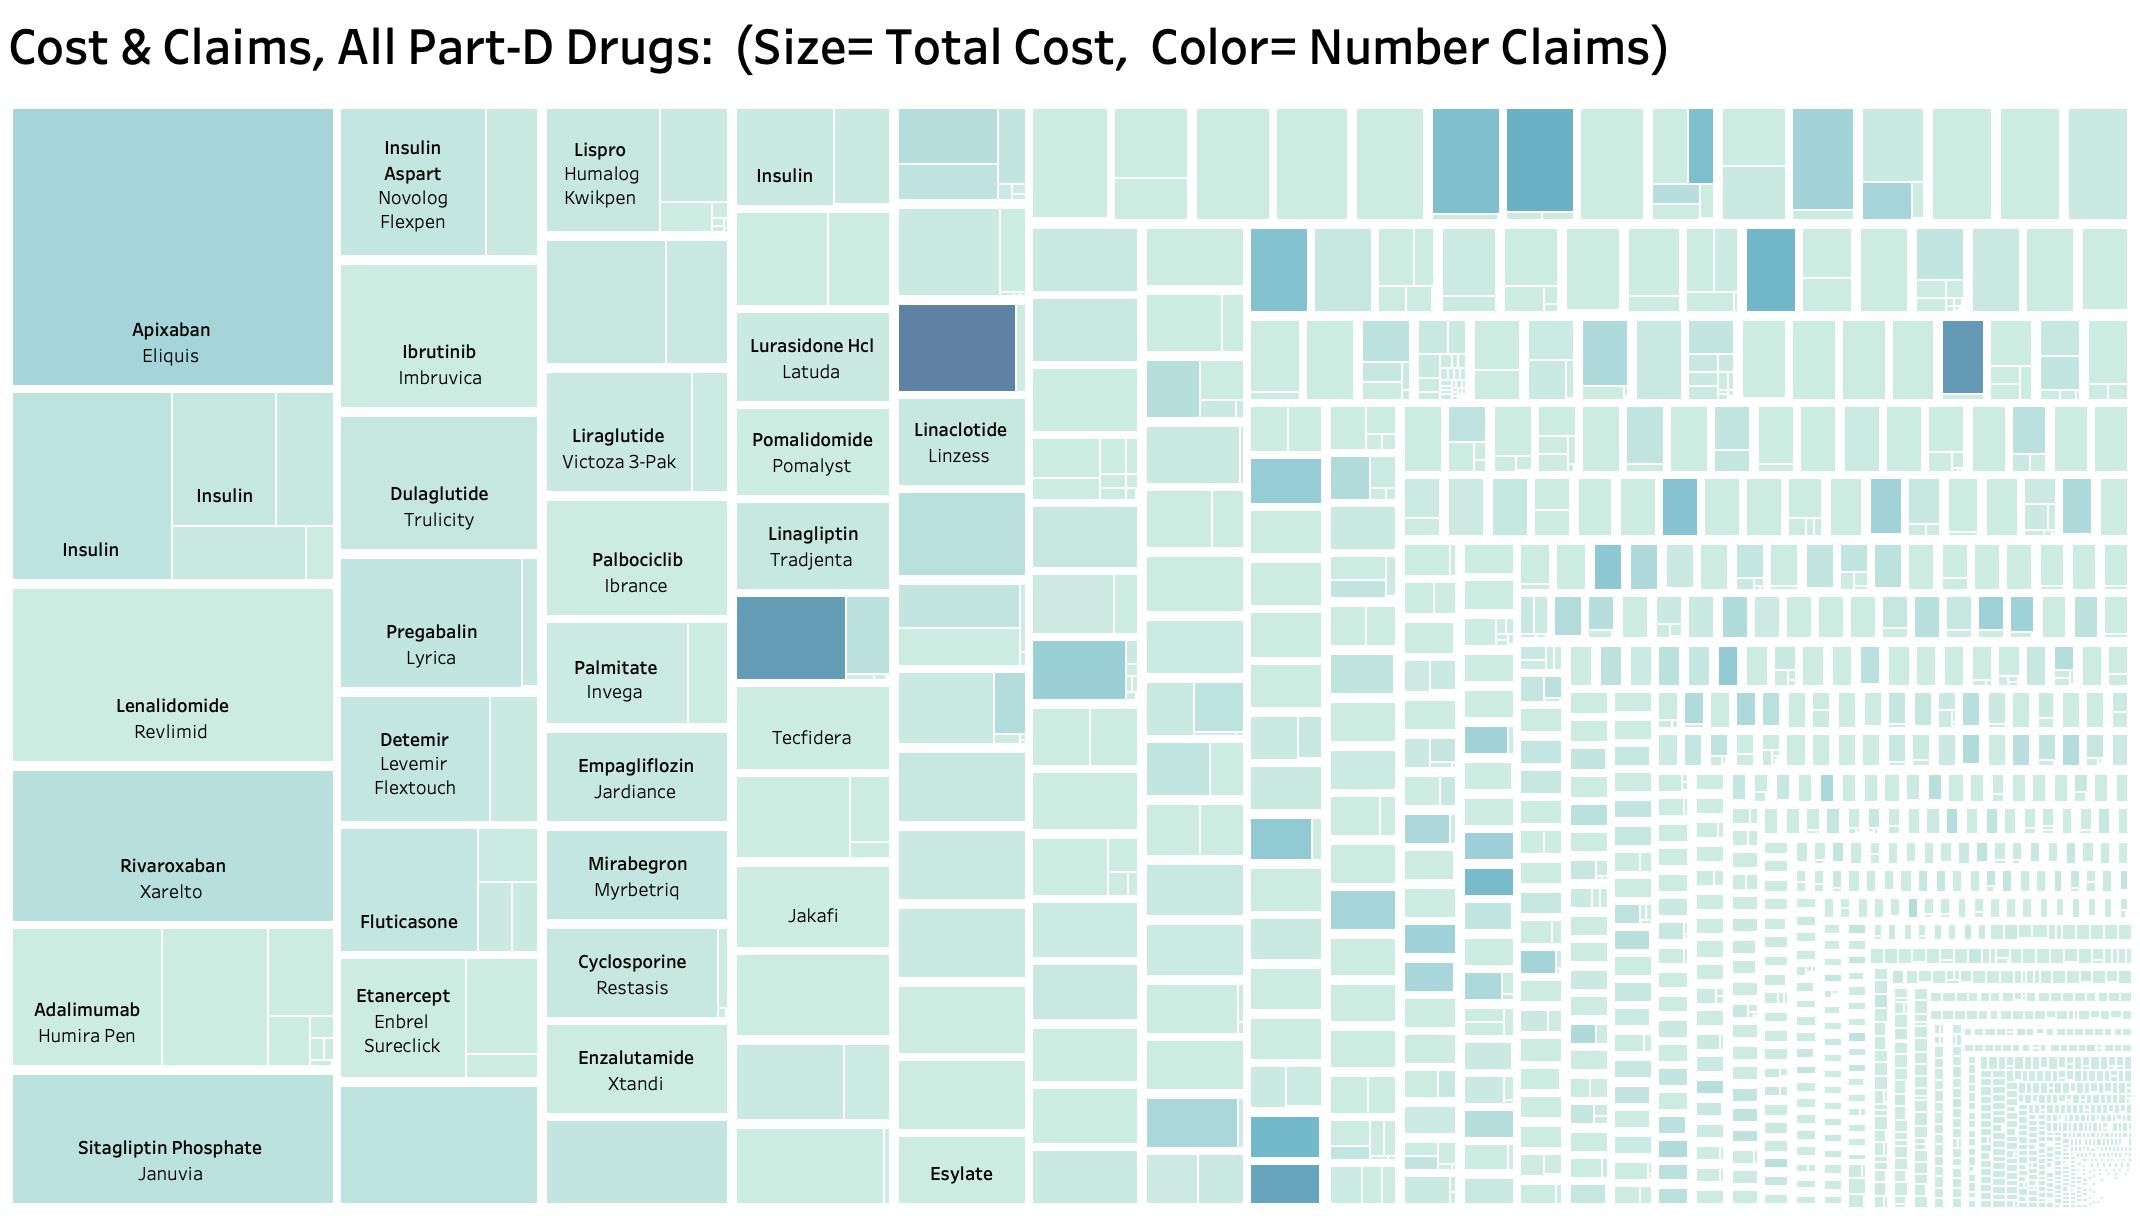
Cost and Claims:
As expected, the Top-50 drugs for Total Drug Cost lie on the left side of the tree map. Most of the darker shaded rectangles lie on the right half. There is a lot of information buried in the graphic. For example, it becomes more obvious when generics appear underused in favor of brand names. (I will try to post my entire analysis on KHPI’s Tableau Pubic website. That will give the user the ability to mouse-over each individual rectangle to identify names, costs, and claims for each subdivision. In the meantime, it should be possible to download all the figures and lists presented here.)
Claims and Costs:
I suppose that some good news is that for the most part, the drugs that are most prescribed are also dispensed (paid for) as the generic version. The drugs that cost the system the most are over on the right, and even in the far lower right-hand corner where they are too small to visualize!
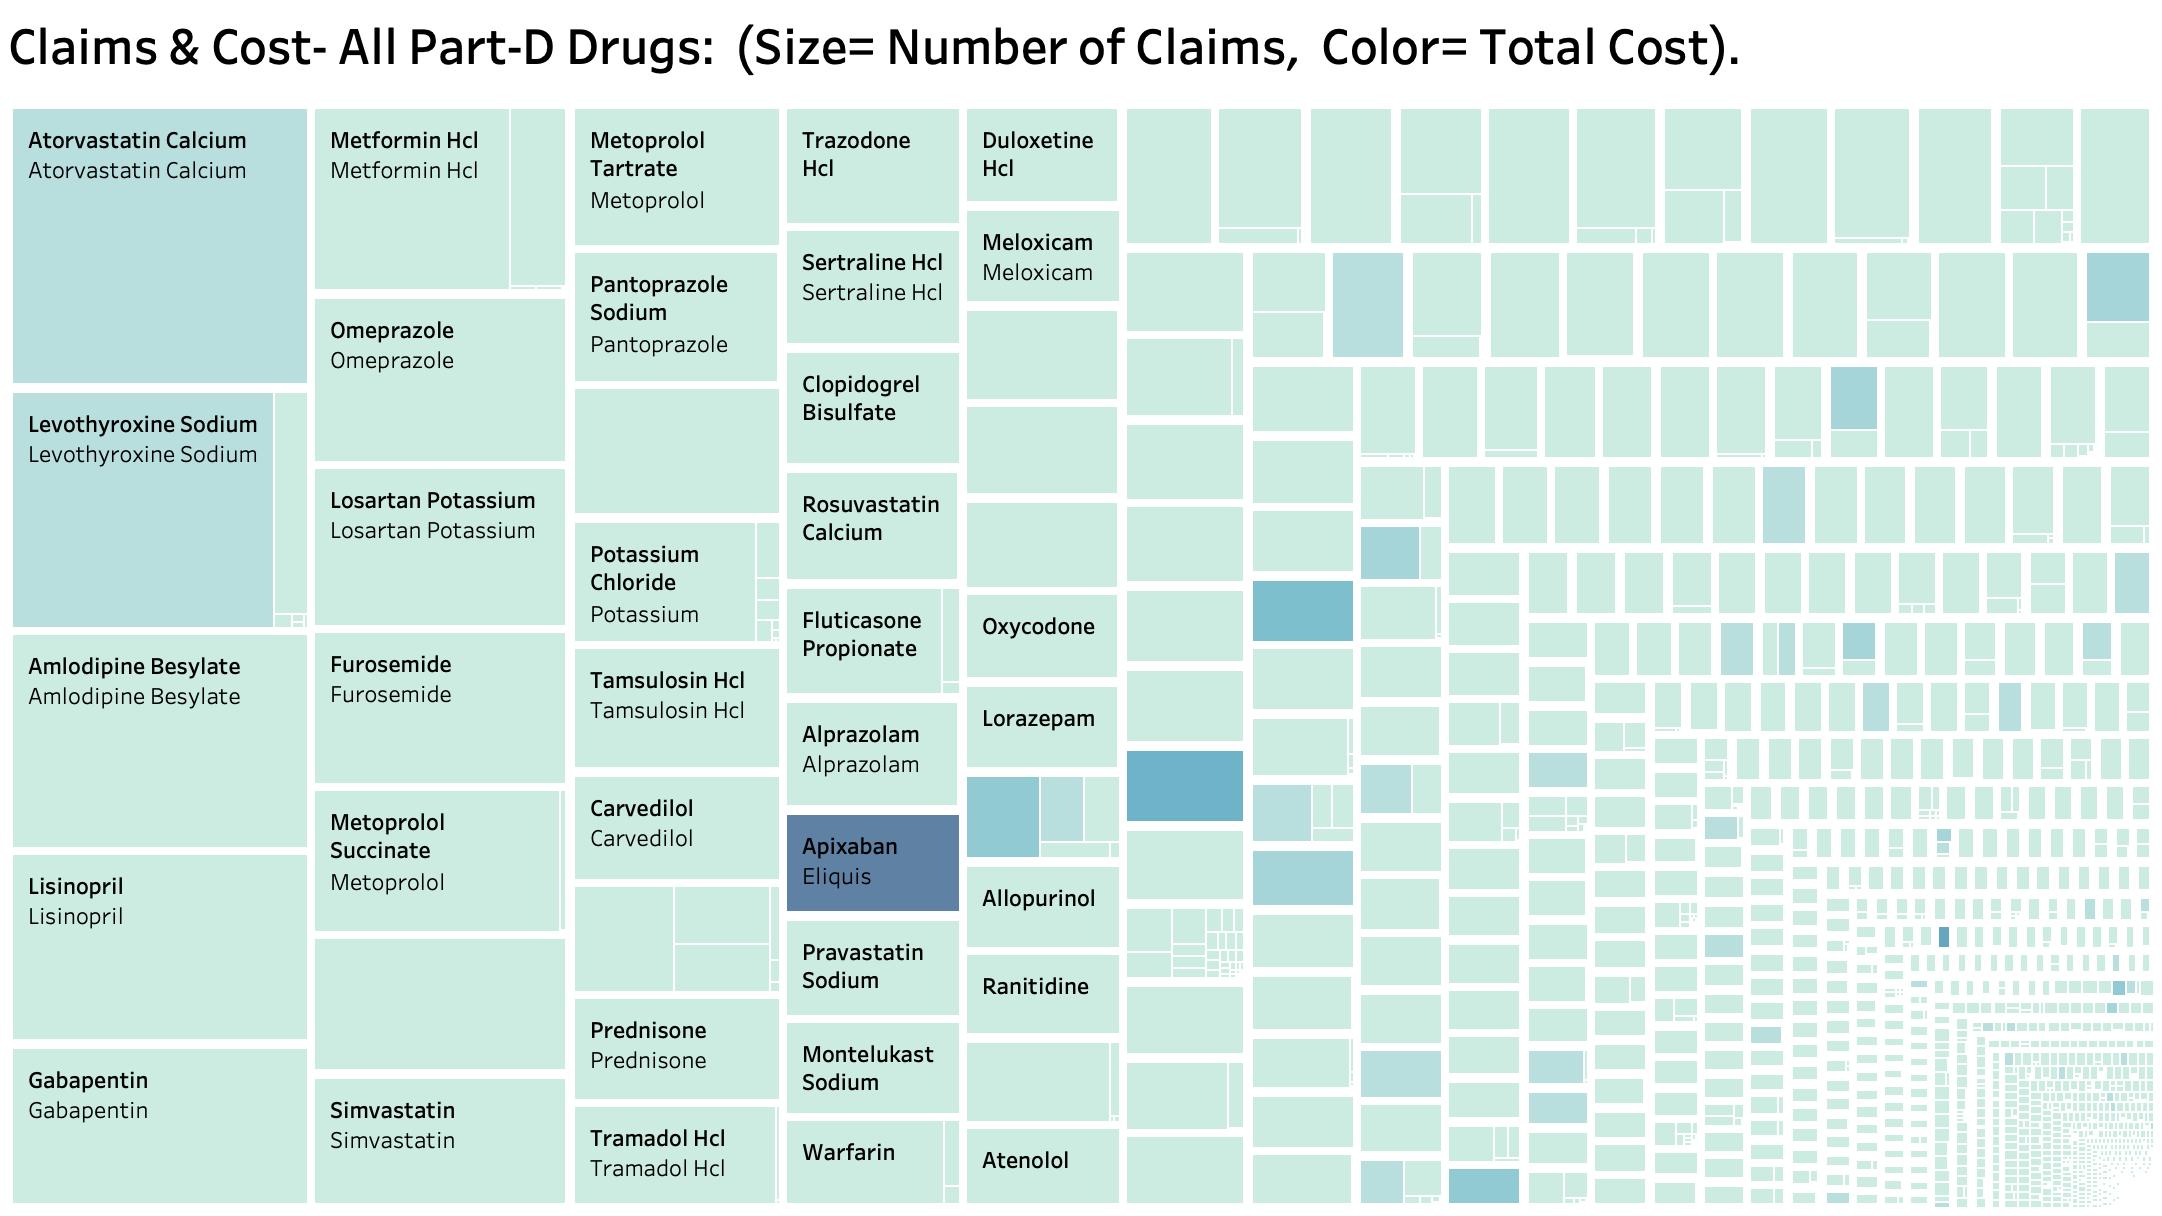
Some drugs are standout blockbusters. For example, of the top 20 most expensive drugs, the blood thinner apixaban (chemical name for brand name Eliquis) is both the most expensive and the most prescribed! Surely it will be among the first drugs to be “negotiated.” I find it perplexing that a generic version of Eliquis was approved in December 2019 and that it has not yet appeared on the market as of the present! The monthly price in a drugstore today is several hundreds of dollars. How come?
Enough for now. It is the end of the day on a Friday and we do not yet even know if the bill will pass or what will remain in it. There is much more to say including the criteria that Medicare will use in selecting its drugs to start the process! I want to get a start on things too. Let me say in anticipation, that for the first time Medicare would use the same language that we doctors use to judge whether a drug is worth it instead of the technical legalese that has characterized Medicare coverage policy and decisions to date. I am not unhappy with what I understand so far.
Peter Hasselbacher, MD
Emeritus Professor of Medicine, UofL
August 5, 2022