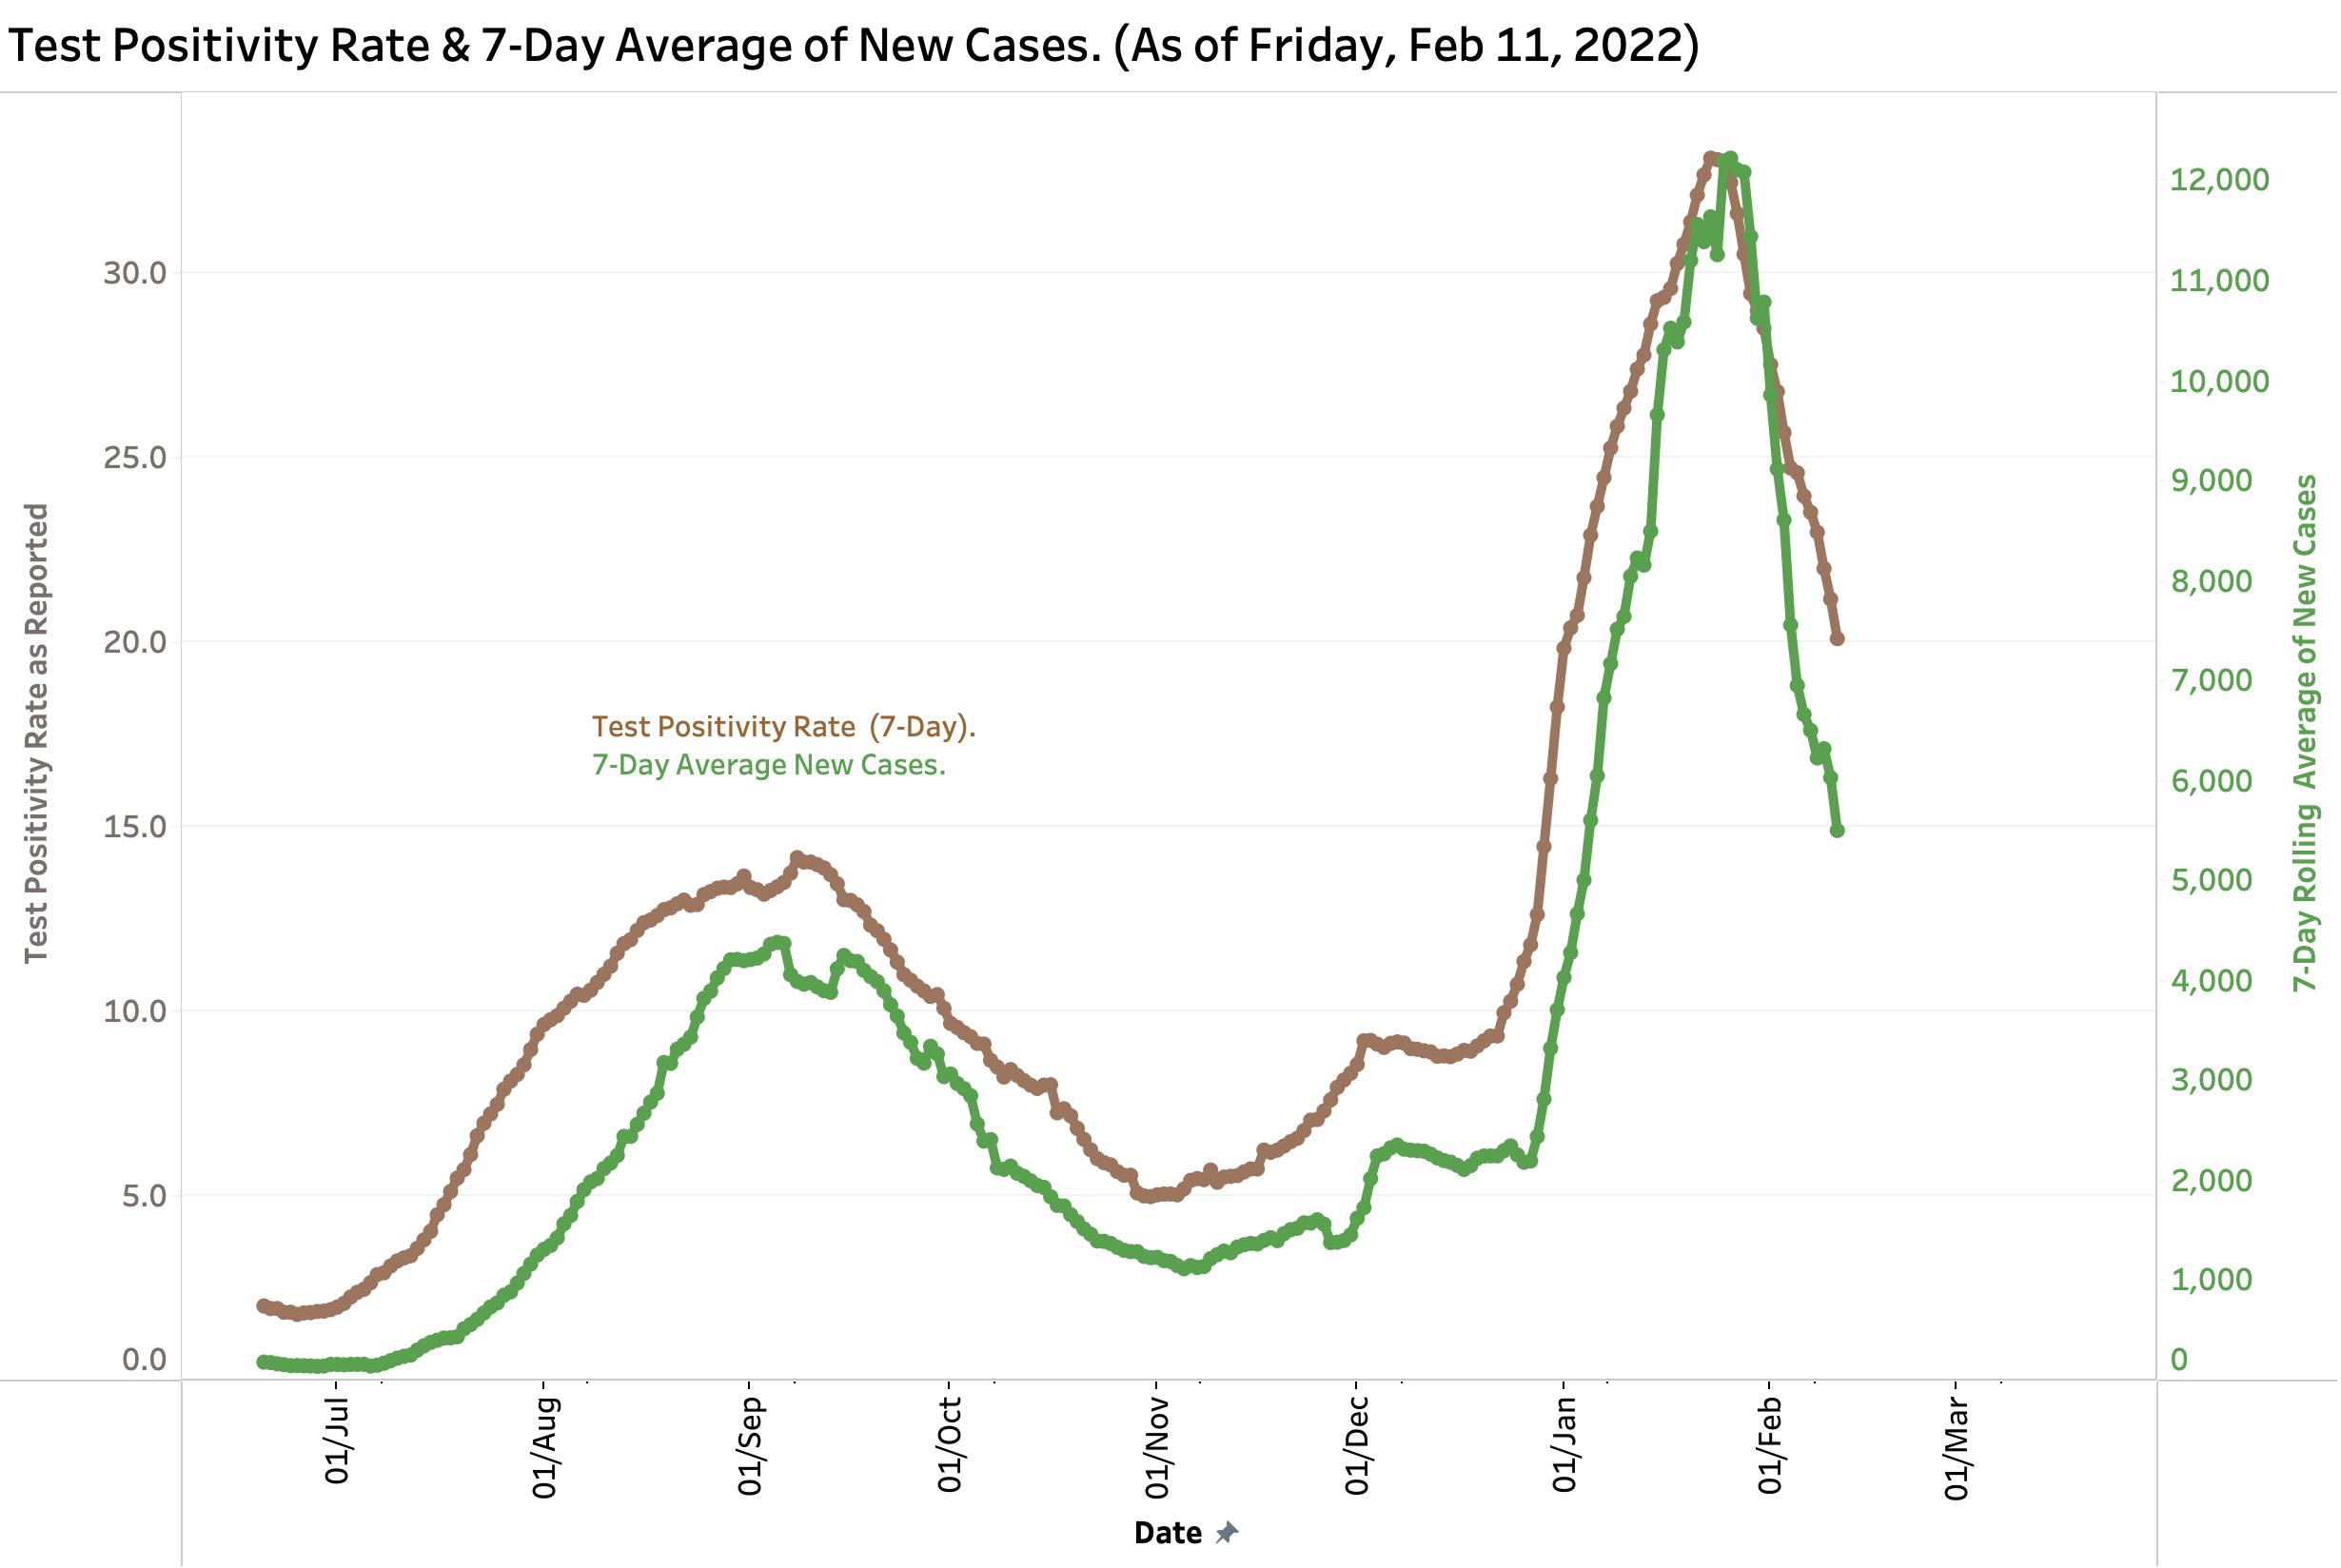
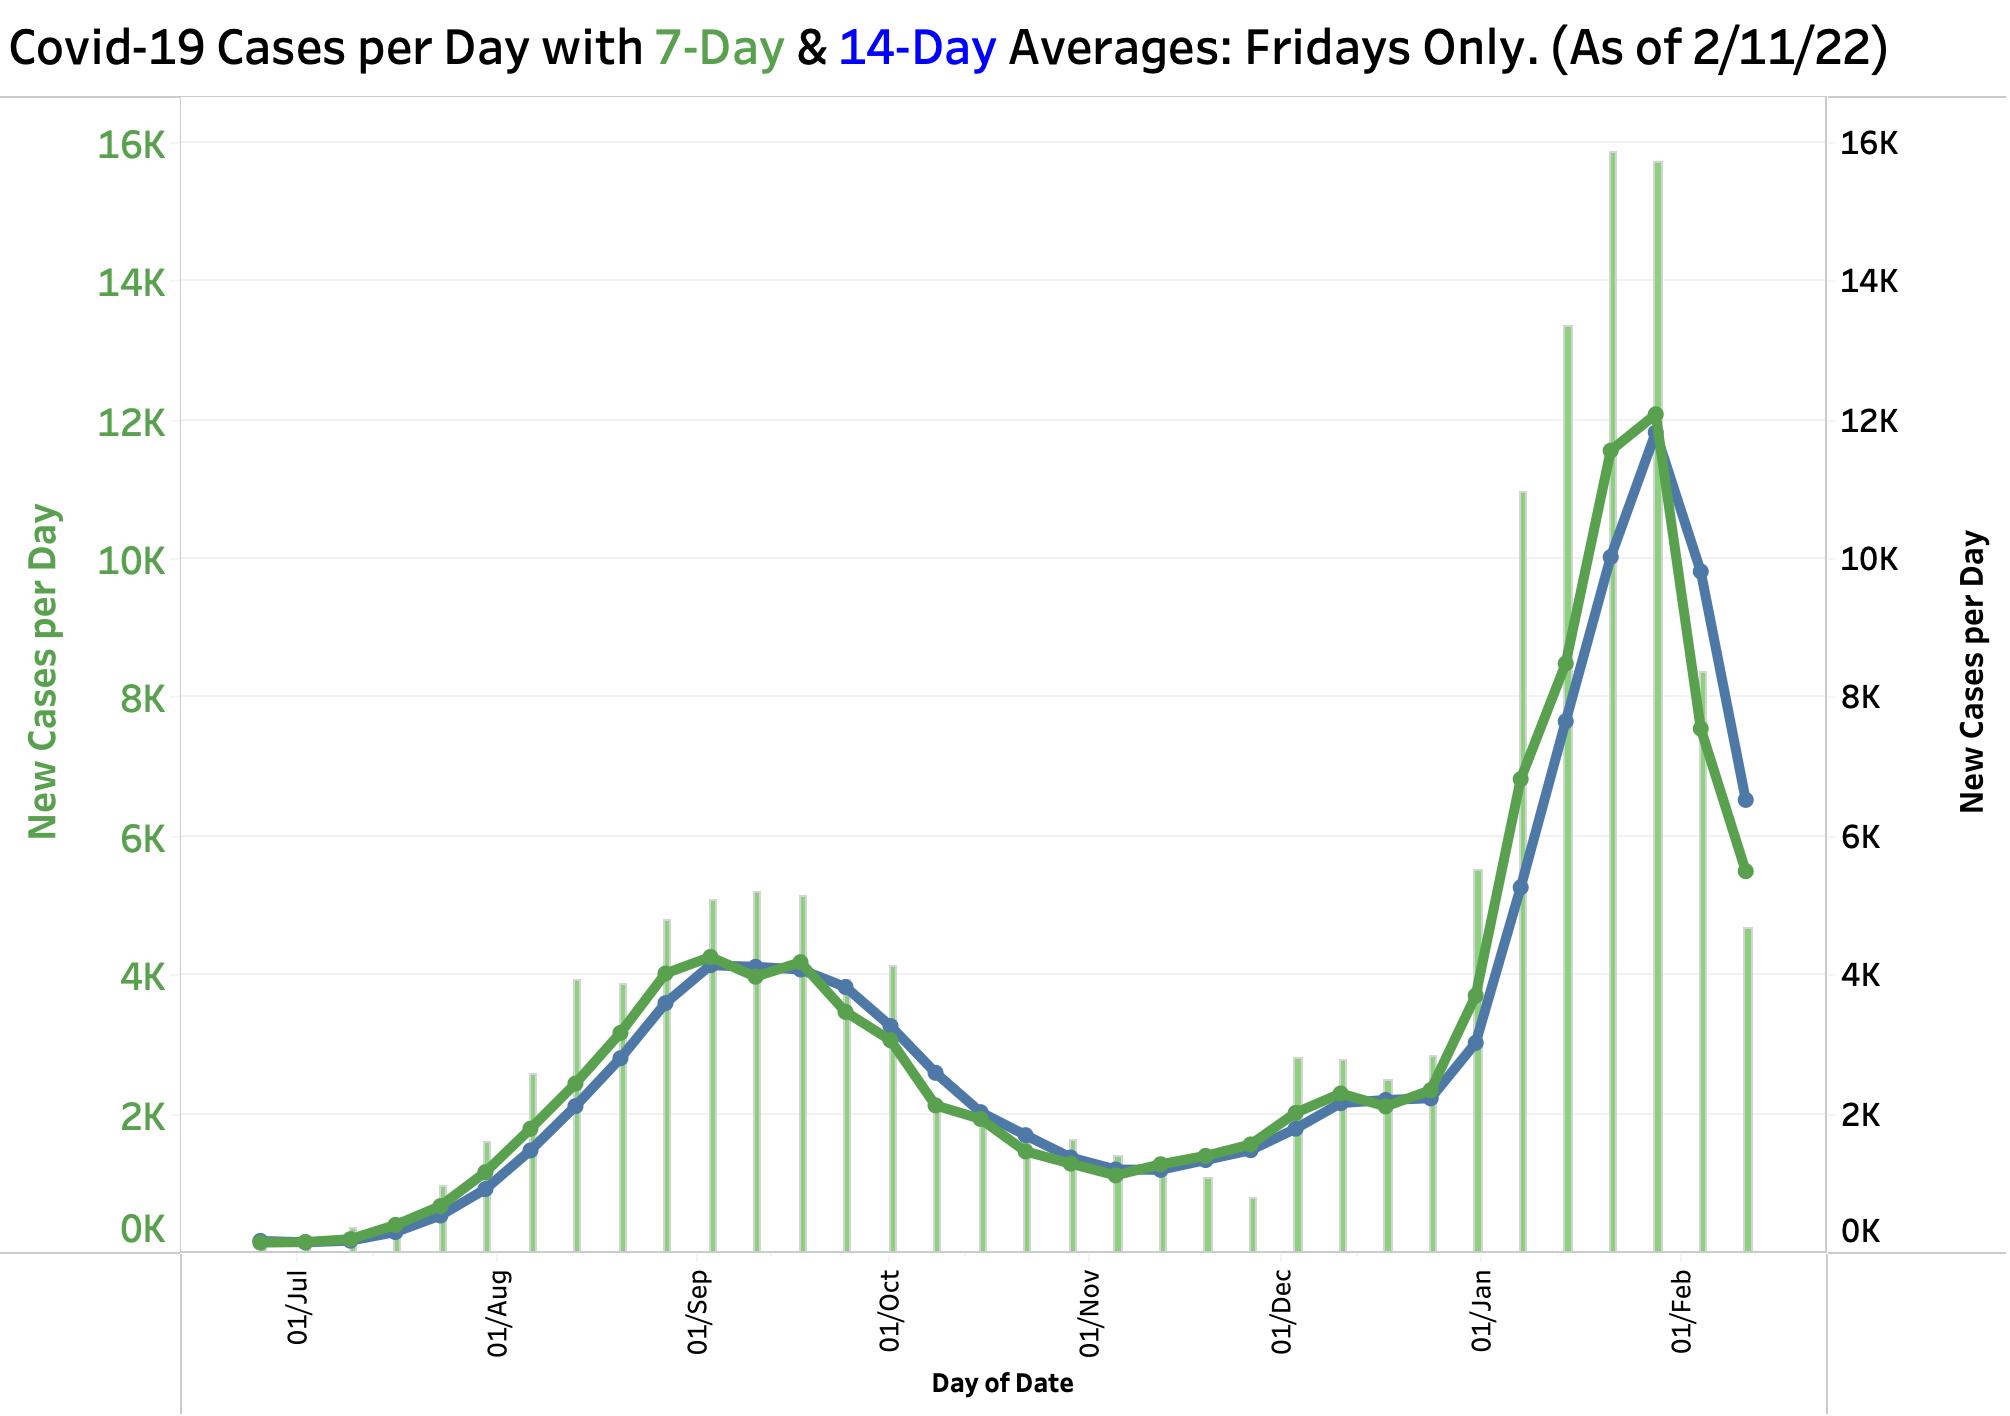
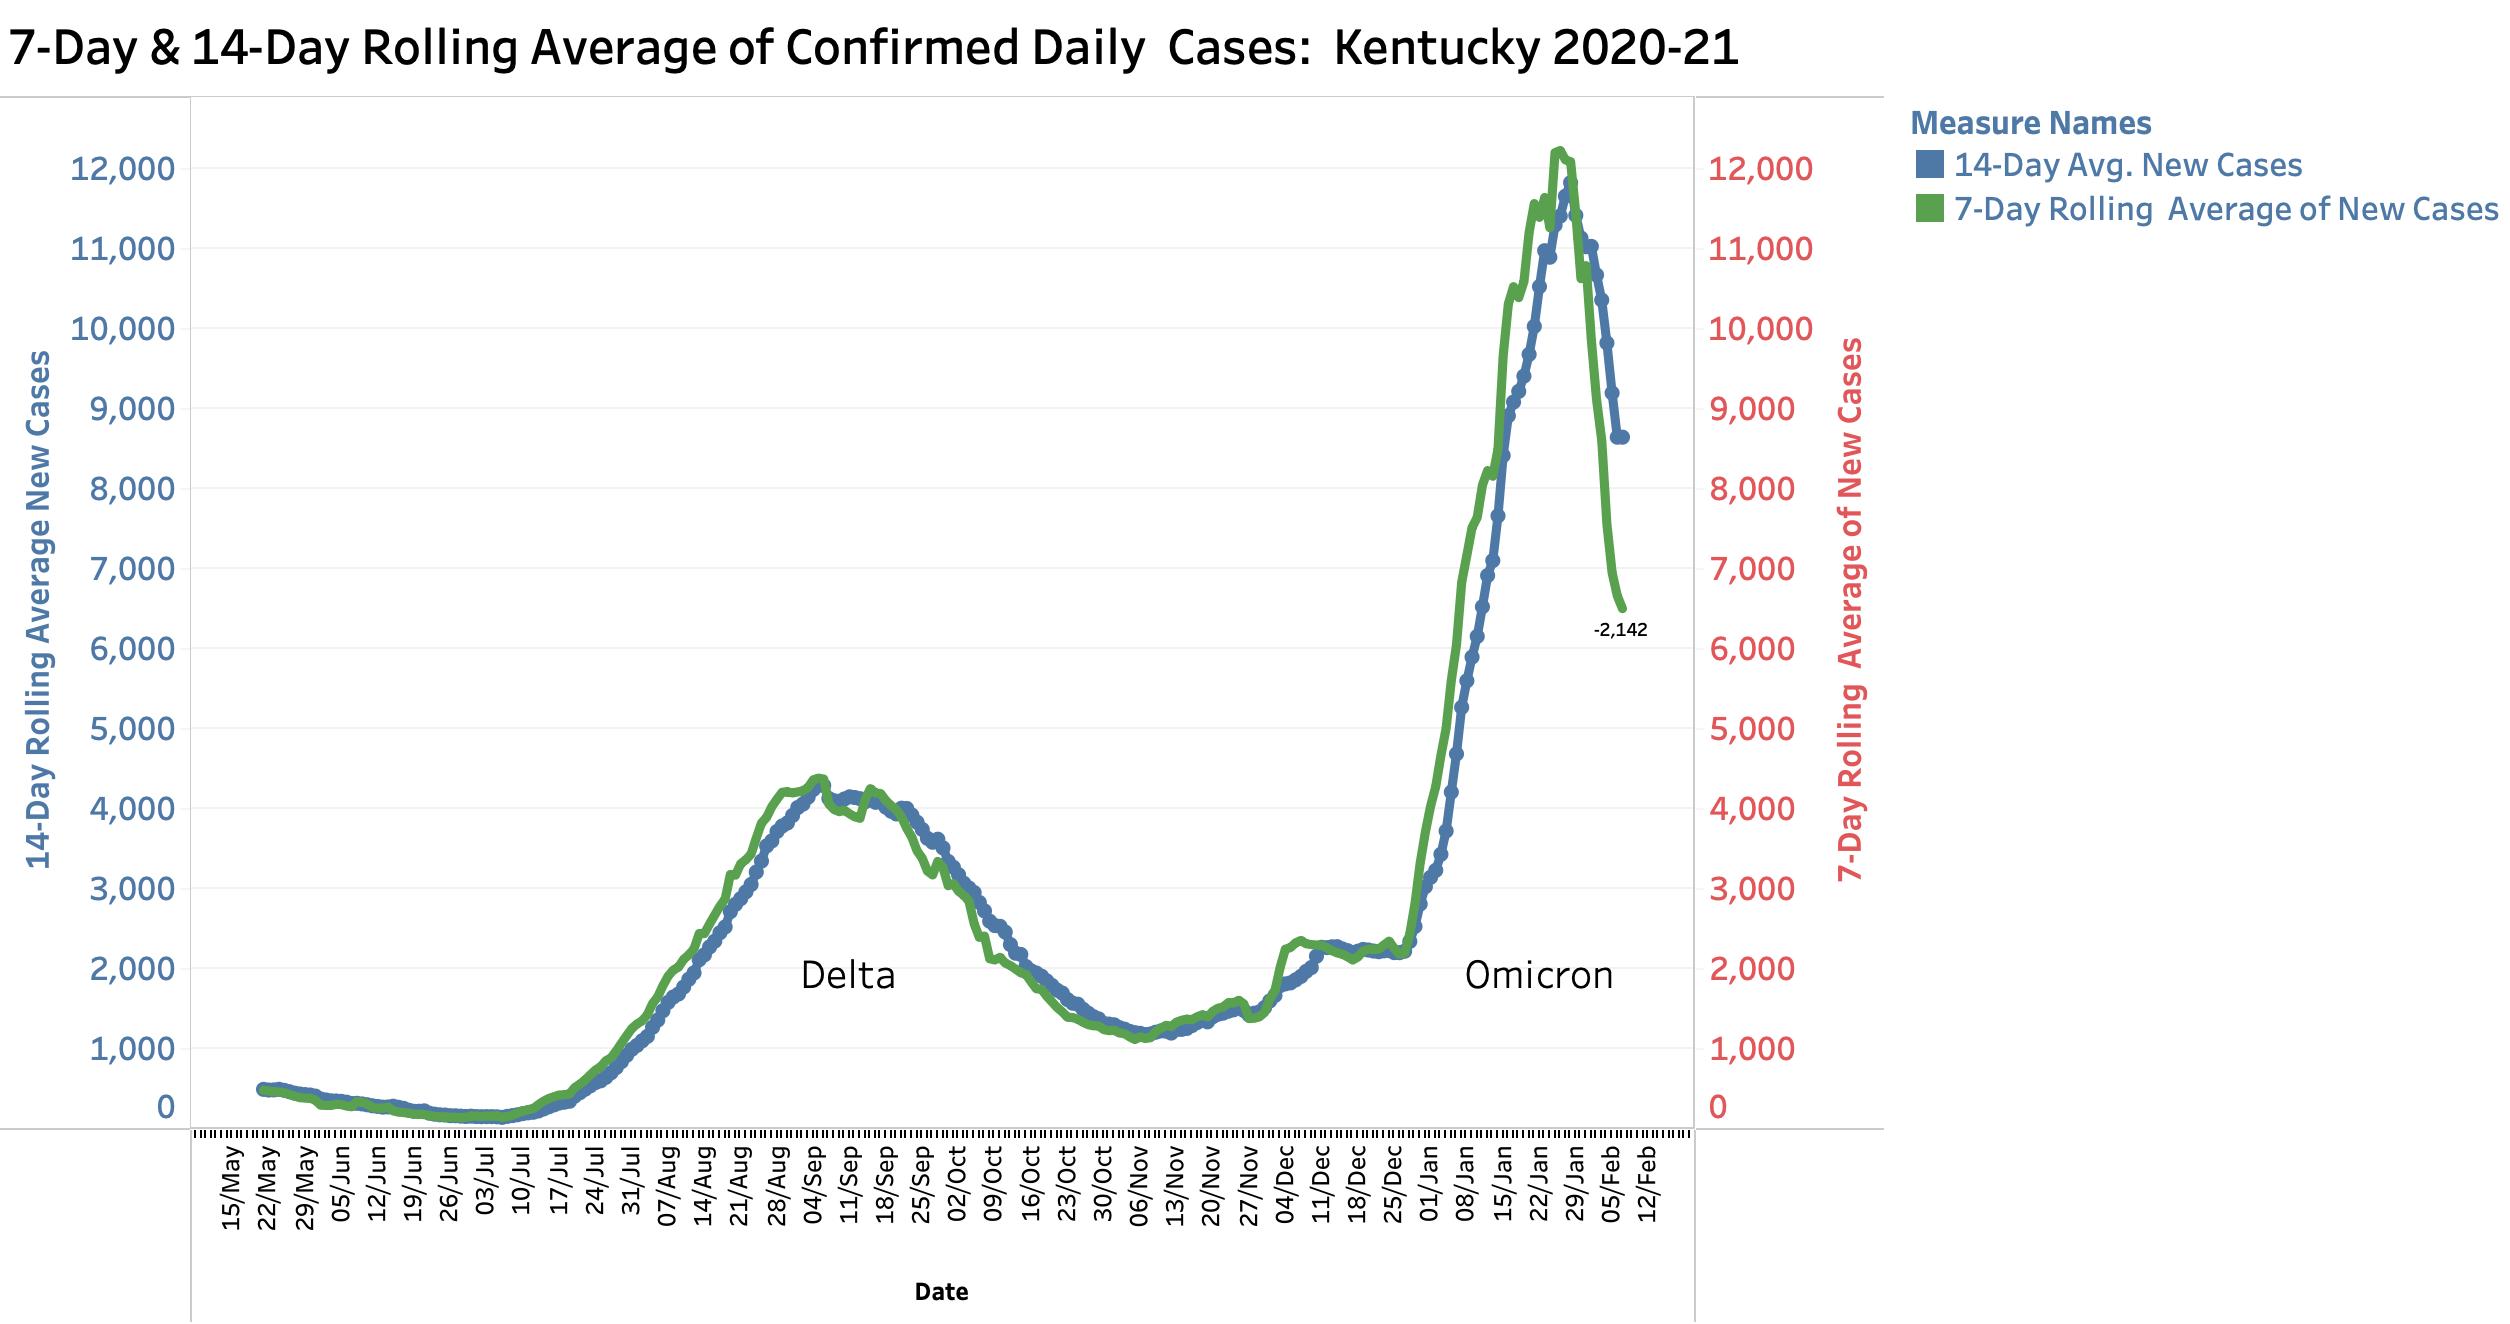
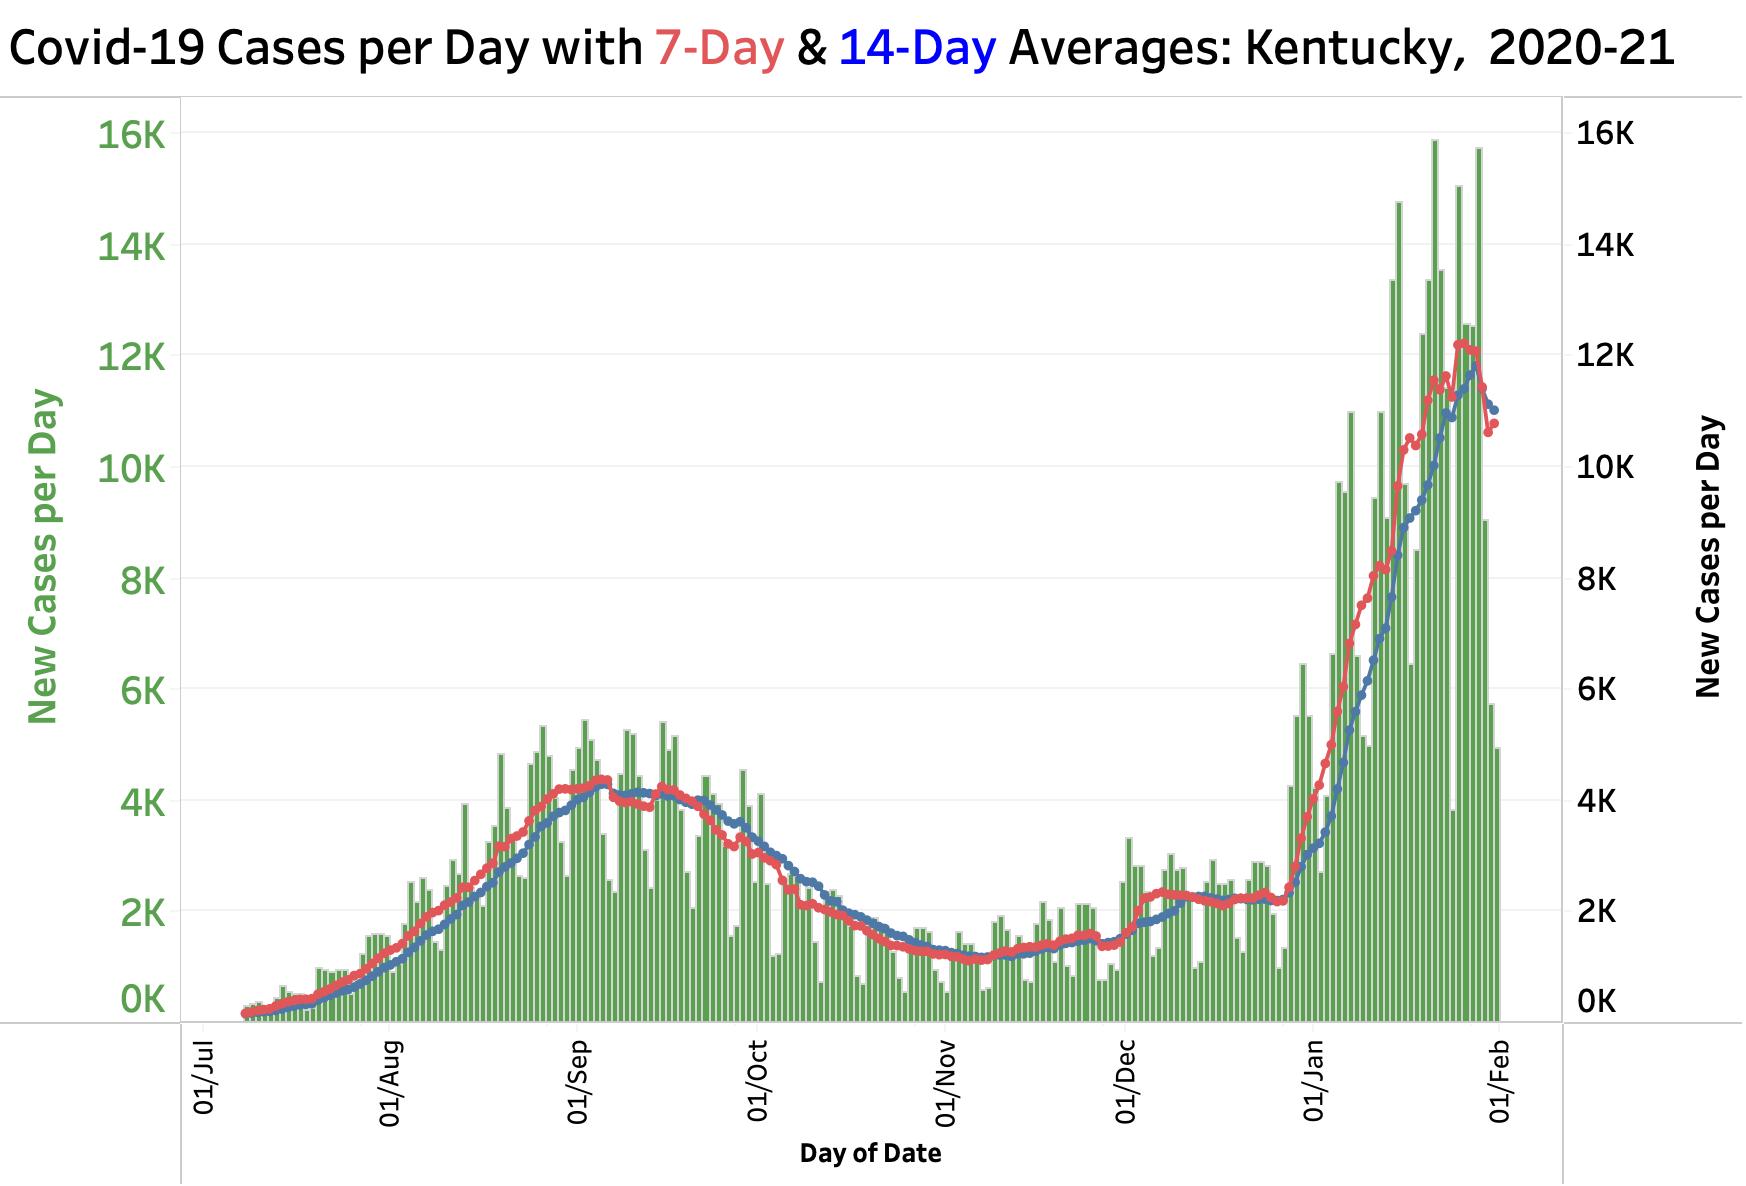
Friday’s announced number of 4693 new cases of Covid-19 continues its sharp and trend downwards from a peak of 16,130 on January 21st. The 7-Day average of 5502 net new Omicron cases peaked at 12,226 on January 26. The last time the 7-Day Average was this low was on January 5. The Commonwealth’s 20.1% Test Positivity Rate of electronically reported cases on Friday is following the same trajectory as cases. Both these metrics remain at higher levels than at any point during the four months of the Delta variant surge last summer and fall. Friday’s case count is likely underreported because the number of tests reported that day and the Friday before were relatively low but the trend is undeniably strongly downwards. How much lower and at how fast remains to be seen.
Reported daily Covid-19 cases (Fridays) with overall 7- and 14-Day averages.
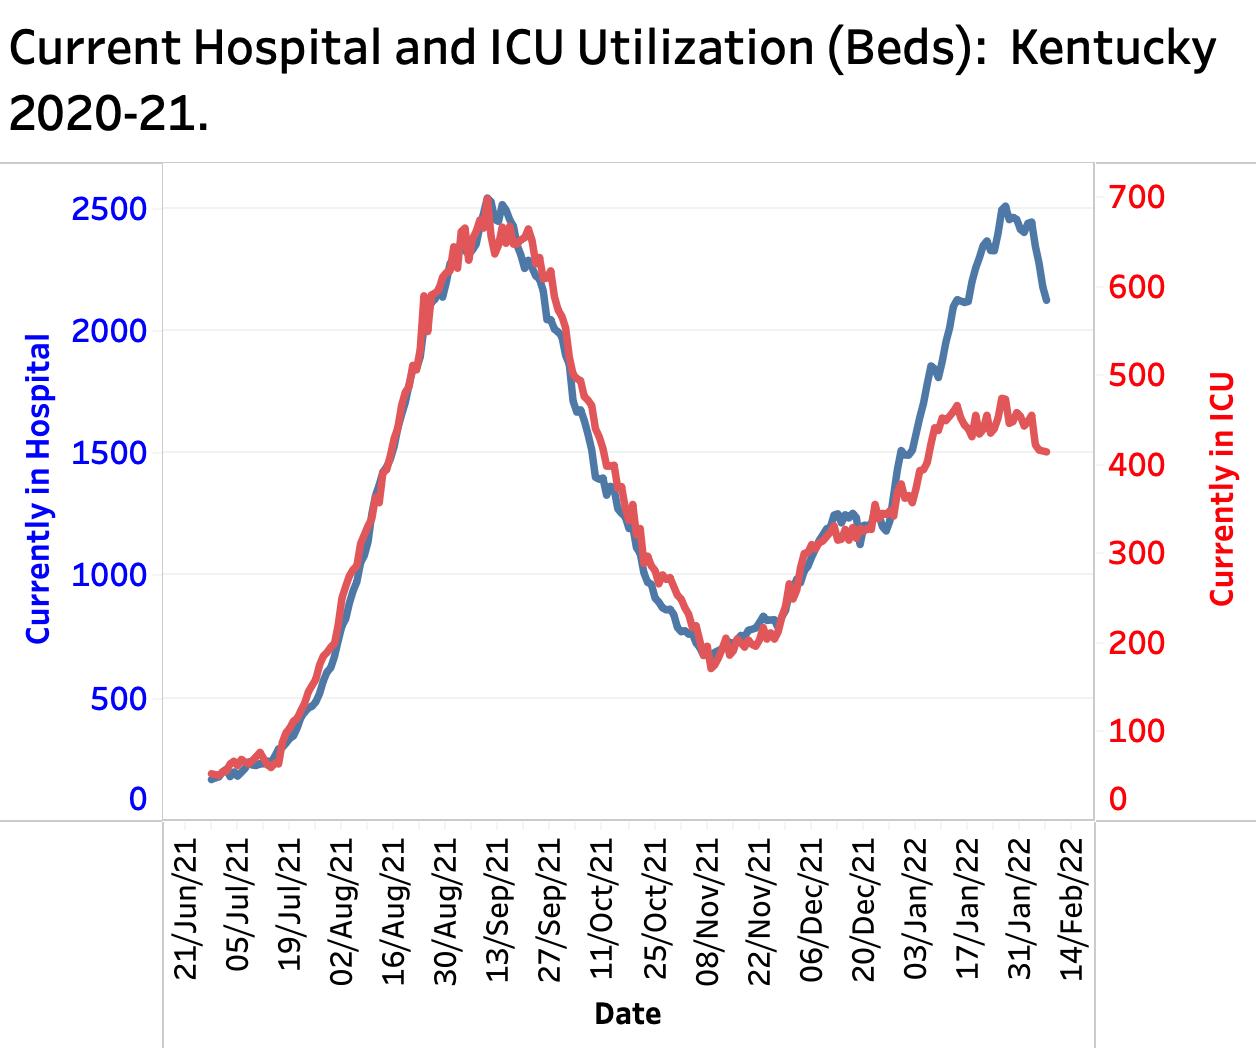
Reported Hospital and ICU censuses seem also finally to be decreasing but I have no feel for what it is like to be either a patient or a healthcare employee in our hospitals. Not all are in the same shape. Deaths may be ticking up but based on past ability to track Covid-19 deaths in a timely manner, it will likely require several months for an accurate picture to emerge. I will try to tackle the matter of hospitalization with or for Coronavirus at some future time. It is not as simple as some make it out to be.
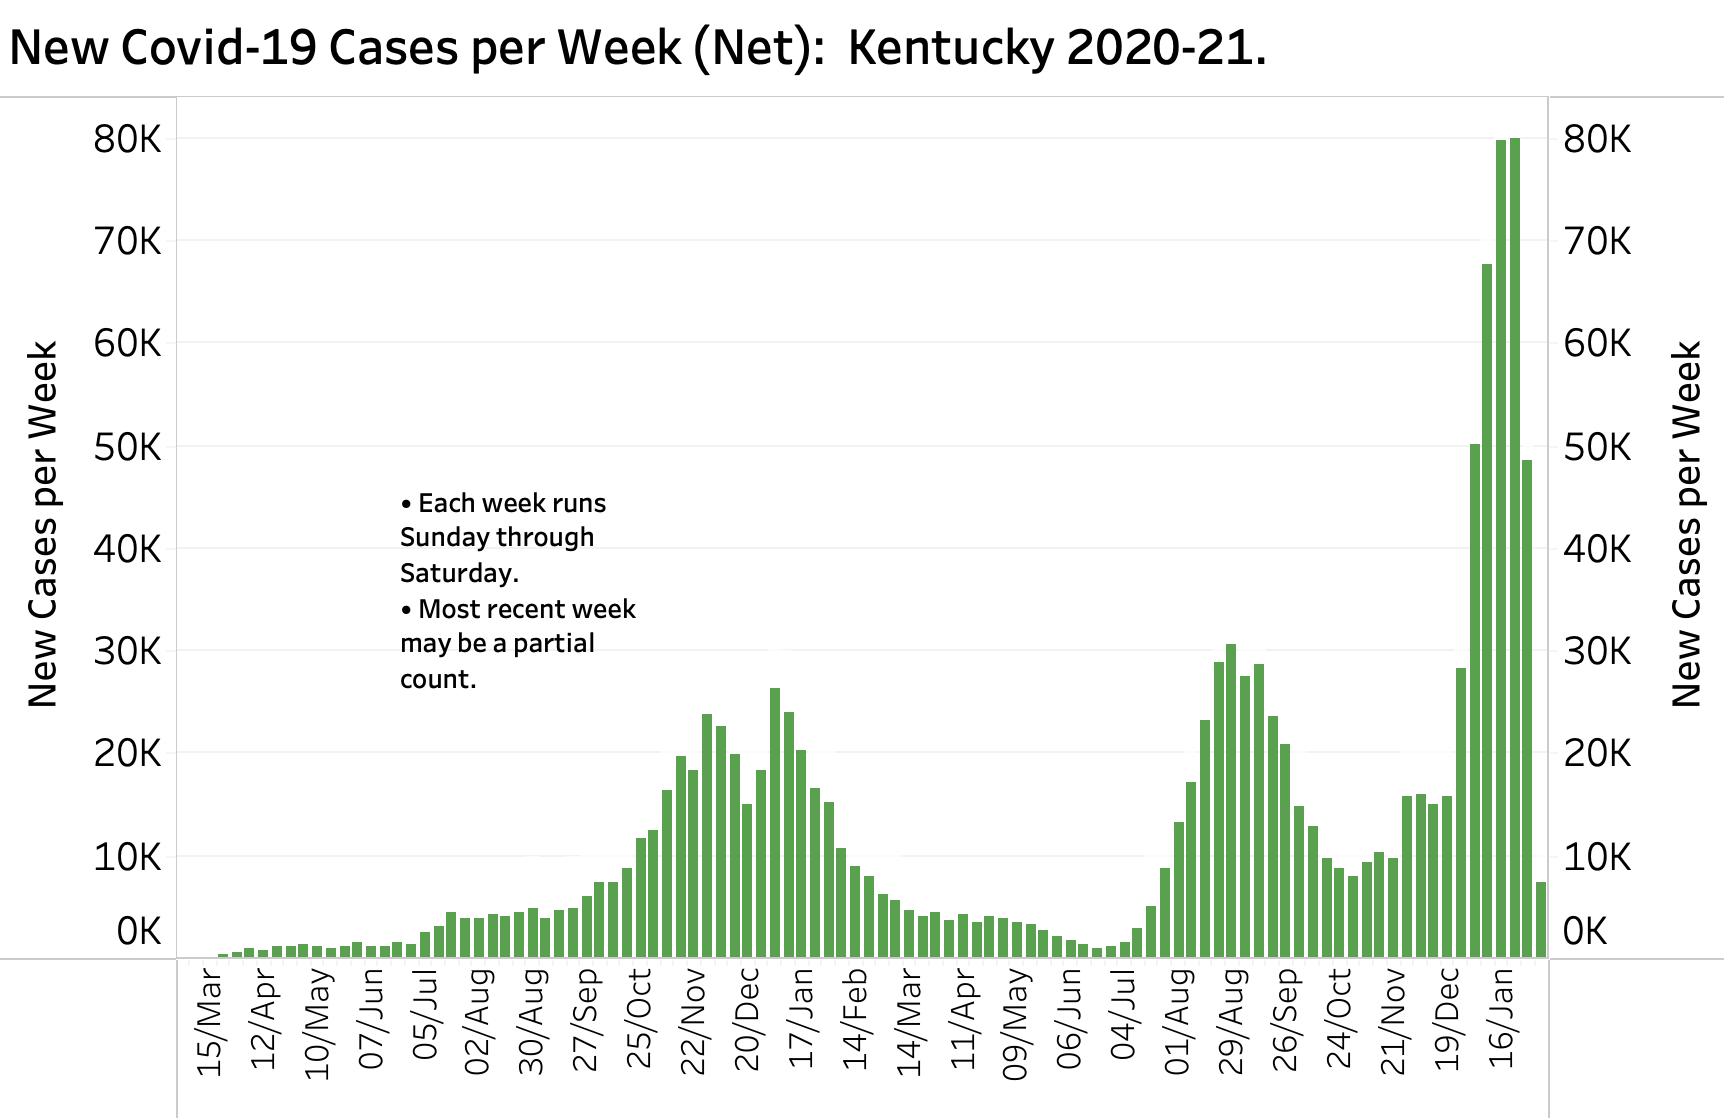
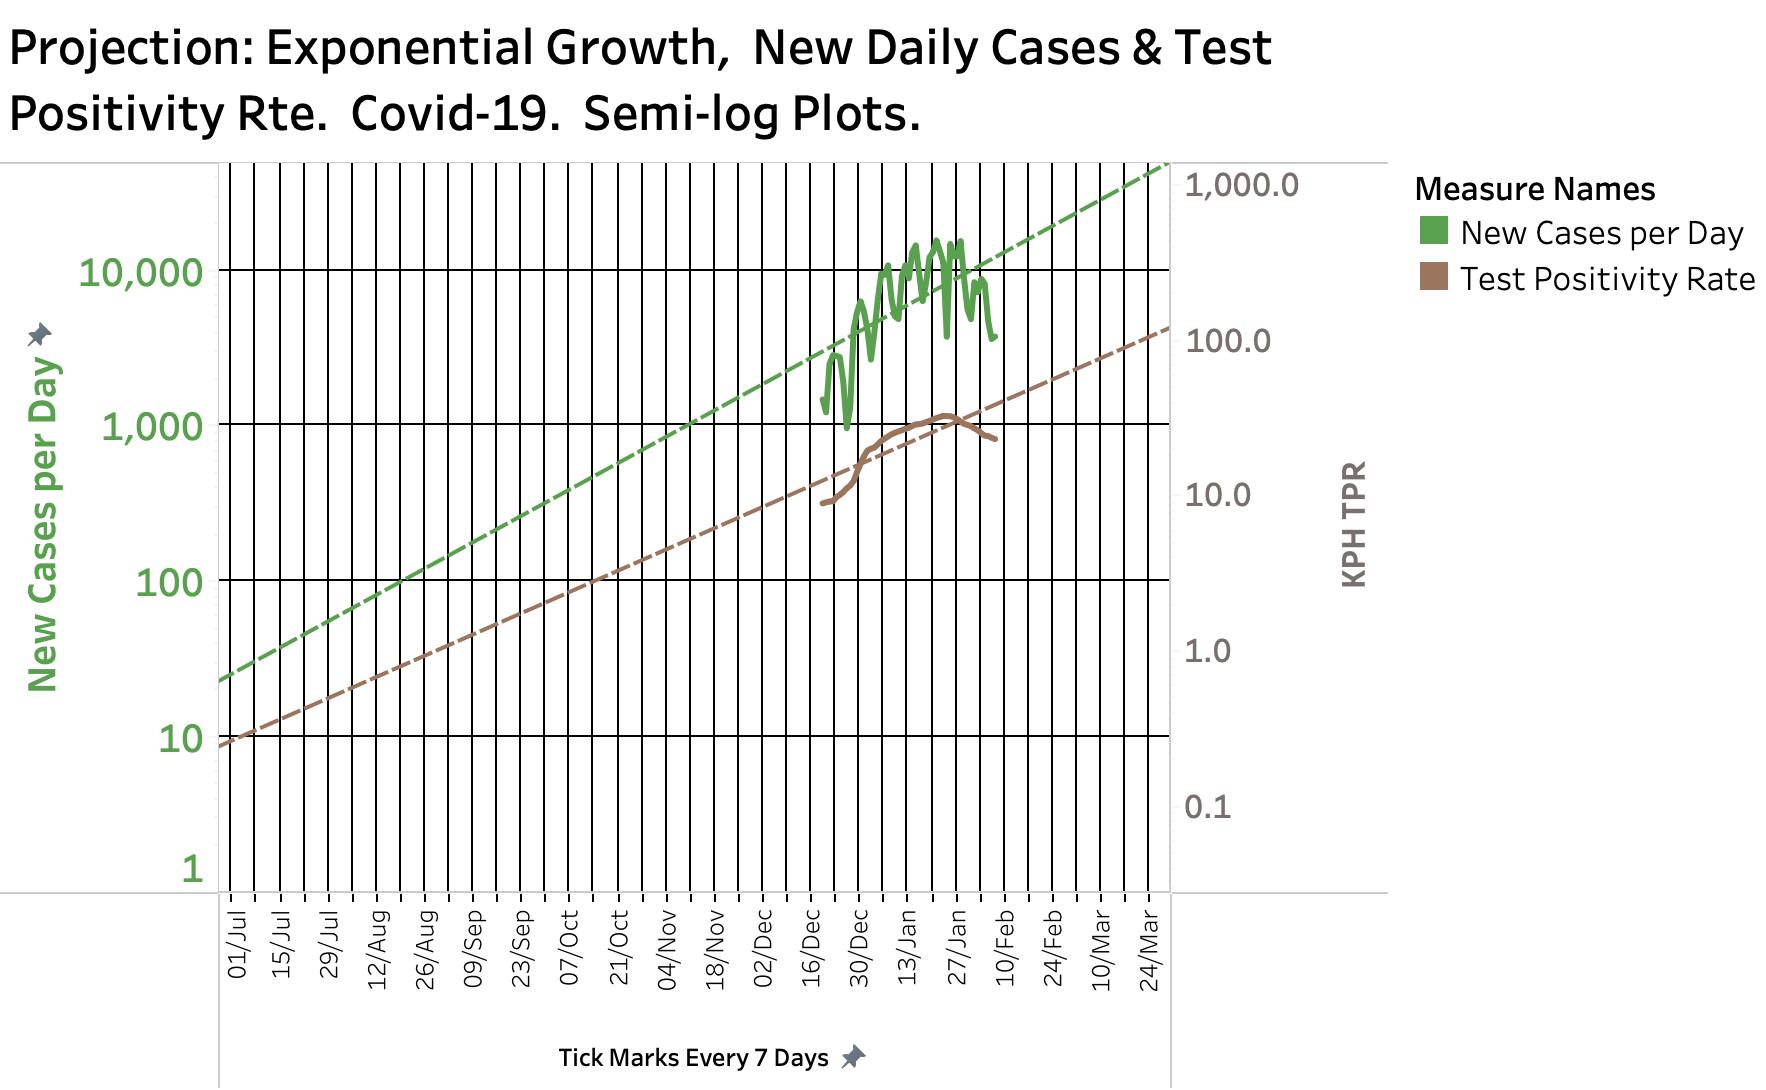
Saturday’s numbers reported yesterday evening round out the previous week with the addition of this week’s Sunday and Monday. All the indicators KHPI monitors are moving in the right direction– in some cases at record breaking speeds. Last week 48,664 net new cases were added to the running total of Confirmed and Probable cases– 61% of the number of cases the week before and lower than the previous 4 weeks of the Omicron surge. Including data through yesterday, the daily count on every individual weekday is lower than each of the preceding weeks. The 7-Day average of new cases is falling below the 14-Day average much faster than at any time in our epidemic with a difference on Saturday of 2142 cases. Semi-log plots of net cases show a negative rate of epidemic expansion. The test Positivity Rate is falling sharply as well.
Number of cases for Saturdays.Cases since Dec 19 and Feb 7, Semi-log Plot. Trend is now downwards!How broad will be the base of the epidemic curves?
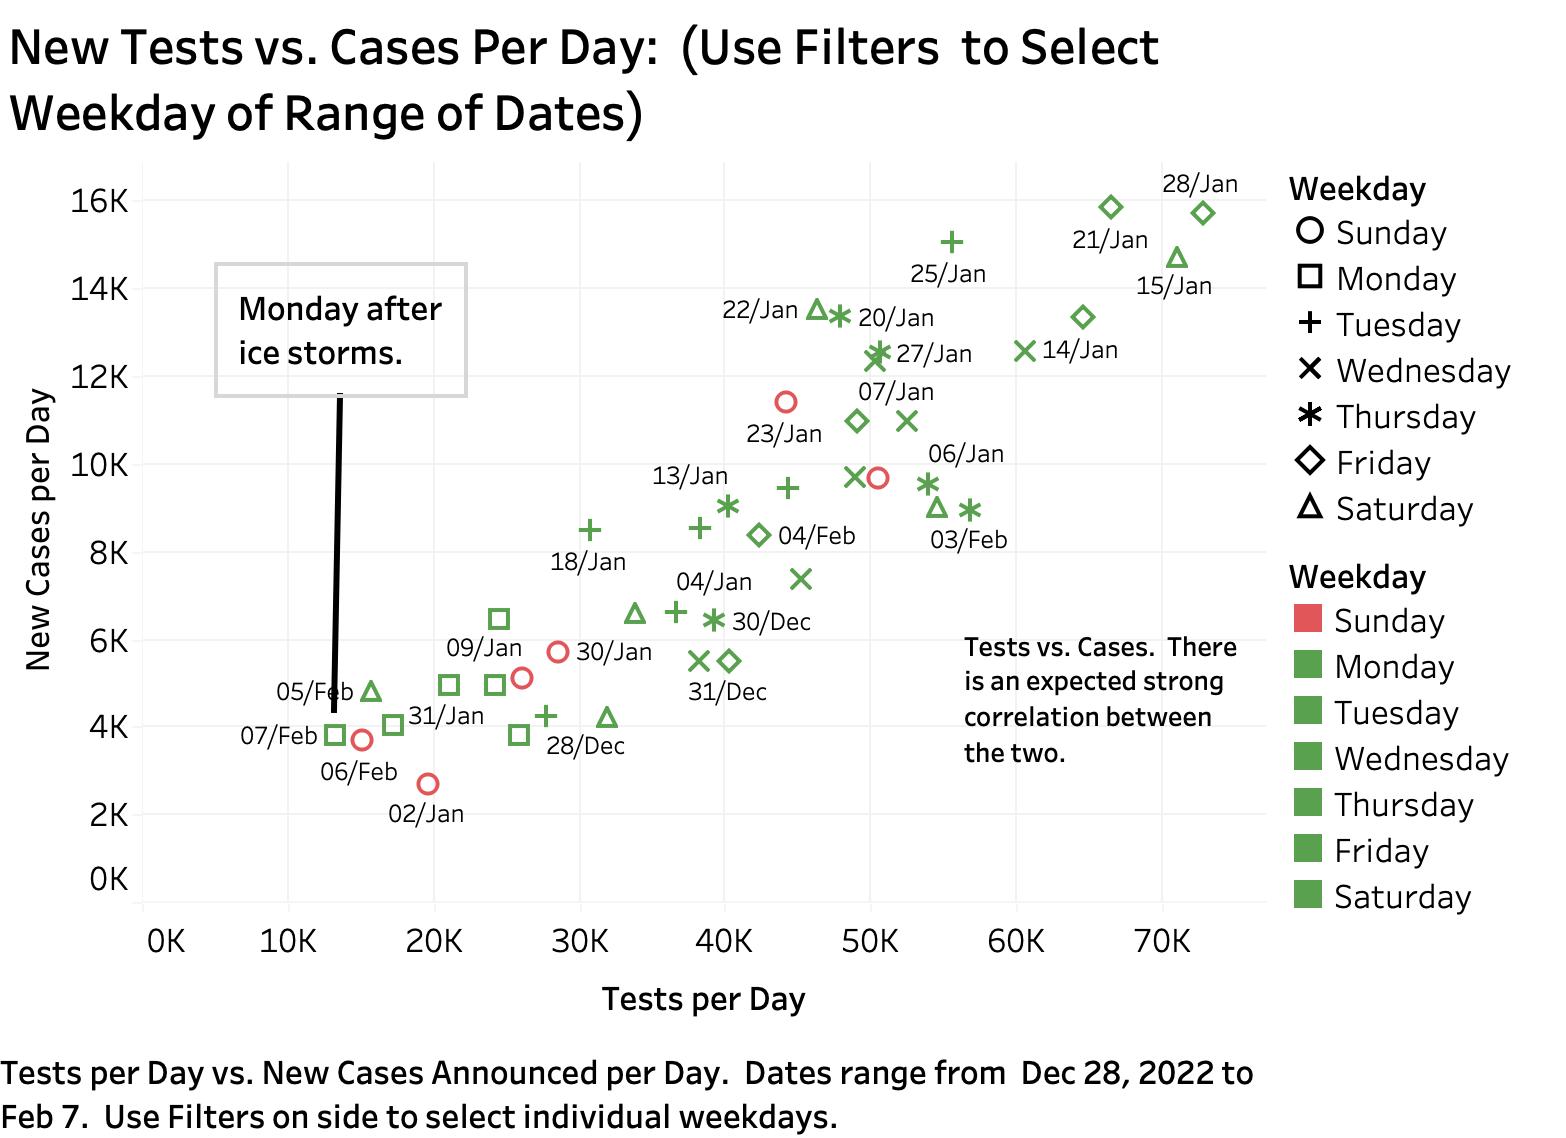
All this is good news, except all the indicators indicate epidemic activity higher than at any time in the previous 691 days of Kentucky’s epidemic! Furthermore, Governor Beshear shared a reservation yesterday that coming on the heels of last week’s severe ice storm, that the collection, analysis, and reporting of data may have been disturbed in the direction of undercounting cases. This is a legitimate concern. If no tests are reported, there will be no confirmed cases, only clinically ‘probable’ cases which would be similarly vulnerable to external circumstances if not more so. In the new KHPI data visualization below, it is clear that for the duration of the Omicron surge so far, that there is a strong correlation between reported numbers of tests done (of all types) and cases per day. Noteworthy is the demonstration that the number of both tests and cases reported last Sunday and yesterday were among the very lowest in the Omicron interval. [You can interactively explore the data for this visualization and other metrics on KHPI’s Tableau Public website.]
Hospitals? It is too soon to be very definitive about hospital utilization. While some ticks downward appear in the various graphs of hospital, ICU and ventilator censuses, those numbers are also vulnerable to both to weekends and ice. Reports of the rest of the week will give us more confidence. We expect hospitalizations will lag cases.
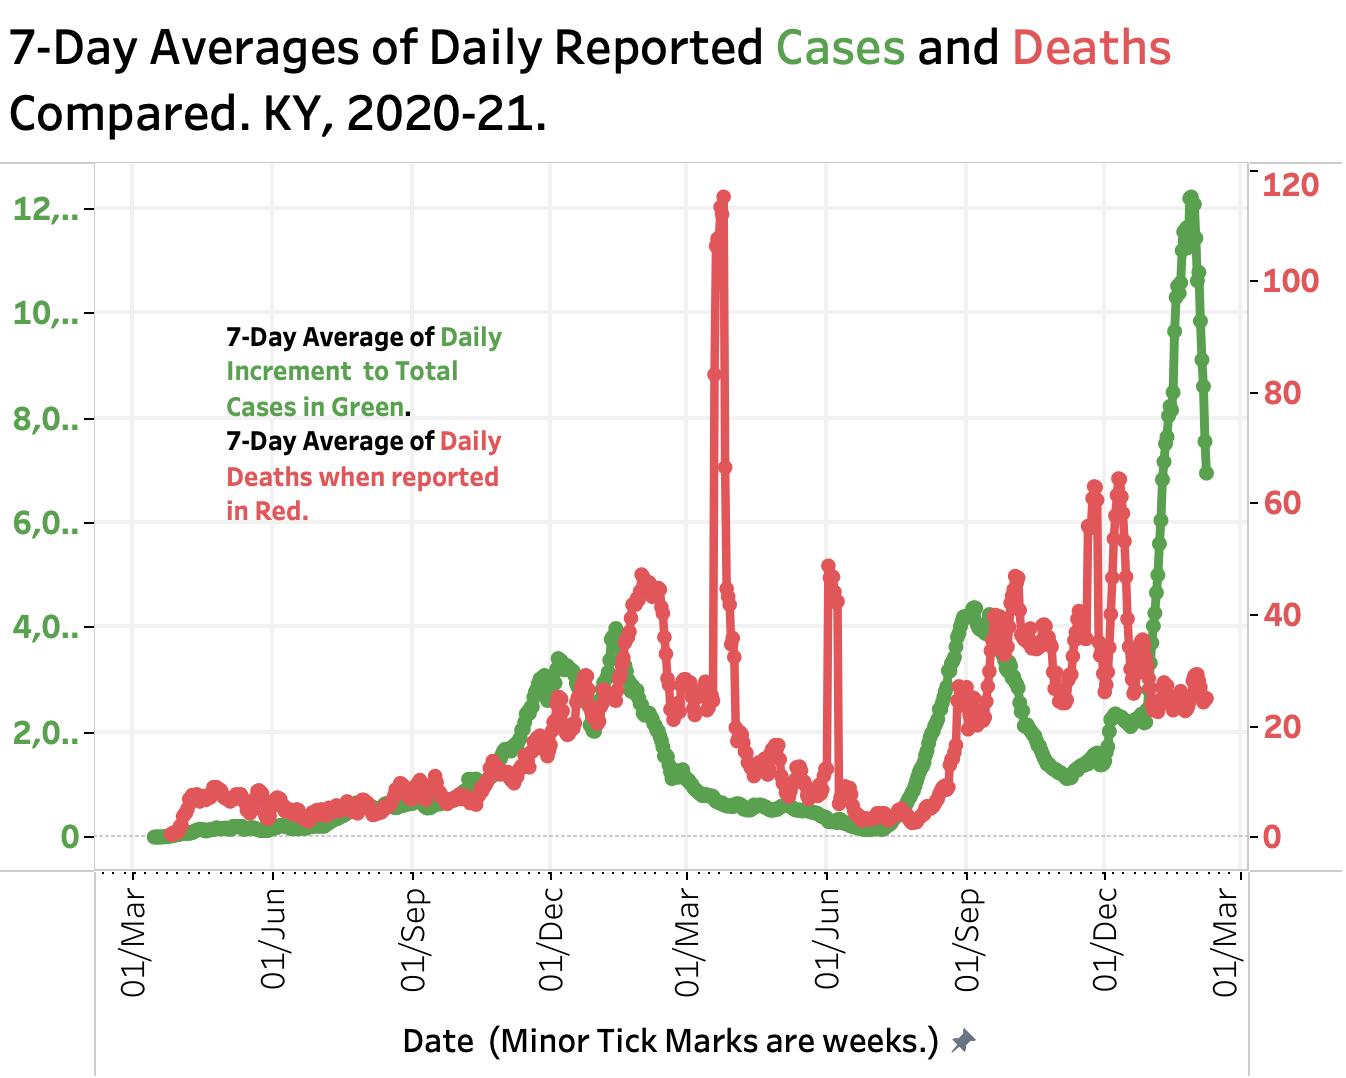
Deaths? Little can be predicted with any confidence about deaths even though we believe the Omicron is not as immediately dangerous as Delta or Alpha. So far, the ability to identify, classify, and report Covid -19 deaths in Kentucky is quite unpredictable and eratic. The visualization below shows catch-up spikes of deaths extending well into the intervals between epidemic spikes. If history constrains the future, it will be months before we see the total impact of Omicron in death or disablility.
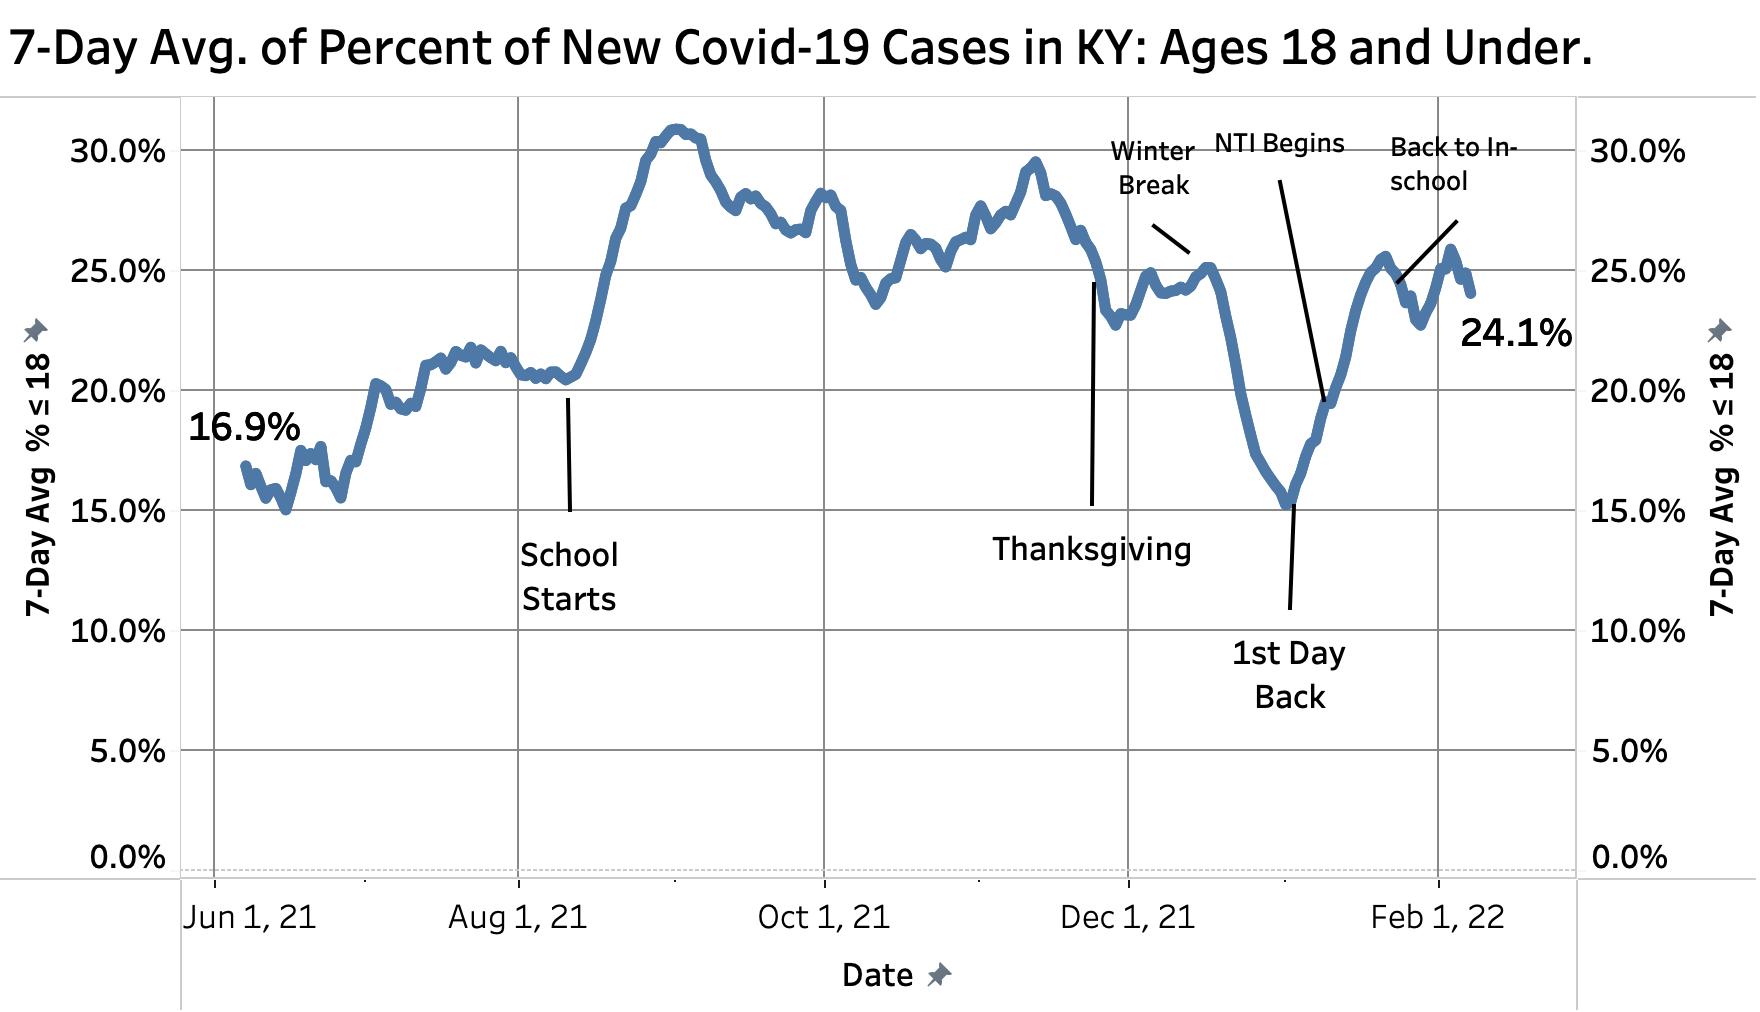
School Age? Bad weather and tornados keep students out of school. In recent weeks some 25% of all new reported cases were in individuals 18 and under. This age group comprises the least vaccinated people in the state. When school started last fall, more than 30% of all pre-Omicron cases were in this age group. We should expect Omicron and any variant with that is even partially as contagious to run rampant in schools. Without appropriate attention and precautions, having kids in schools could be comparable to hosting chickenpox parties! Balancing risk against physical, emotional, and social damage from disease is one of the most difficult societal decisions we have to make. It cannot be done rationally without good data and confidence in our ability to do something effective and worthwhile. In our disjointed general and public health systems, such data has not been at hand. Single nationwide healthcare system anyone?
As emphasized in my last article in this series, while peak maximums are intrinsically attention-grabbing, the area under the curves (or put another way, the sum of all the weekly cases in the interval of interest) is of equal or greater clinical or societal importance than peaks. We already know that the Omicron variant is one of the very most infectious/contagious viruses known to man. What happens next when most of us Kentuckians have been exposed/infected remains to be seen. The downward curve of 7-Day average new cases may turn out to be as broad at the base as was Delta. An as-yet unnamed cousin or sibling variant strain I dub Omicron Jr. is currently displacing Omicron Sr. in some European countries. How soon or how bad the variants of the future will be is unknown and unpredictable. We will feel reassured that Omicron is receding and let down our guards as we have before. I personally hope to travel to Europe this spring, but I am glad we paid extra for cancel-for-any-reason travel insurance. The willingness of individual members of our society to protect each other is not something that can be “modeled.”
Peter Hasselbacher. MD Emeritus Professor of Medicine, UofL 8 February, 2022
The number of new cases of Omicron infection and the positivity rate of new tests have clearly been diminishing this past week. This has not yet had an impact on overall need for hospitalization or ICU utilization. The Omicron variant has infected more people than did its Delta variant cousin and is not yet done with us!
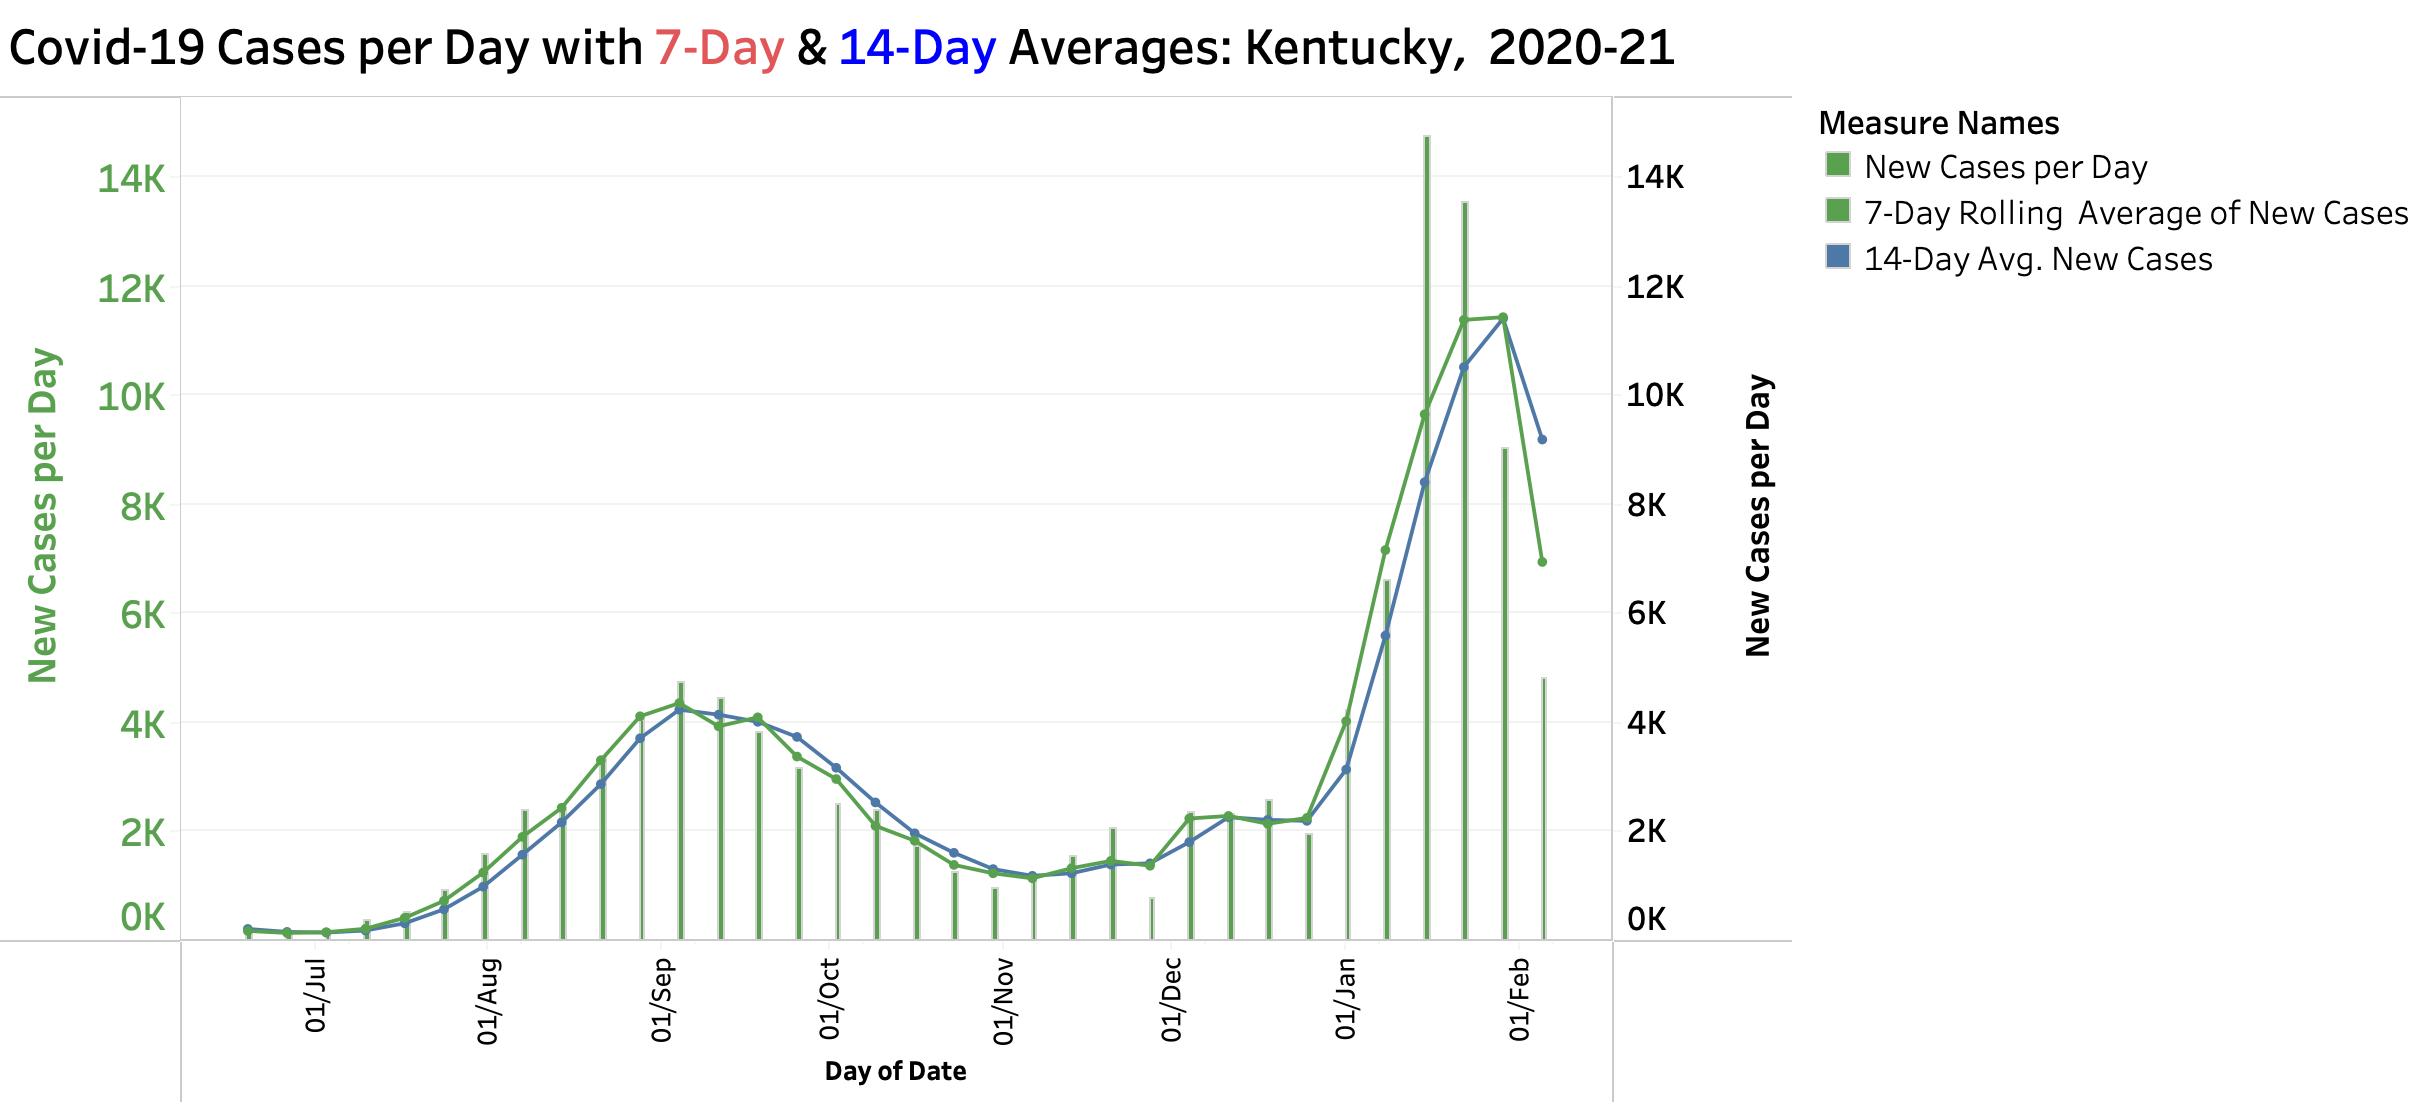
New Cases. The release of 3 days’ worth of Omicron’s epidemic numbers Monday evening solidified the observation that, as averaged for the state of Kentucky, the expansion of newly recognized cases is receding. All of the new-case metrics I described last week are headed decidedly in the same favorable direction. Both the 7-Day and the 14-Day average of new cases have been falling for the last 4 or 5 days, held back only by the very high number of cases the week before. The 7-Day average is now less than the 14-Day average by a large margin not seen since last October.
New Daily Cases Covid Infection with Averages. As of 1/31/22.
Sunday and Monday counts have been historically the lowest in any week and still are. This week began with 5821 and 4950 announced cases respectively– a far cry from the 12,000 to 15,000 cases of recent weeks. Significantly, both Sunday and Saturday’s new case numbers are much lower than for those days of the previous 2 weeks. This weekday comparison is something relevant we can monitor as this week unwinds. Further evidence of a slowing of epidemic spread is that the rate of new cases may no longer be expanding exponentially as judged by analysis of logarithmic plots.
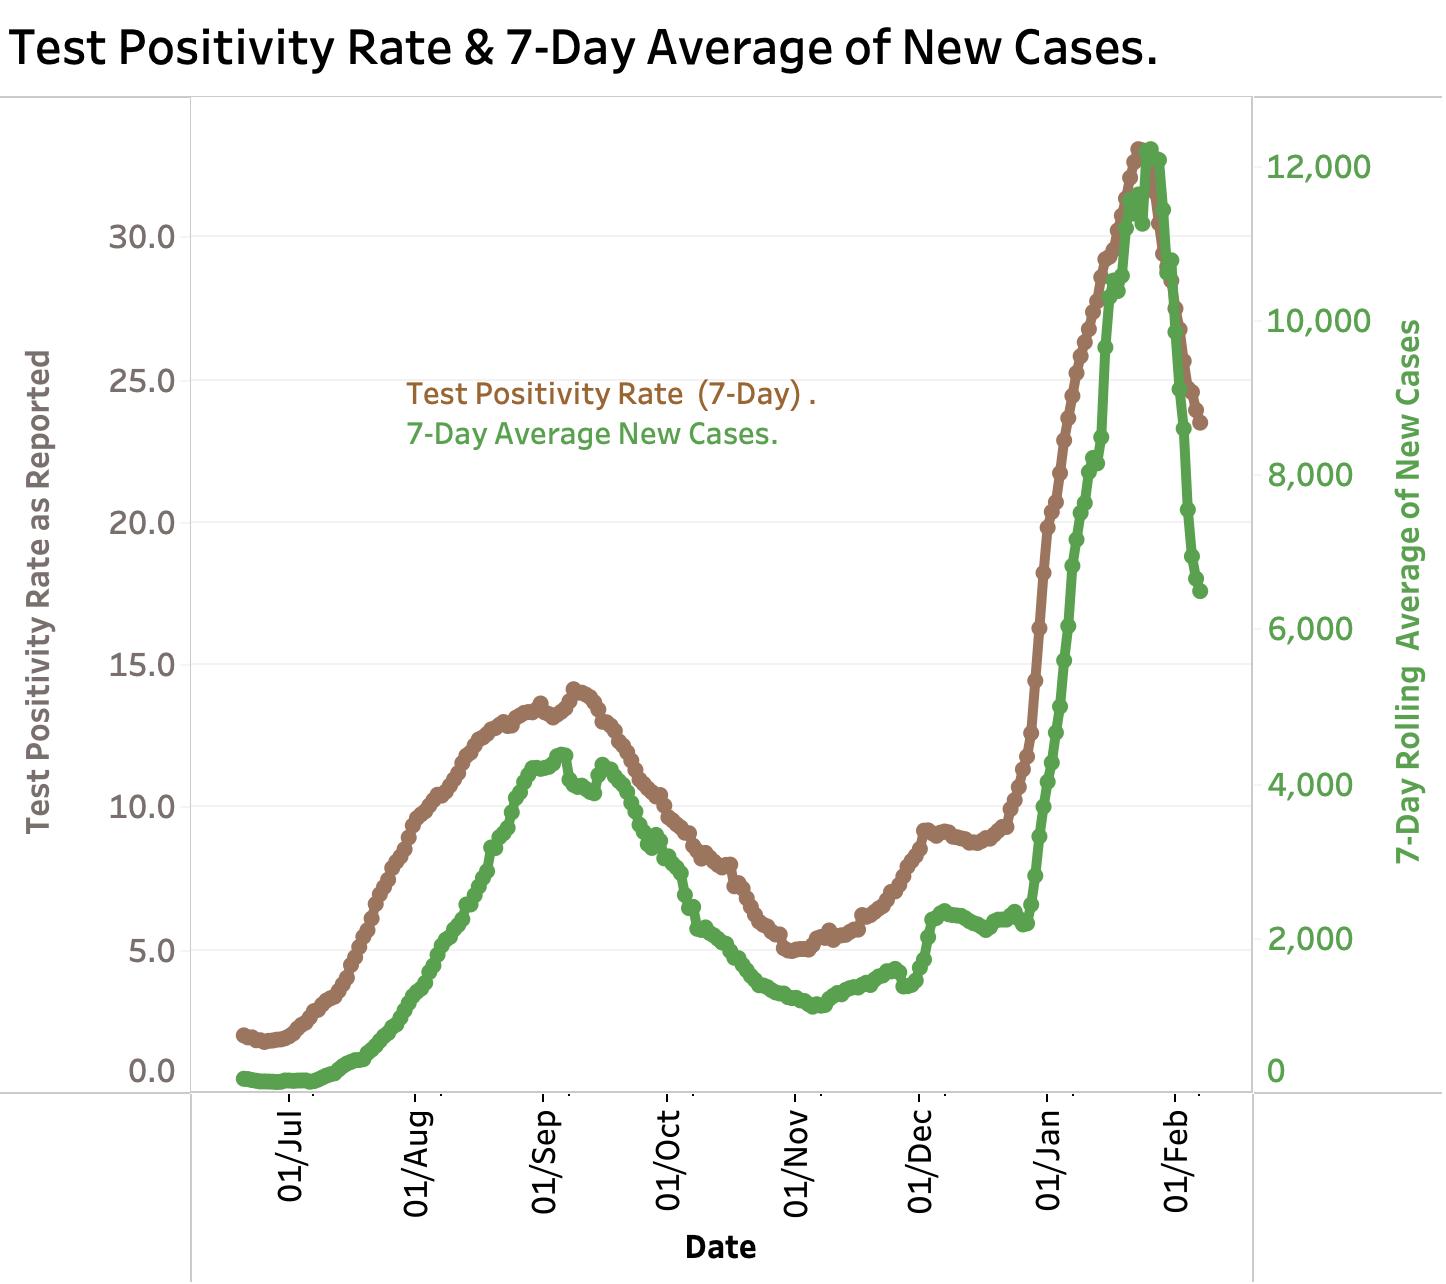
With two days remaining in the full week of data that averages out day-to-day volatility, there are signs that this surge in our epidemic may be turning the corner. The metrics to watch for new cases outlined in my previous article appear to be stabilizing or even reversing. Nonetheless, new cases remain high. Yesterday’s announced new cases of 12,756 is within the same range as the past two weeks. The 7-Day Average of new cases remains above 12,000 but is no longer rising as dramatically as before. The 7-Day New Case Average is still higher than the 14-Day one. Both are still rising, but the gap between them has been decreasing. The doubling time is getting longer. Case counts on individual weekdays (i.e., a Thursday) are no longer predictably higher than previous ones. Yesterday’s Thursday was actually lower than the previous Thursday. Wednesdays have had the highest counts in most weeks, but for the last two weeks they were similar. Unless things change a lot in the next two days, this past week will have had fewer new cases than the last. The majority of new cases are identified through testing. For the last 8 days, the Test Positivity Rate as calculated by the KY Department of Public heath has been progressively decreasing– albeit slowly. This epidemic has had many unexpected twists and turns, but perhaps crossing our fingers and going the right things is making a difference again– even if only sooner than otherwise would have happened in the hands-off mode.
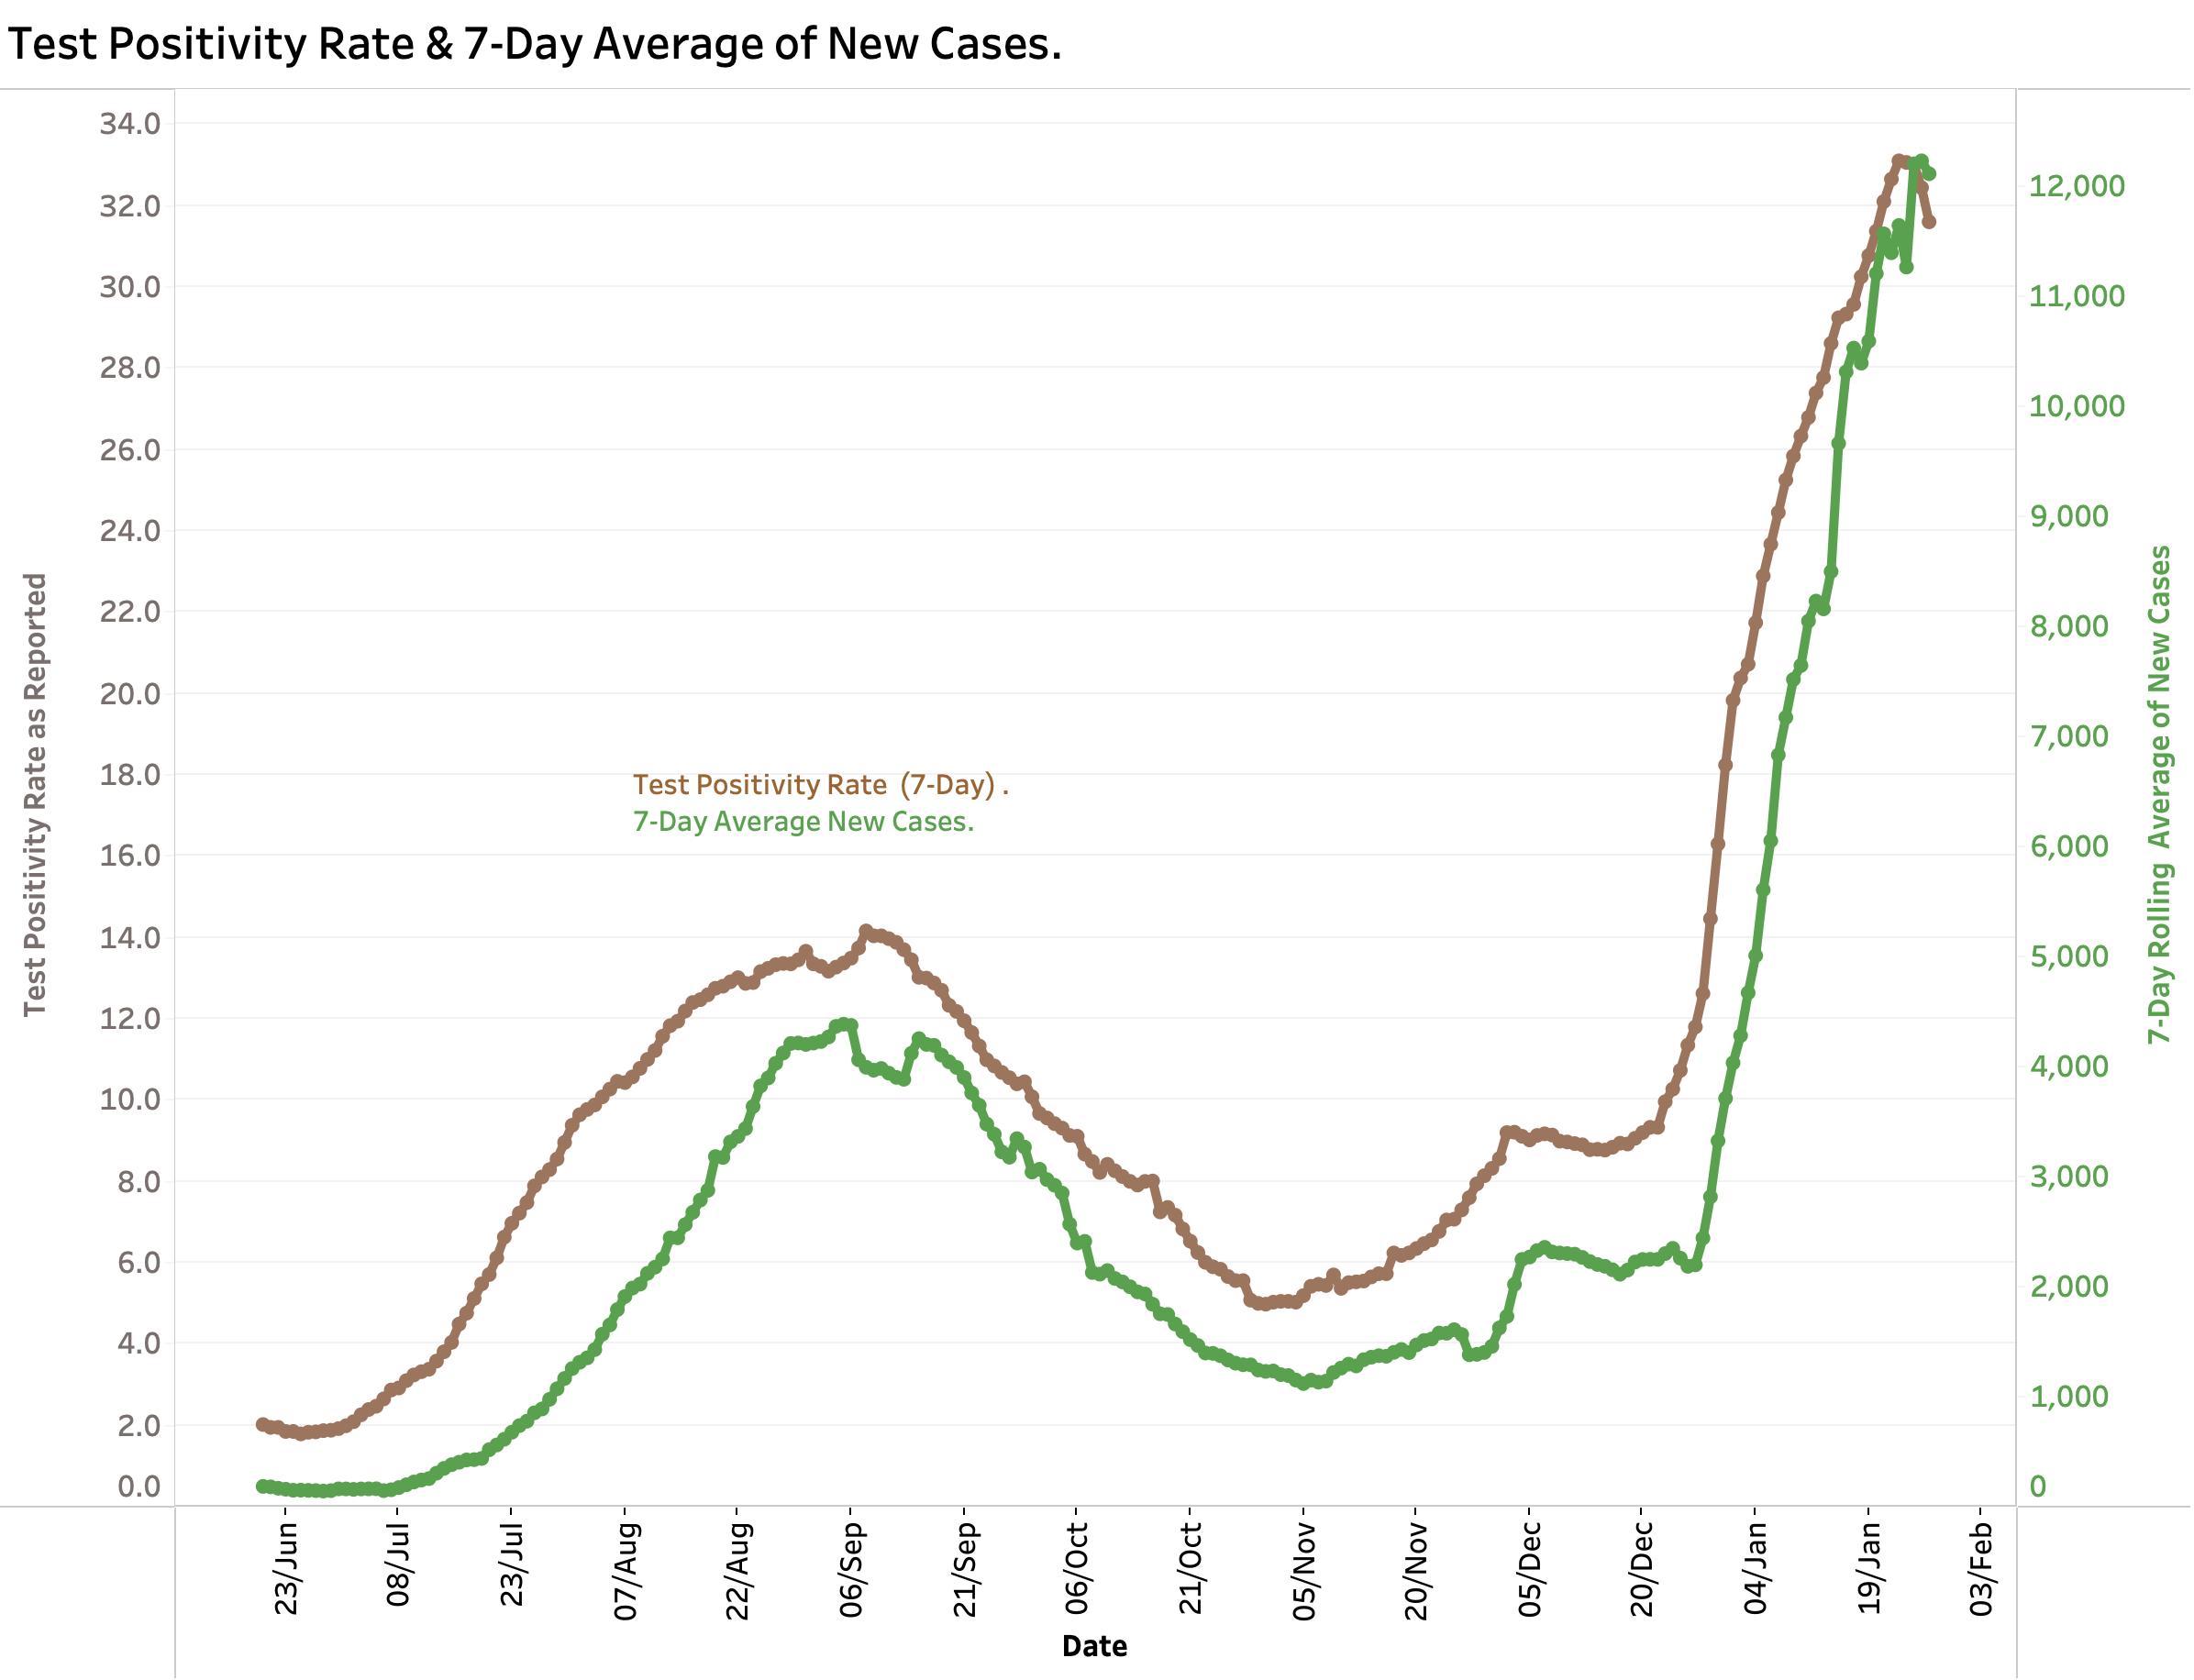
7-Day Avg. New Cases and Test Positivity Rates as of 2-27-22. KHPI.
Two of the major sequelae of viral infection– hospital care and death– are predictably delayed. Current hospital census is still rising and is as high as it was for the Delta variant. Intensive care utilization has been rising also, but not to the same degree as for Delta. ICU and ventilator use are currently tracking together. The need for ventilator support is associated with a high mortality, and we should not be surprised if the number of reported deaths will increase. The current 7-Day average of deaths of 39 is the highest of the past 12 days.
You can view data updated through January 27 on KHPI’s Tableau Public Website. I will update it with Friday’s numbers and prepare a fuller illustrated report when week-ending Saturday’s data are available. For now, cross your fingers on both hands and keep doing your part to break us out of this cycle (and to prepare for Omicron Jr).
Peter Hasselbcher, MD Emeritus Professor of Medicine, UofL January 28, 2022