Is Kentucky’s Decrease in Covid-19 Cases Real or Artifact of Labor Day Holiday?

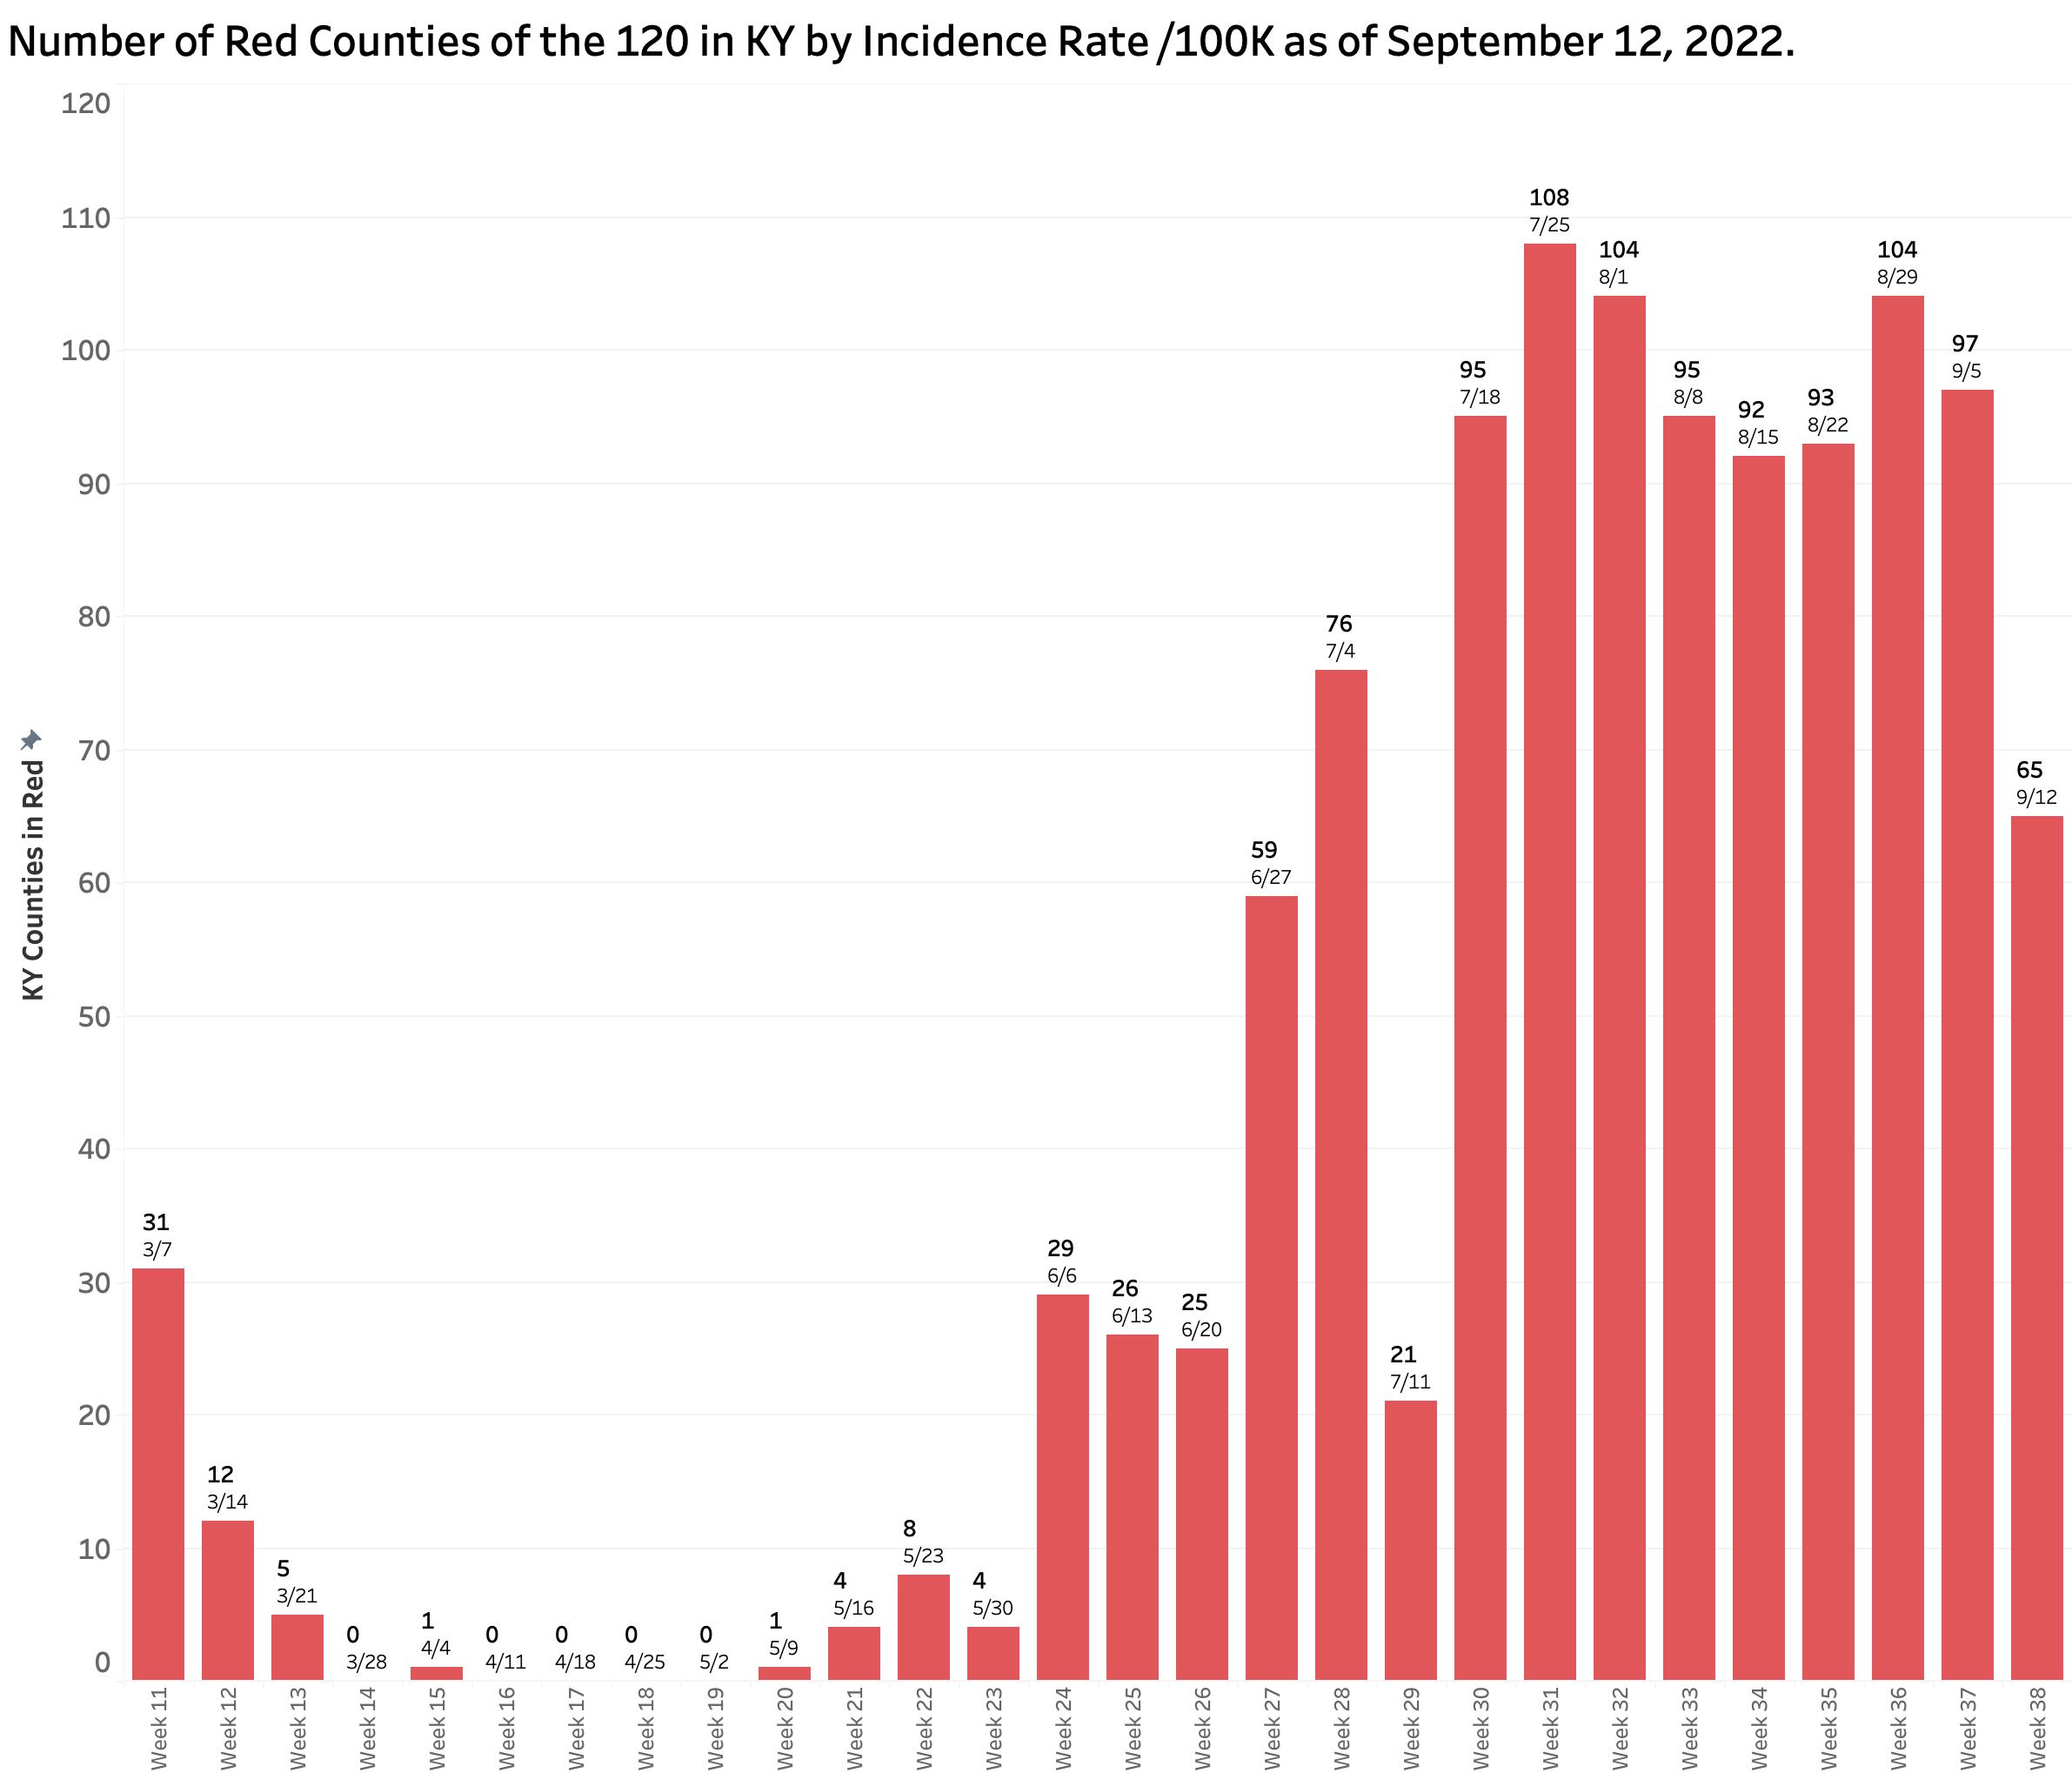
Yesterday’s COVID-19 update from Frankfort reported a considerable drop in the number of new cases which is necessarily reflected in a decrease in the overall incidence rate.  However, the September 12 report spans Labor Day weekend and the subsequent following week. The drop in identified and reported cases was not matched by a decrease in hospitalizations, ICU/ventilator utilization, or deaths.  The number of Kentucky counties mapping as red (high) with current incidence rates of greater than 25 per 100K also fell substantially from 97 to 65 counties, but this measure is also dependent the number of cases identified within the previous 7 days.  While providing a glimmer of good news, confirmation of any downward trend needs to be confirmed over the next few weeks. Previous experience in Kentucky’s pandemic demonstrated the impact of holidays and weekends on the state’s ability to provide timely and complete numbers– the Achilles heel of Kentucky’s public heath enterprise constrained as it has been by legislative restriction.

Other independant updates not as prromising.
The New York Times continues to collect and analyze a more extensive set of data. Currently, the nation as a whole is in the middle of a gradual decline in new cases. The Times’ assessment of the pandemic in Kentucky reveals a devastating picture.  Among all 50 states, DC, and the territories, and as of the beginning of this week, Kentucky is reported to have by far the highest case incidence rate at 70 per 100K followed by West Virginia with 42.  Our statewide hospitalization rates are the fifth highest, and deaths the third. With respect to case incidence rates, among all the individual counties in the nation, five of the 10 highest and nine of the 20 highest are in Kentucky. I have no way to resolve the discrepancy between the Times’ numbers and our own, but it remains indisputable that Kentucky’s weekly report does not include very large numbers of cases.  For example, the number of PCR tests done in the last week was 27% fewer than the previous week.  I present illustrative charts below that led me to a conclusion that it is not yet time to declare success.

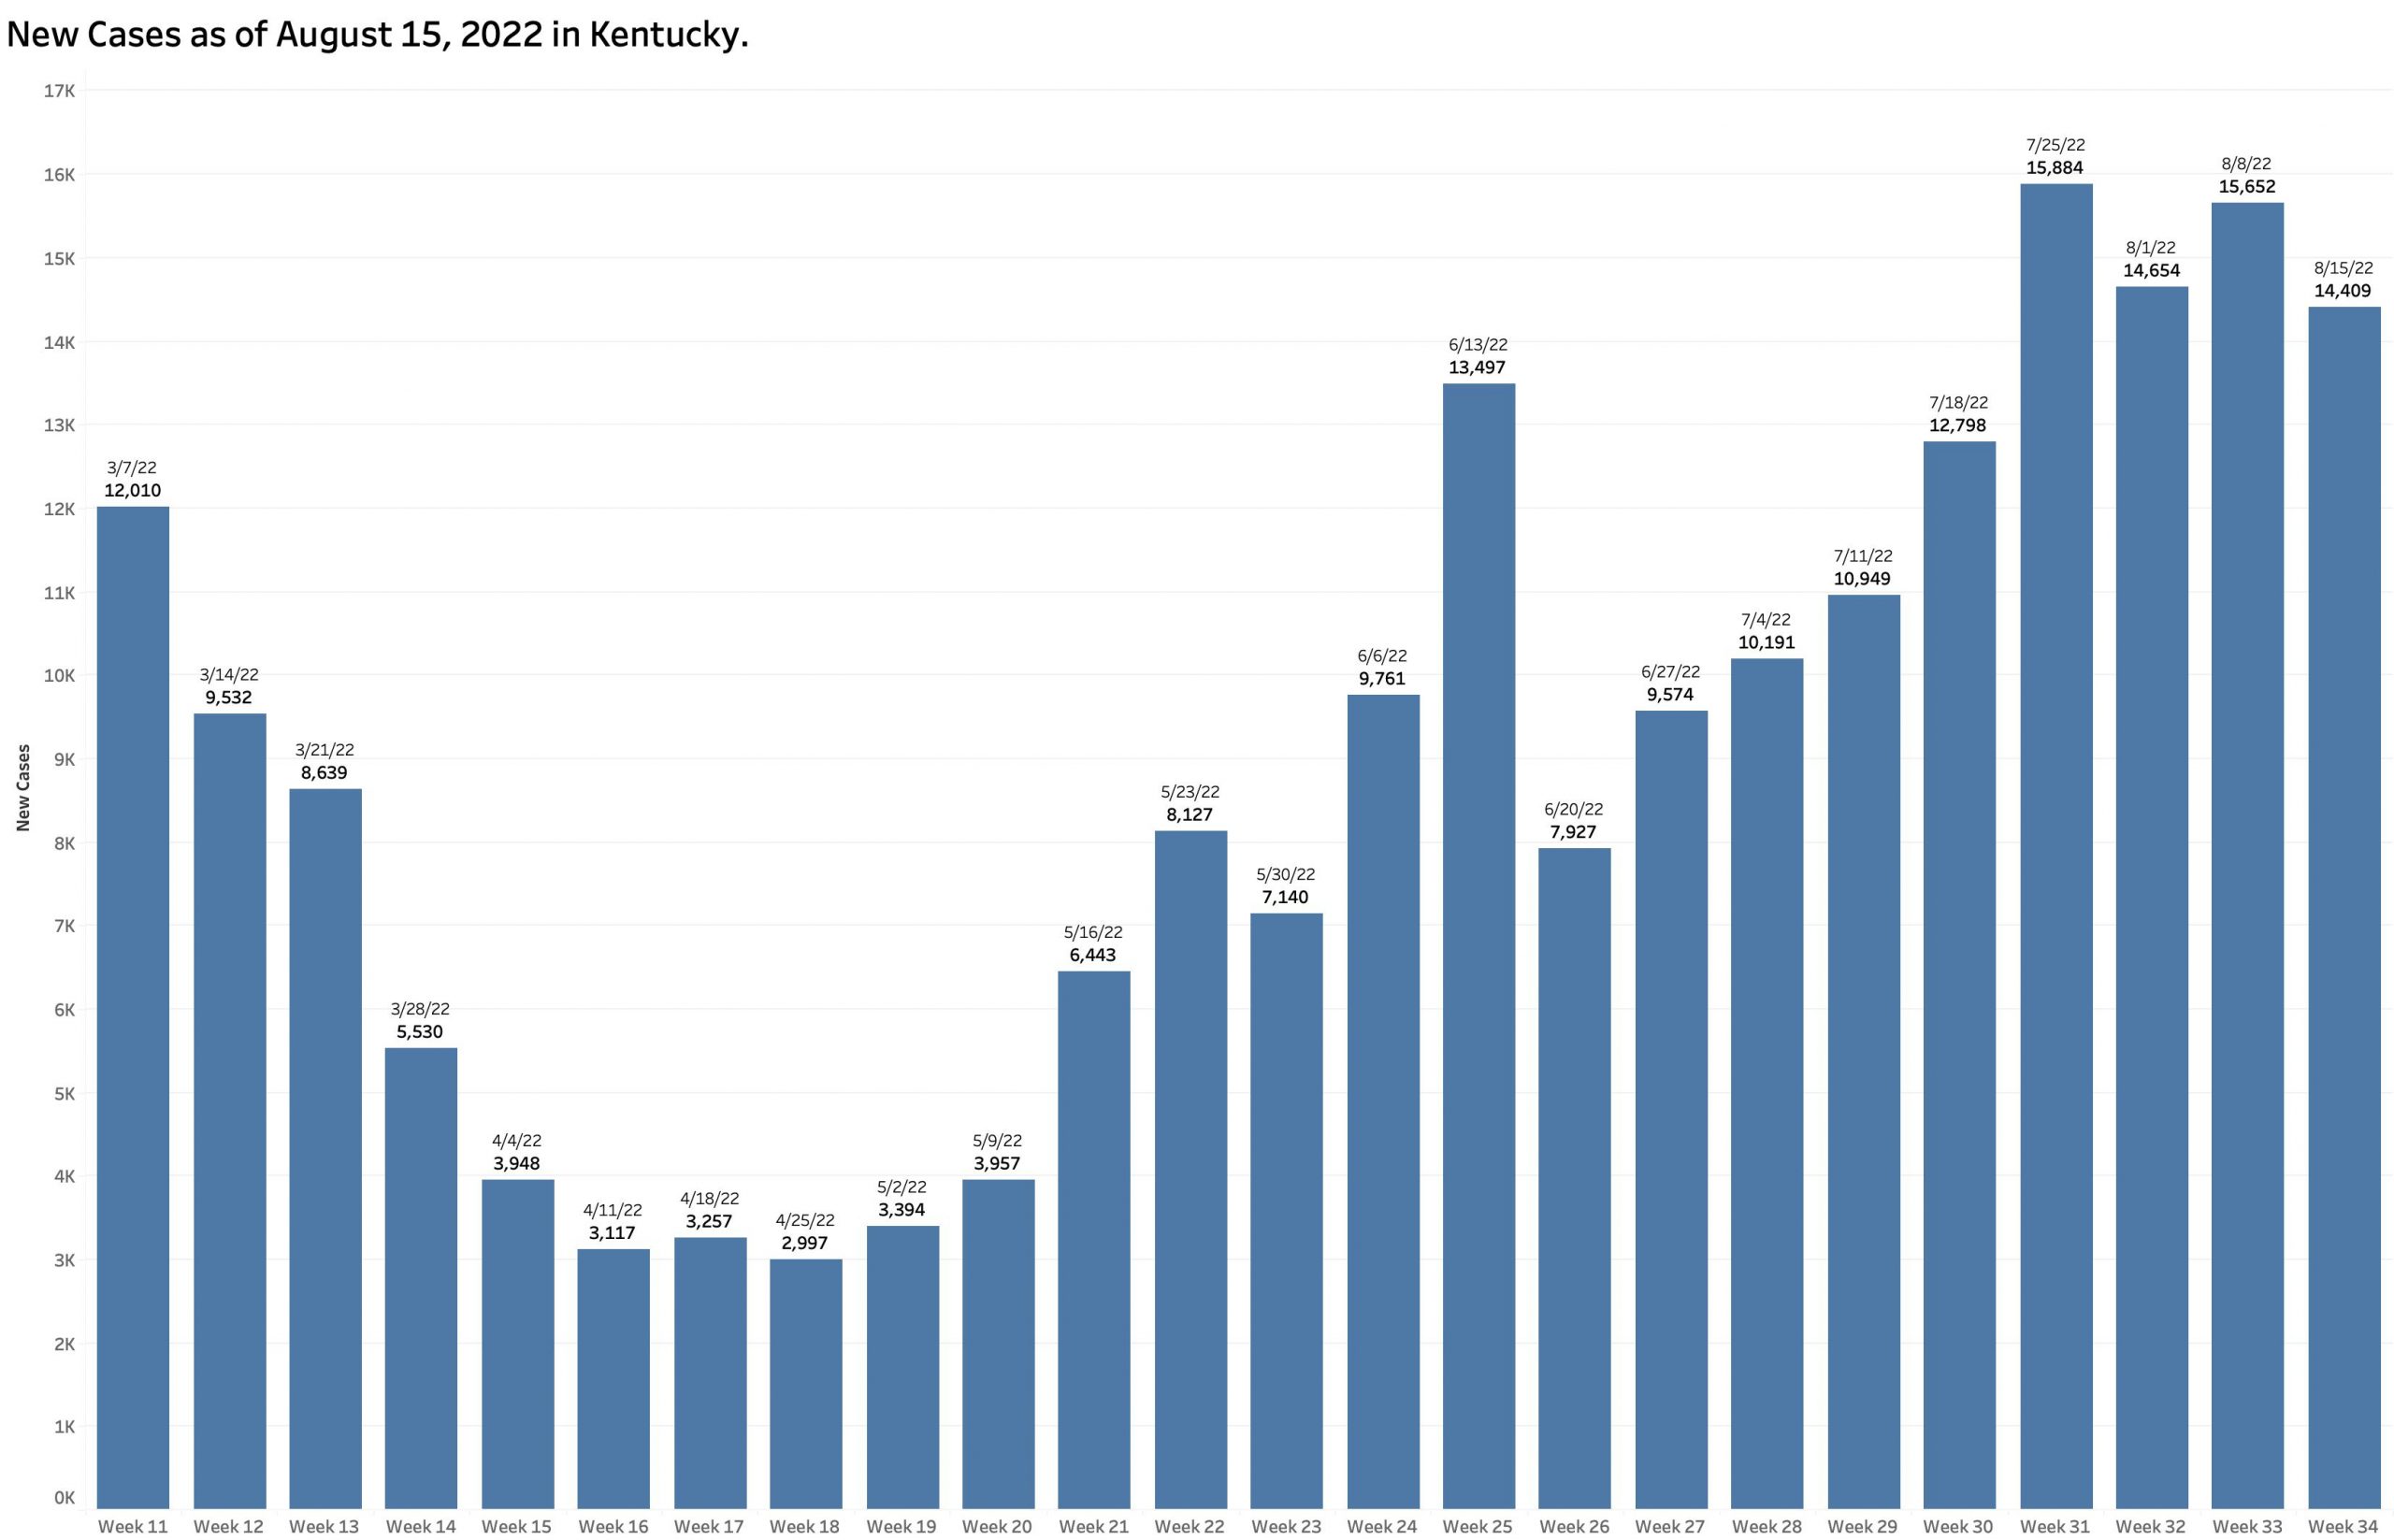
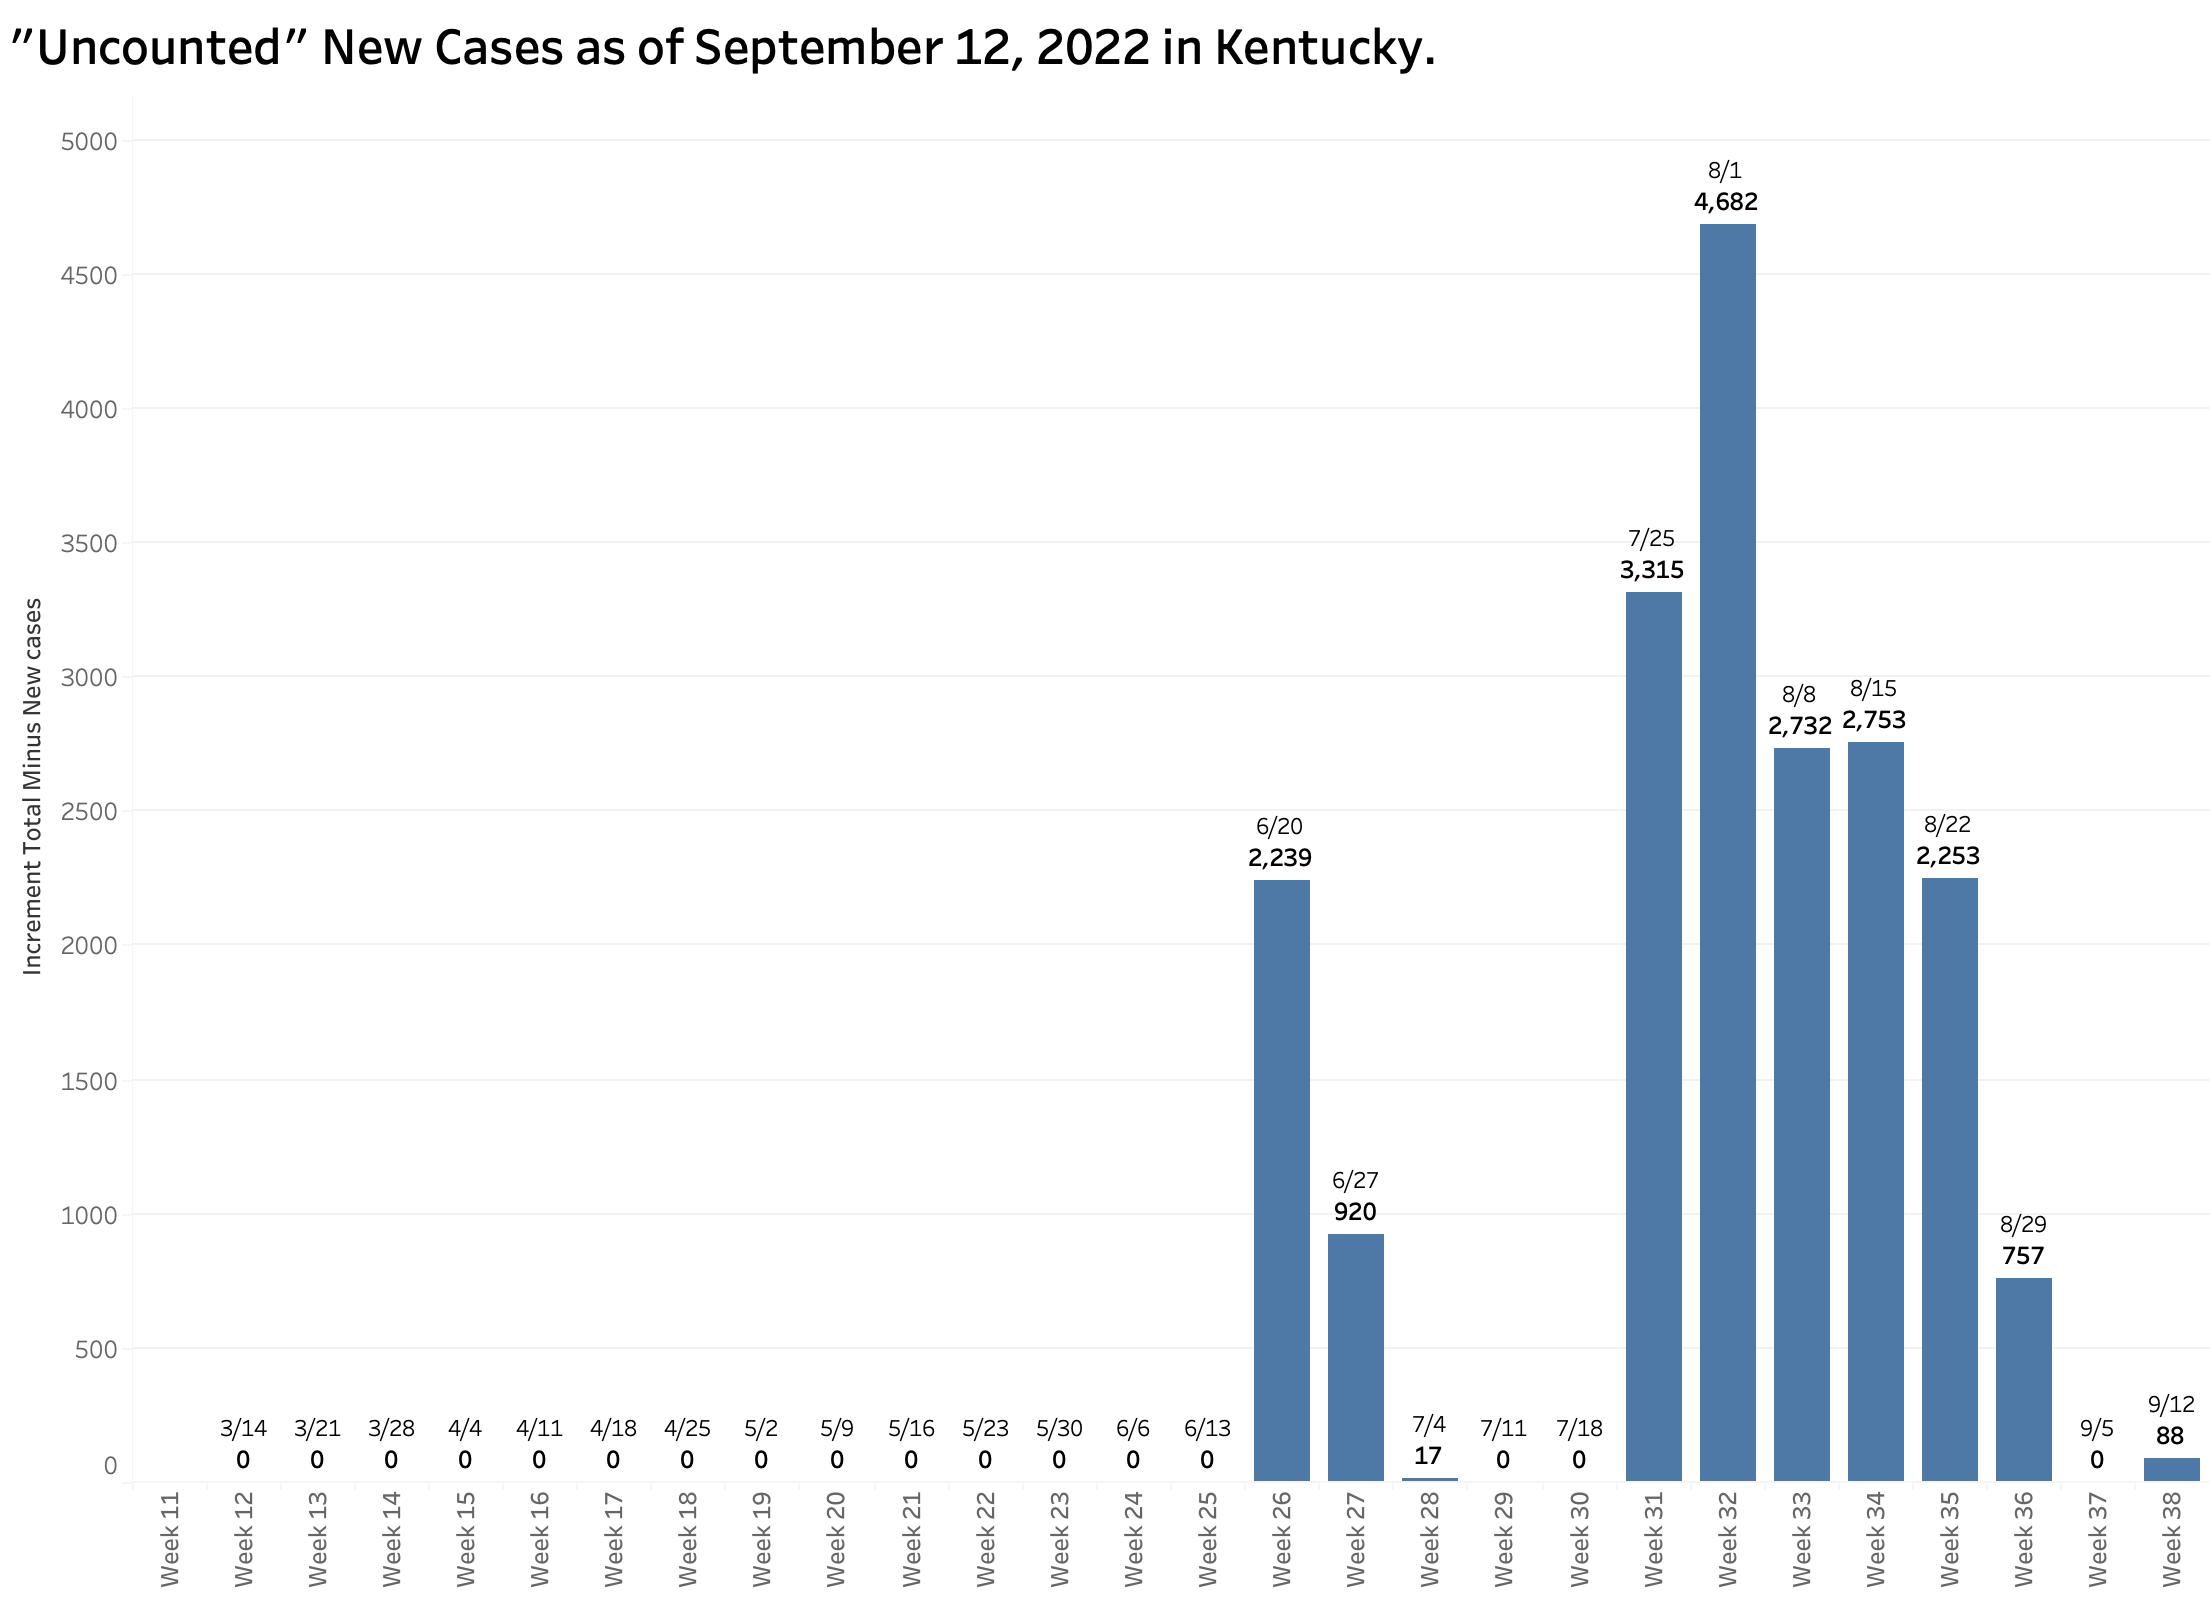
New Cases Identified and Reported:

Cases as reported dropped 29% from the previous week but are still relatively high.

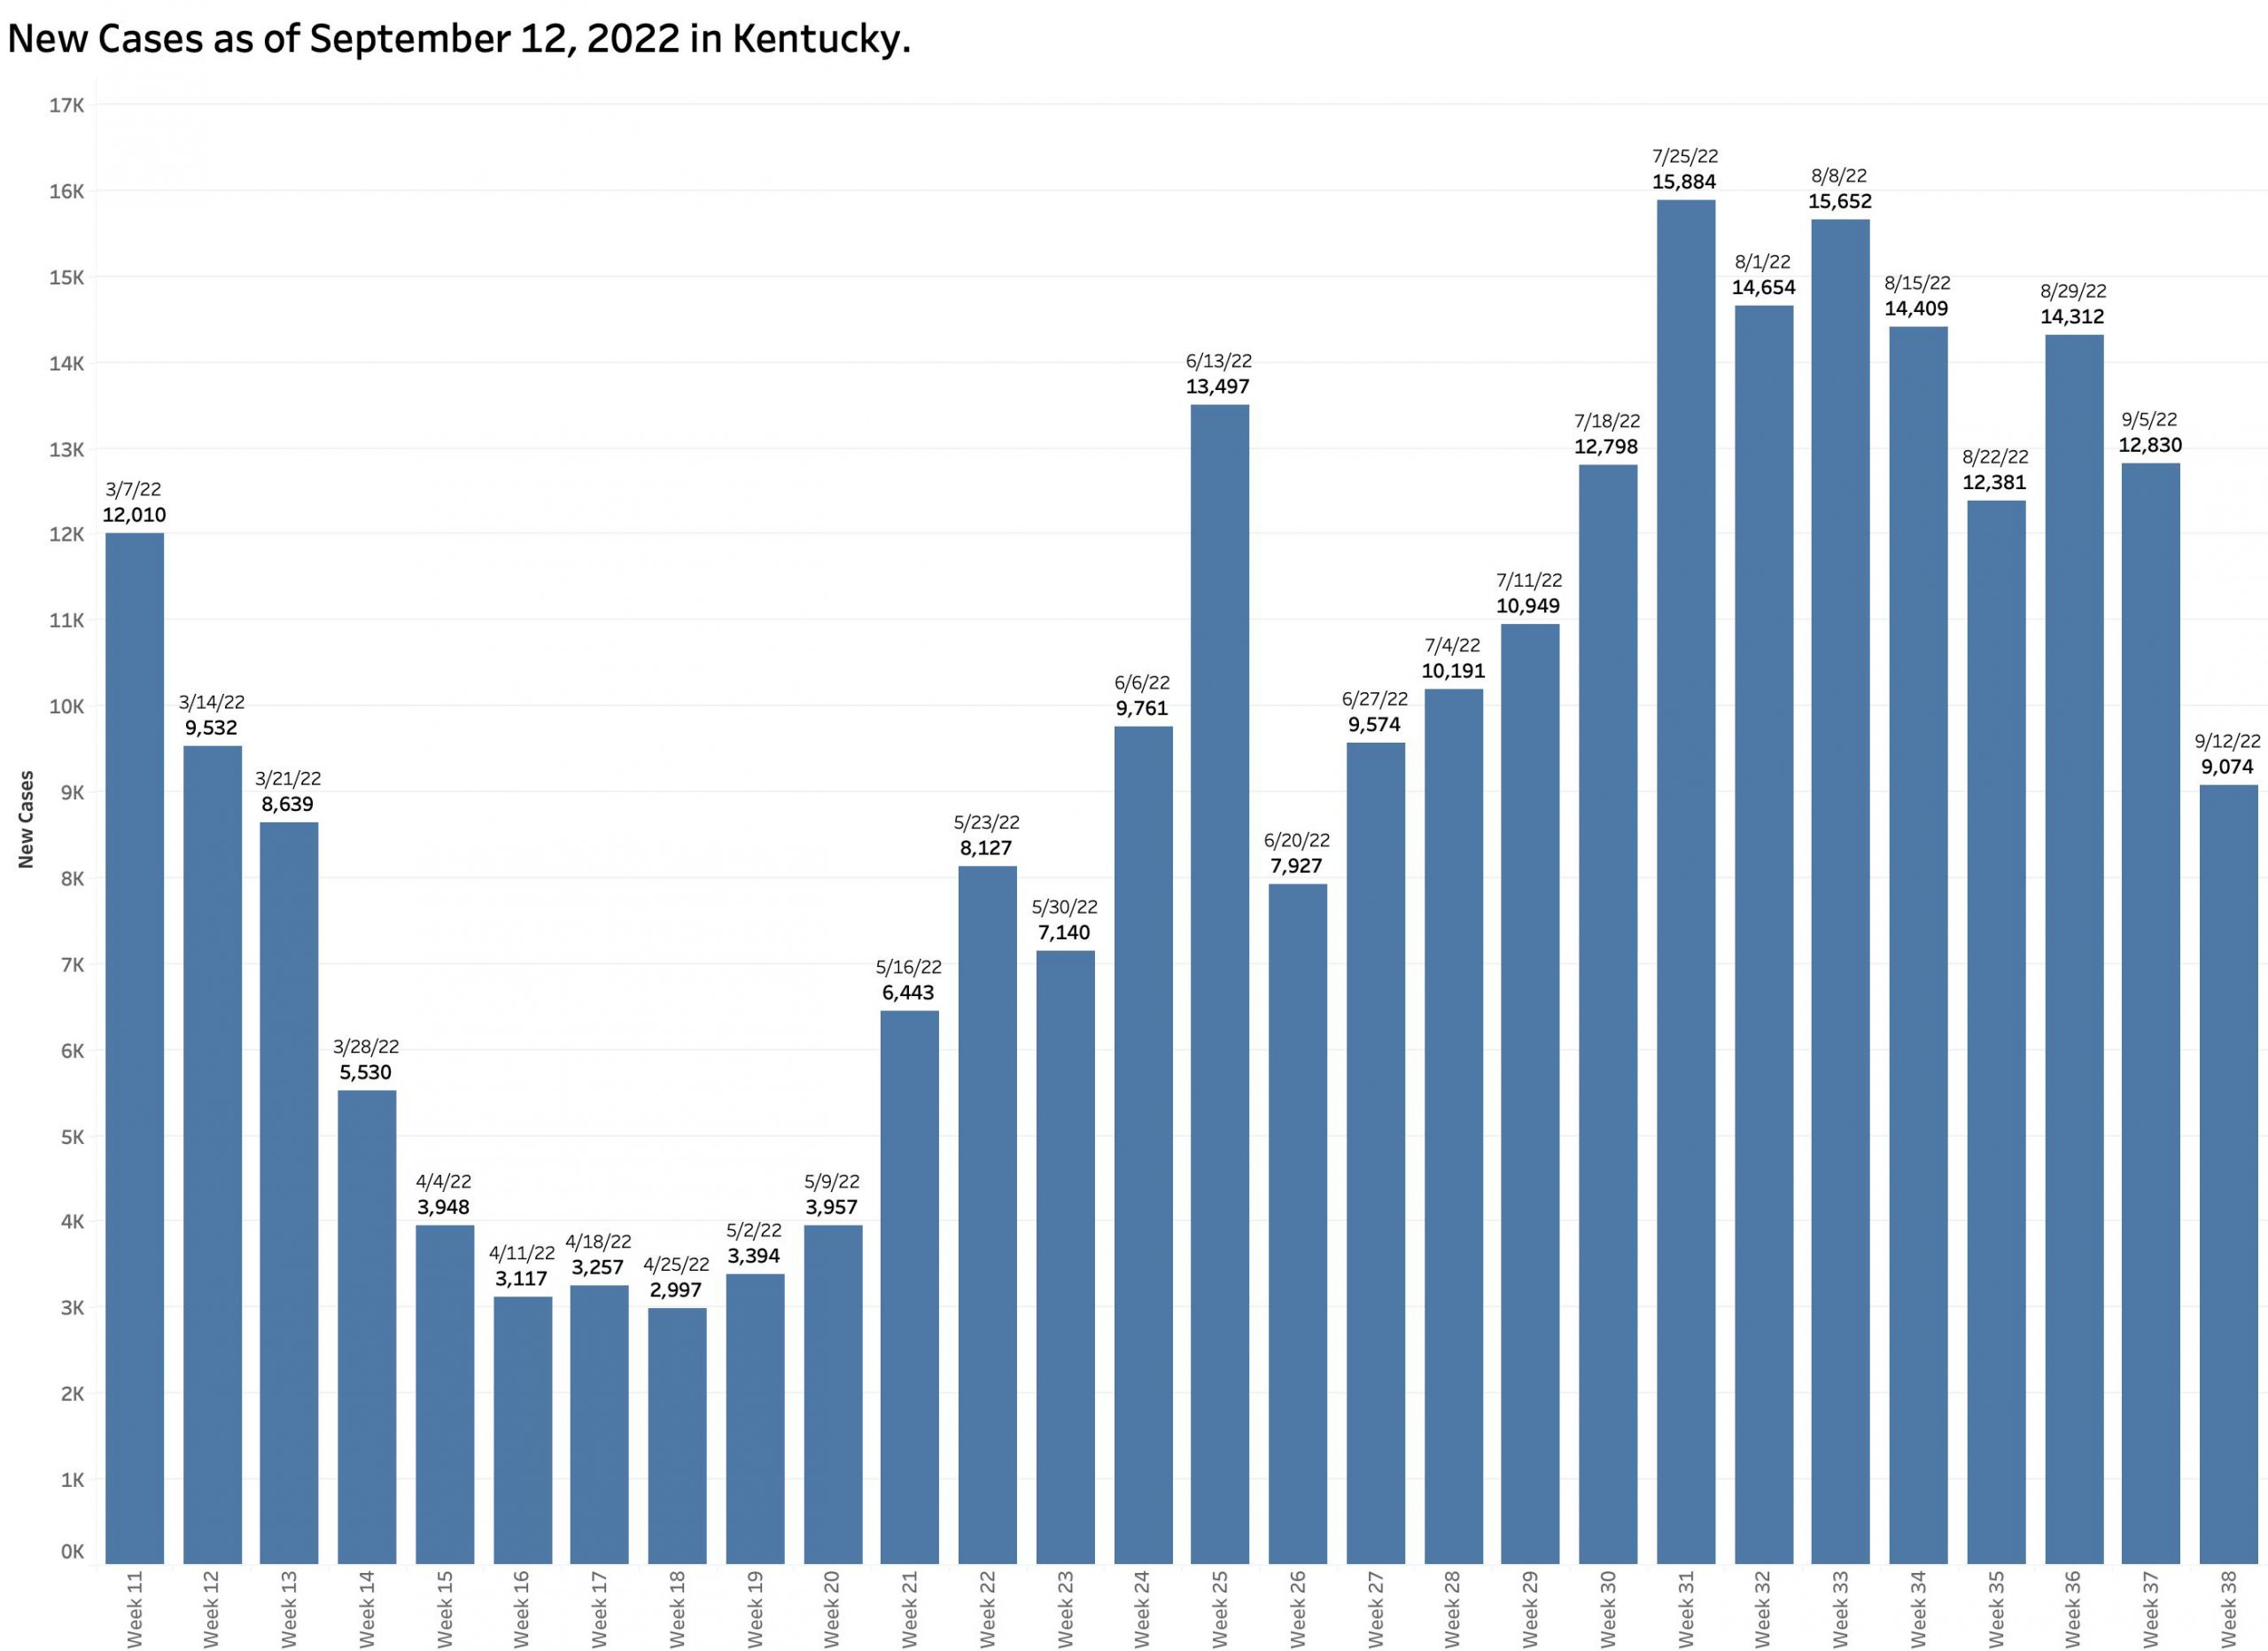
The chart above shows the raw counts of new cases identified within a predetermined earlier period. This is clearly an undercount. The following chart shows the difference between each  week’s reported “new” cases and the weekly increment in the aggregate total number of cases.  Thousands of cases are identified too late to be reported in a timely way.


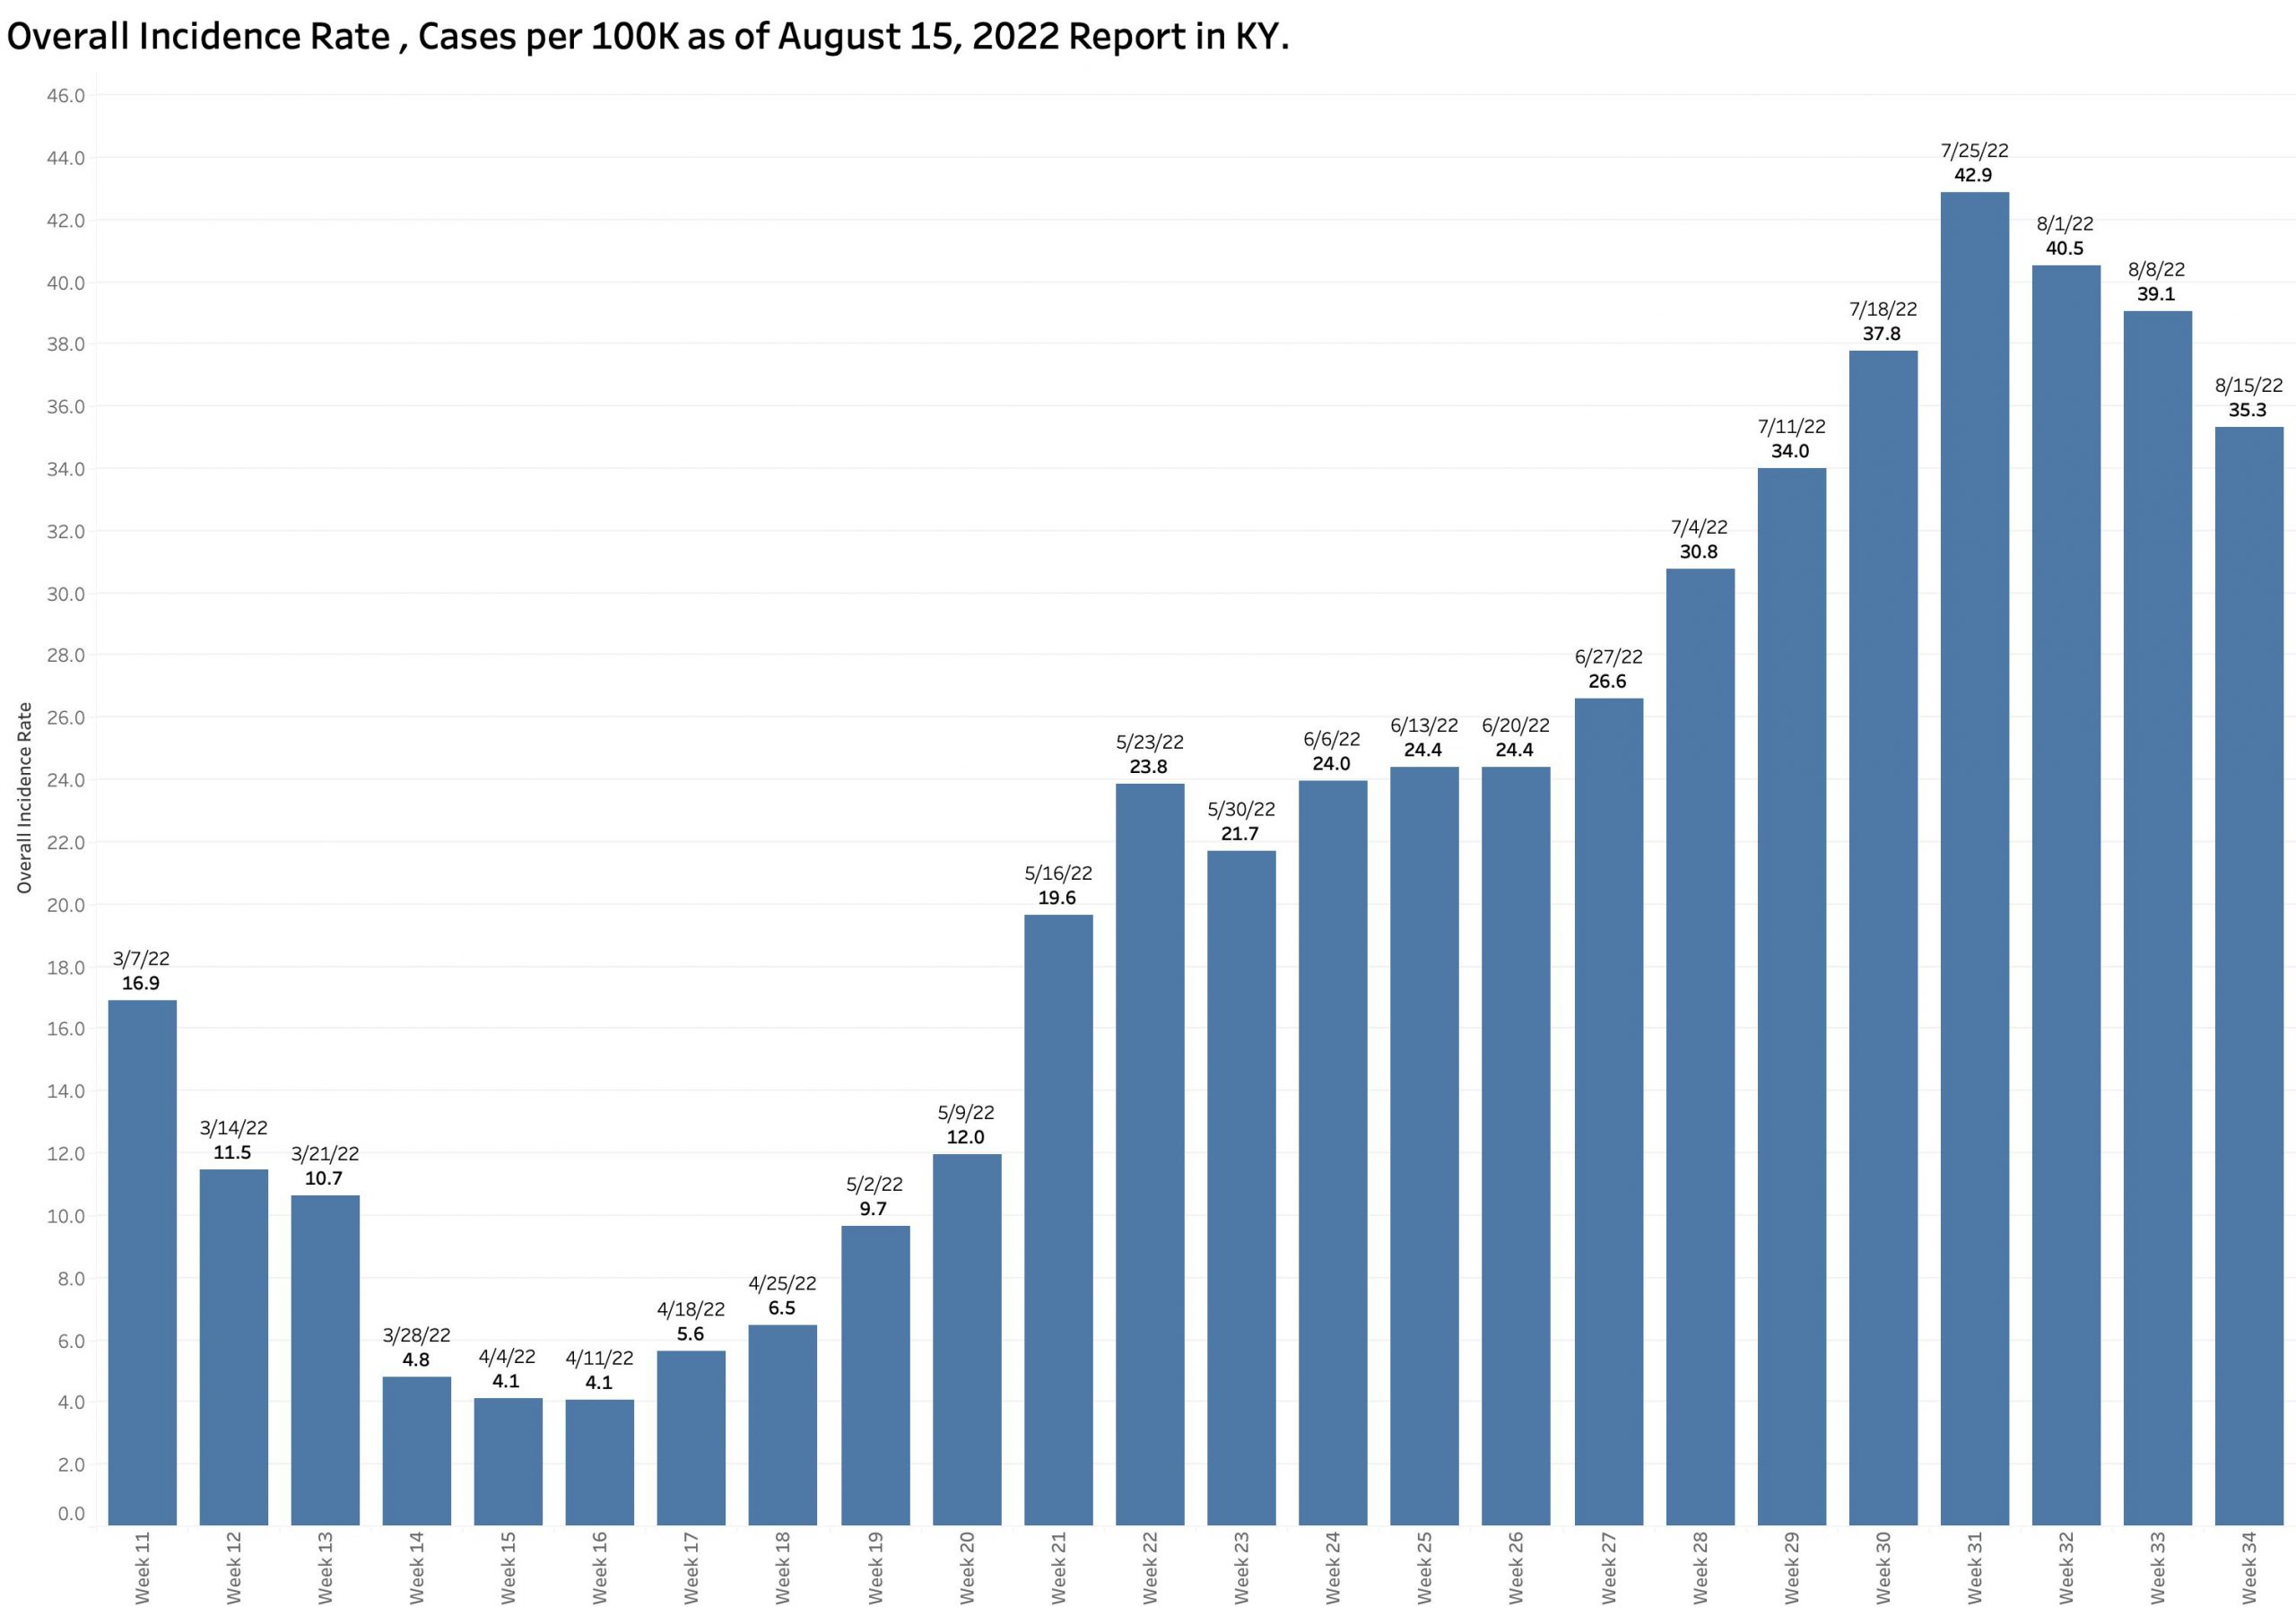
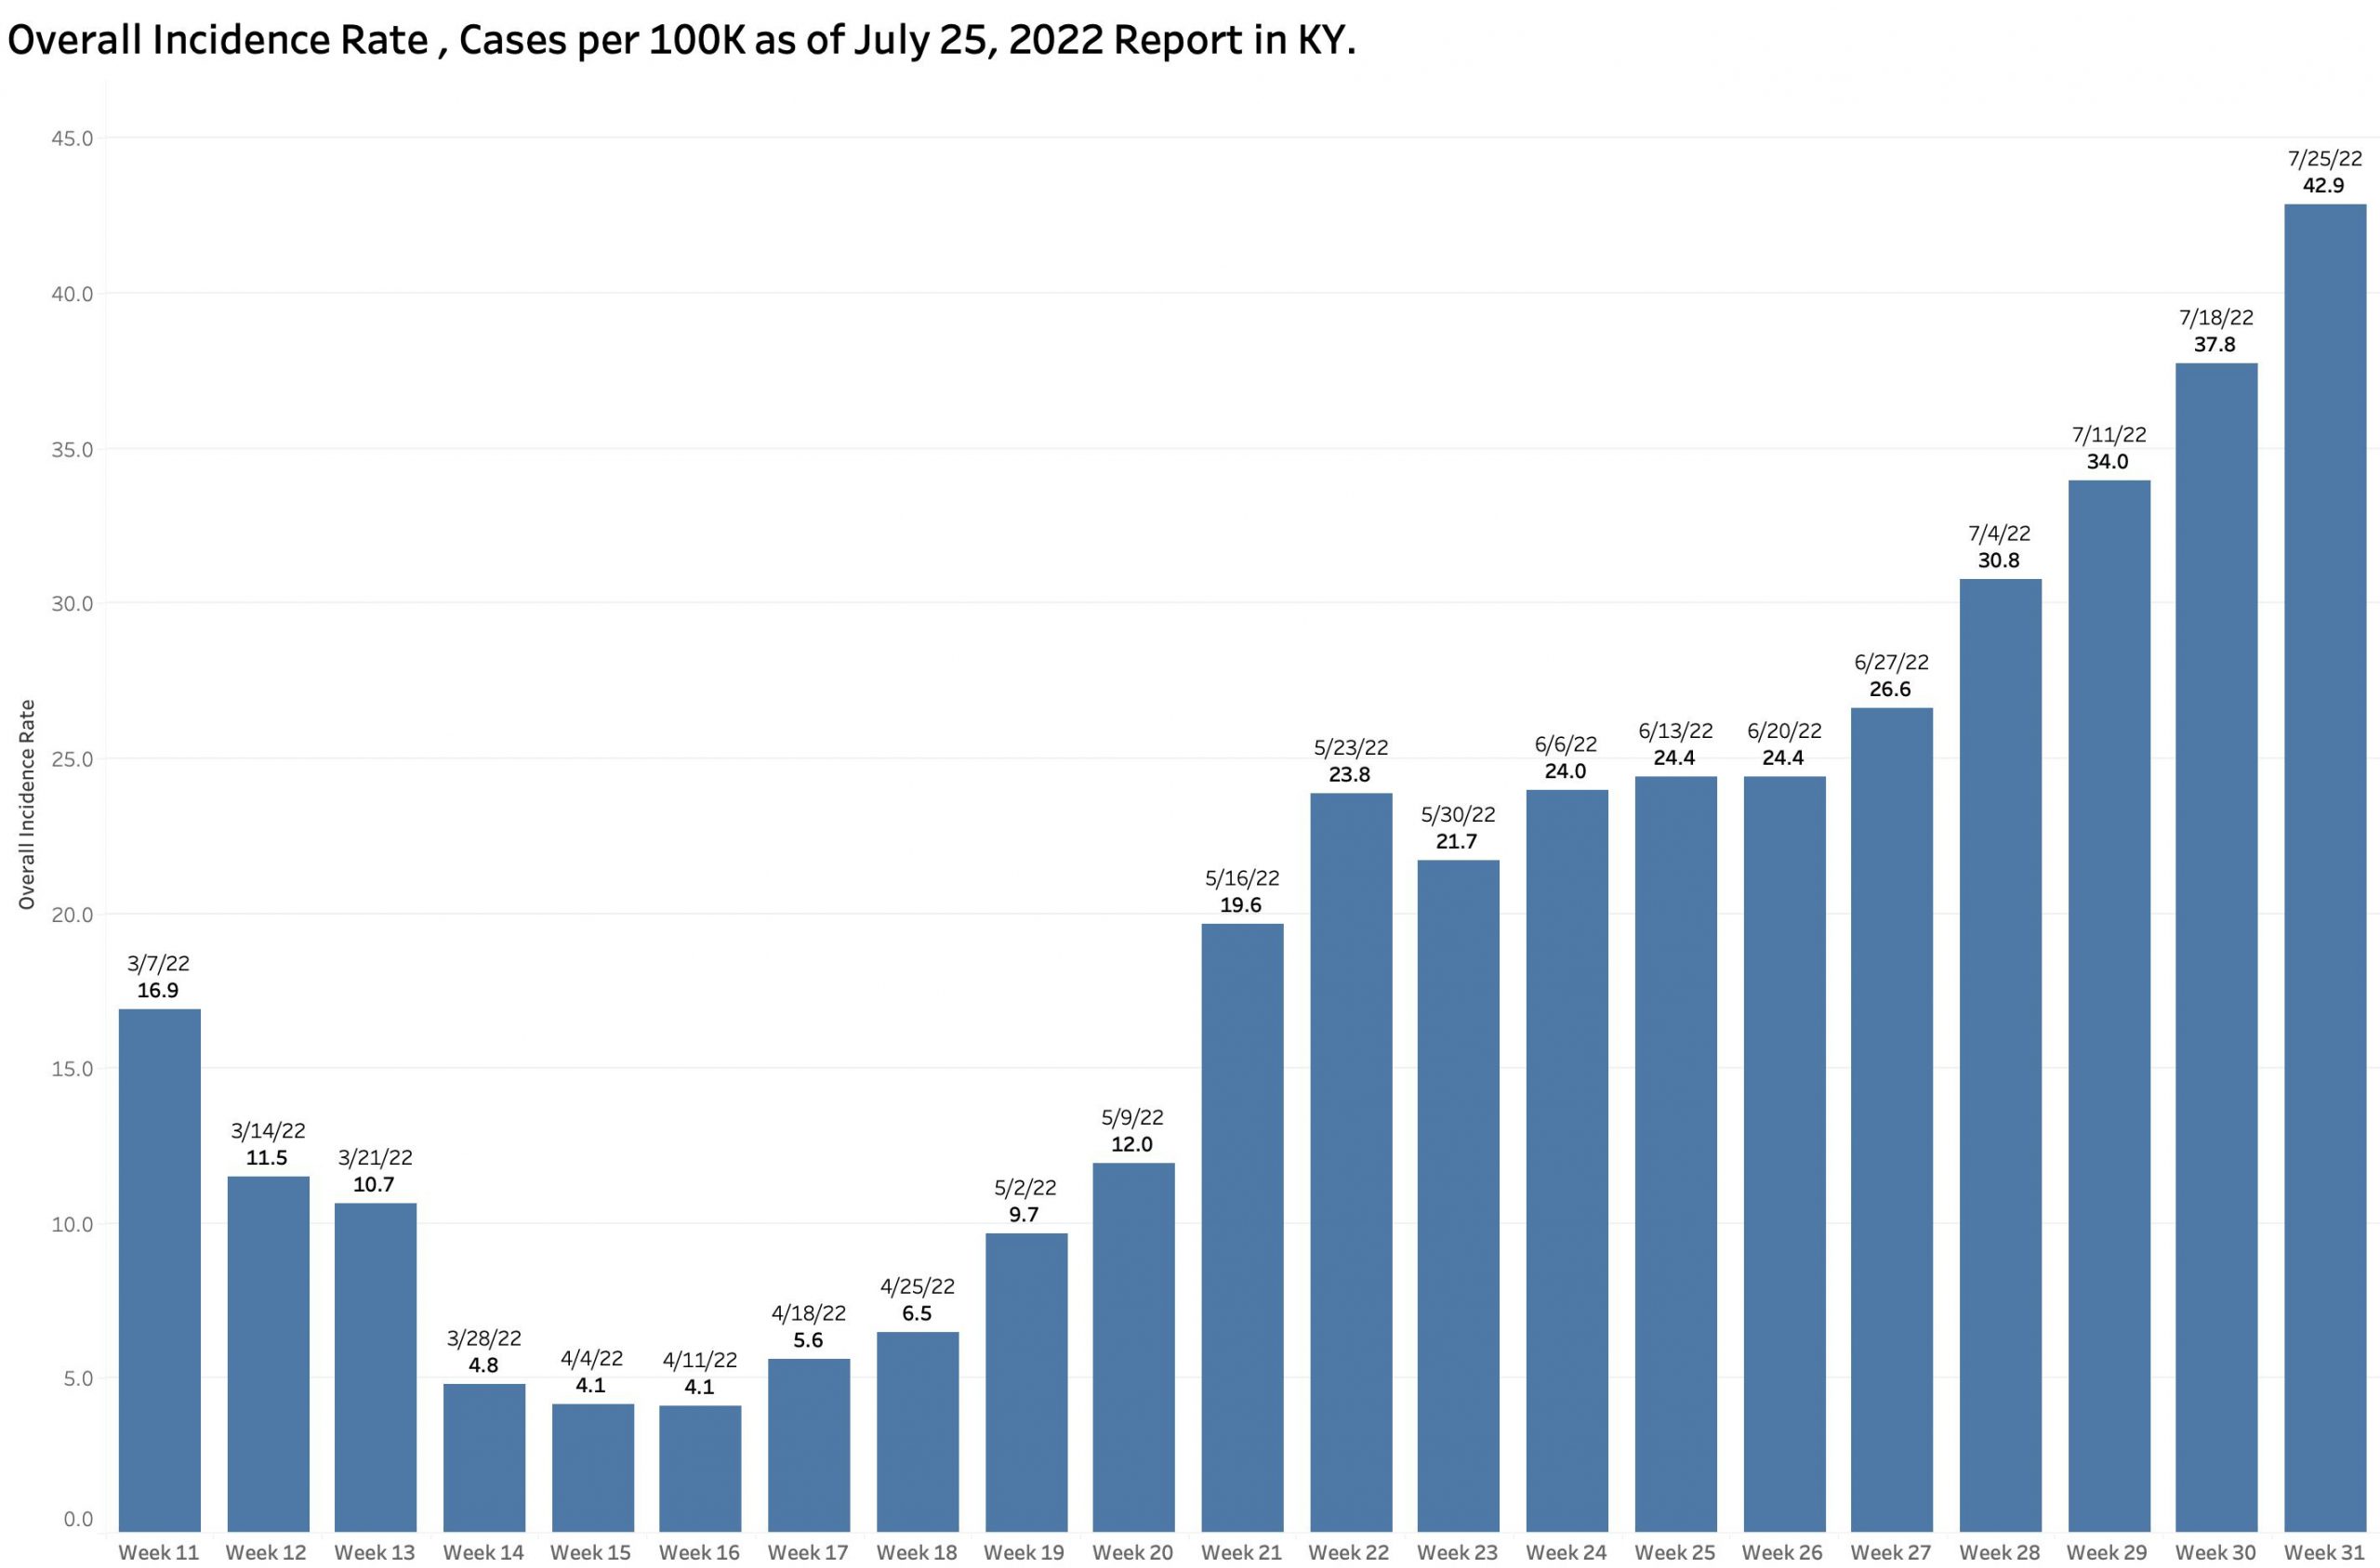
As expected, the state-wide overall incidence rate pretty much tracks the number of new cases. The differences between counties reman considerable.  As has been the case for some time, a major hot-spot in the nation for Covid-19 infection is the Appalachian parts of Kentucky, West Virginia, Virginia, Tennessee, and North Carolina.


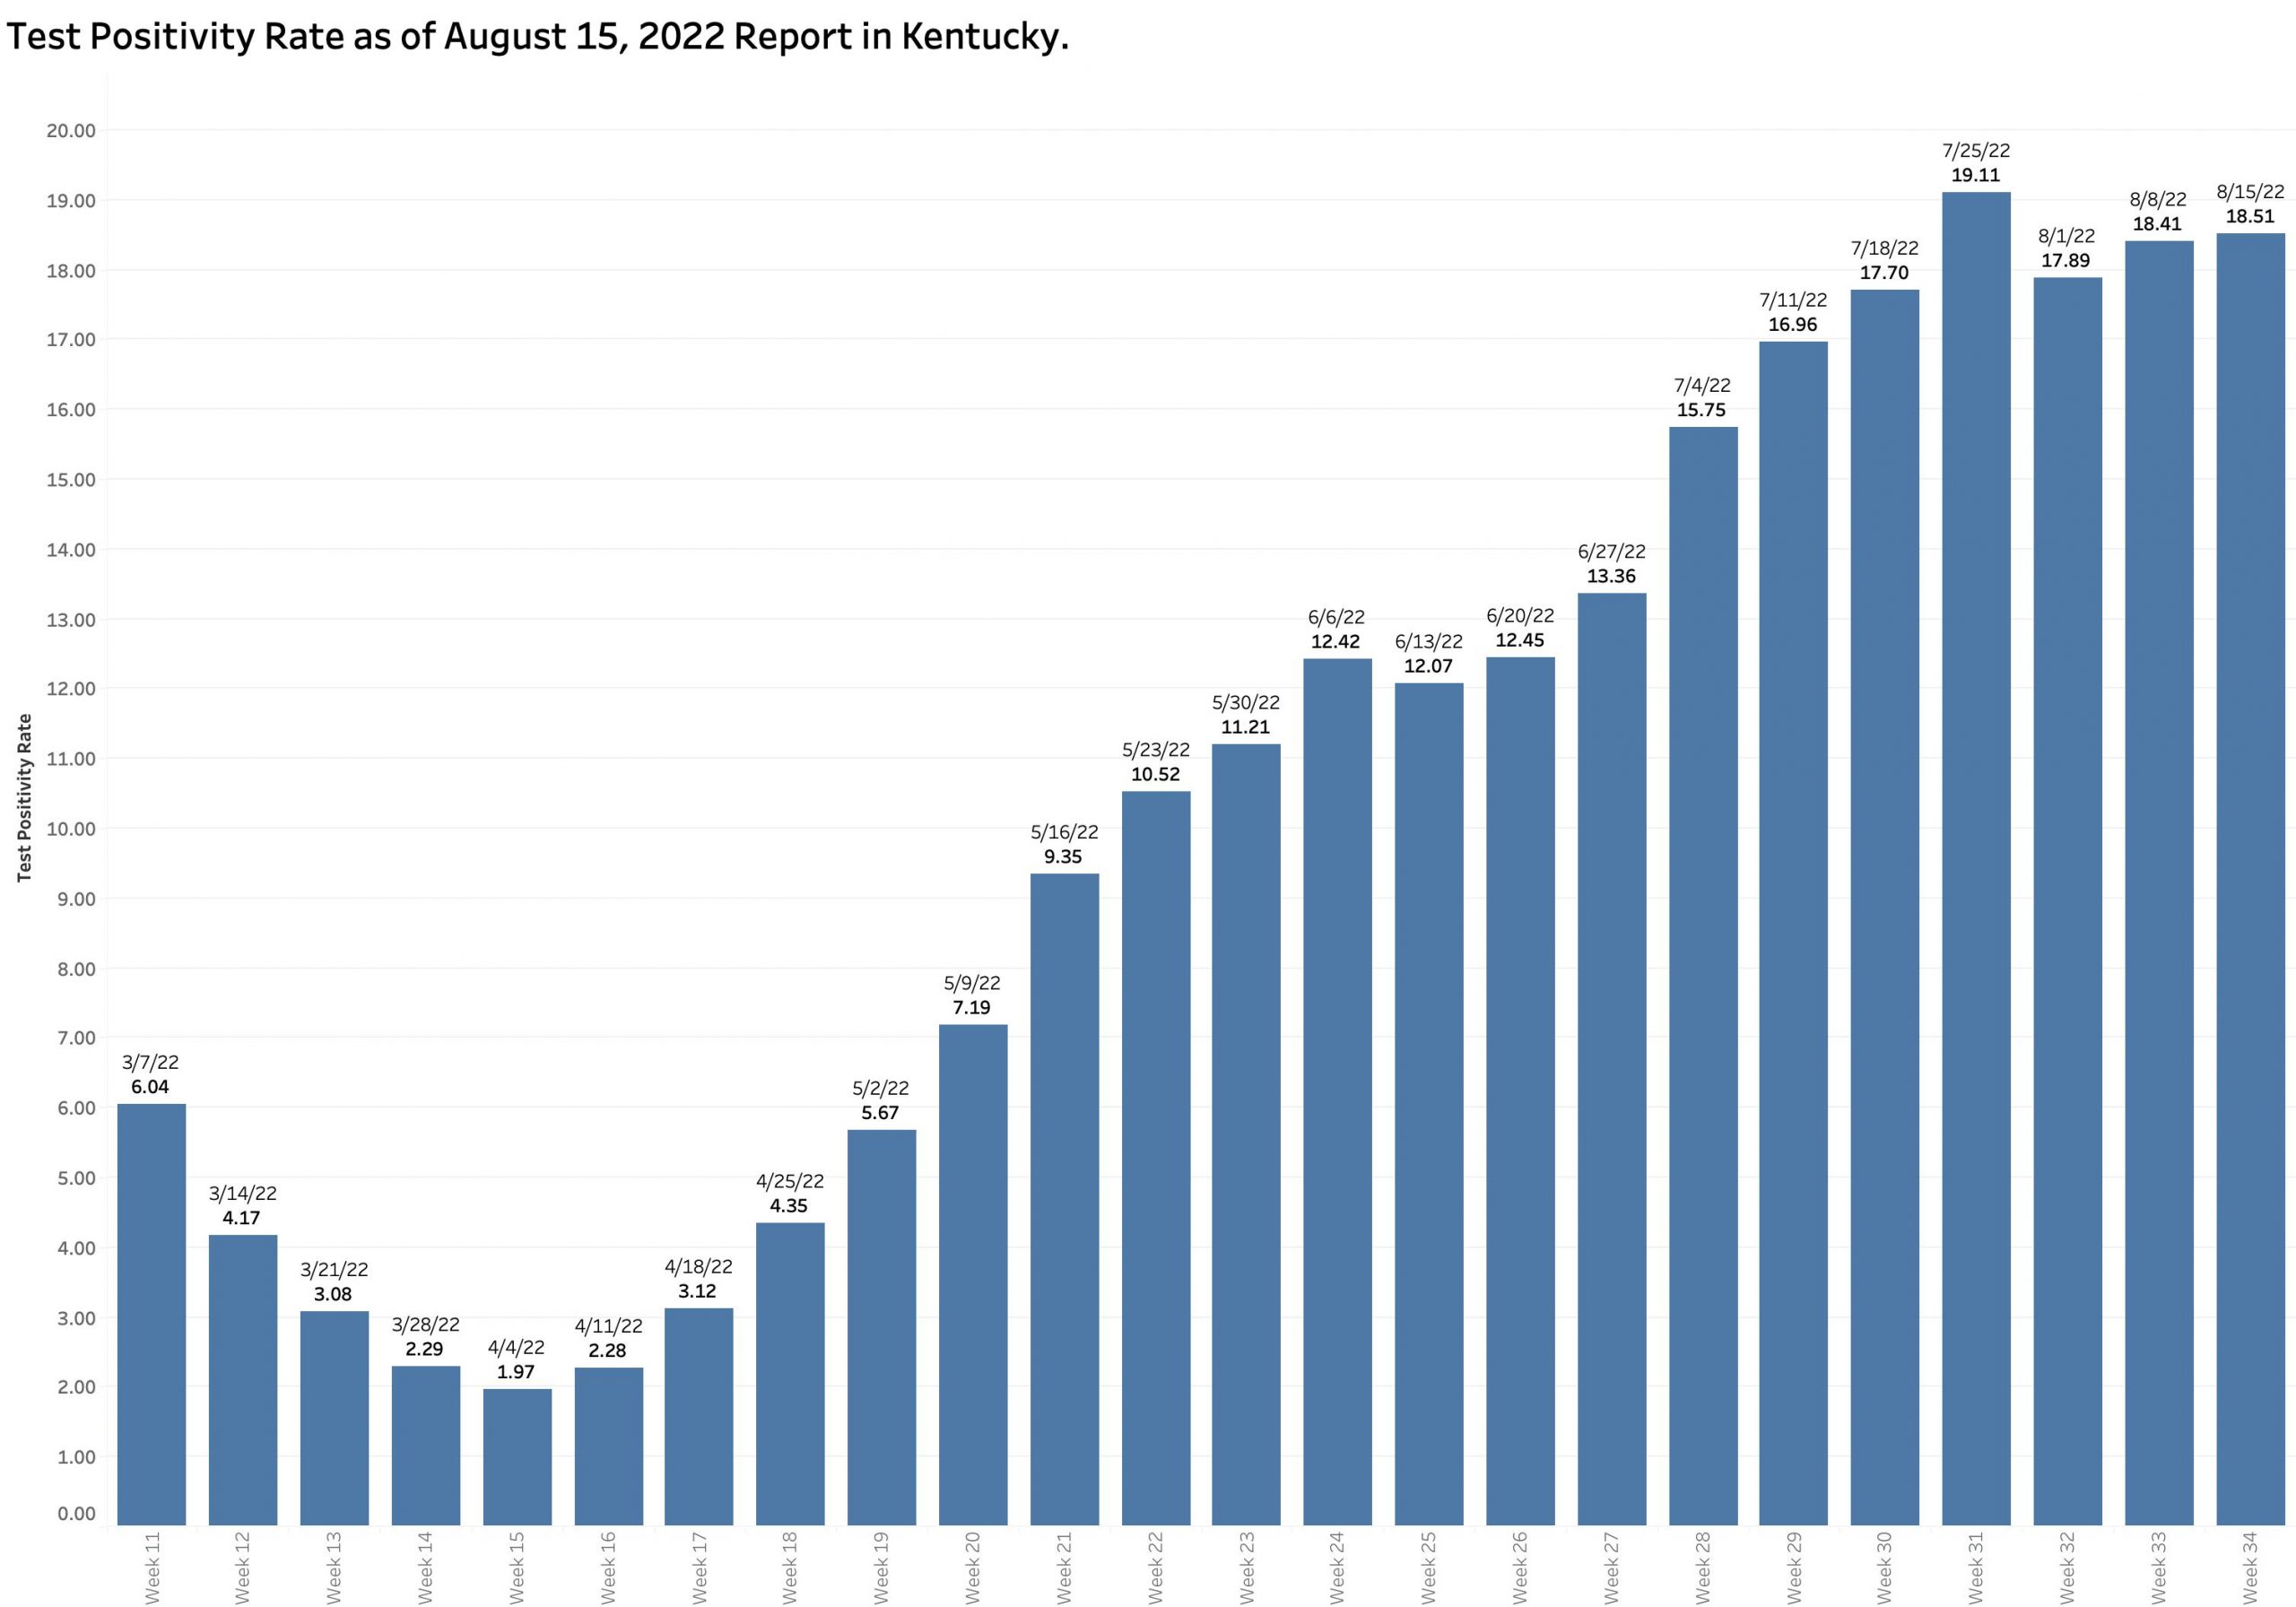
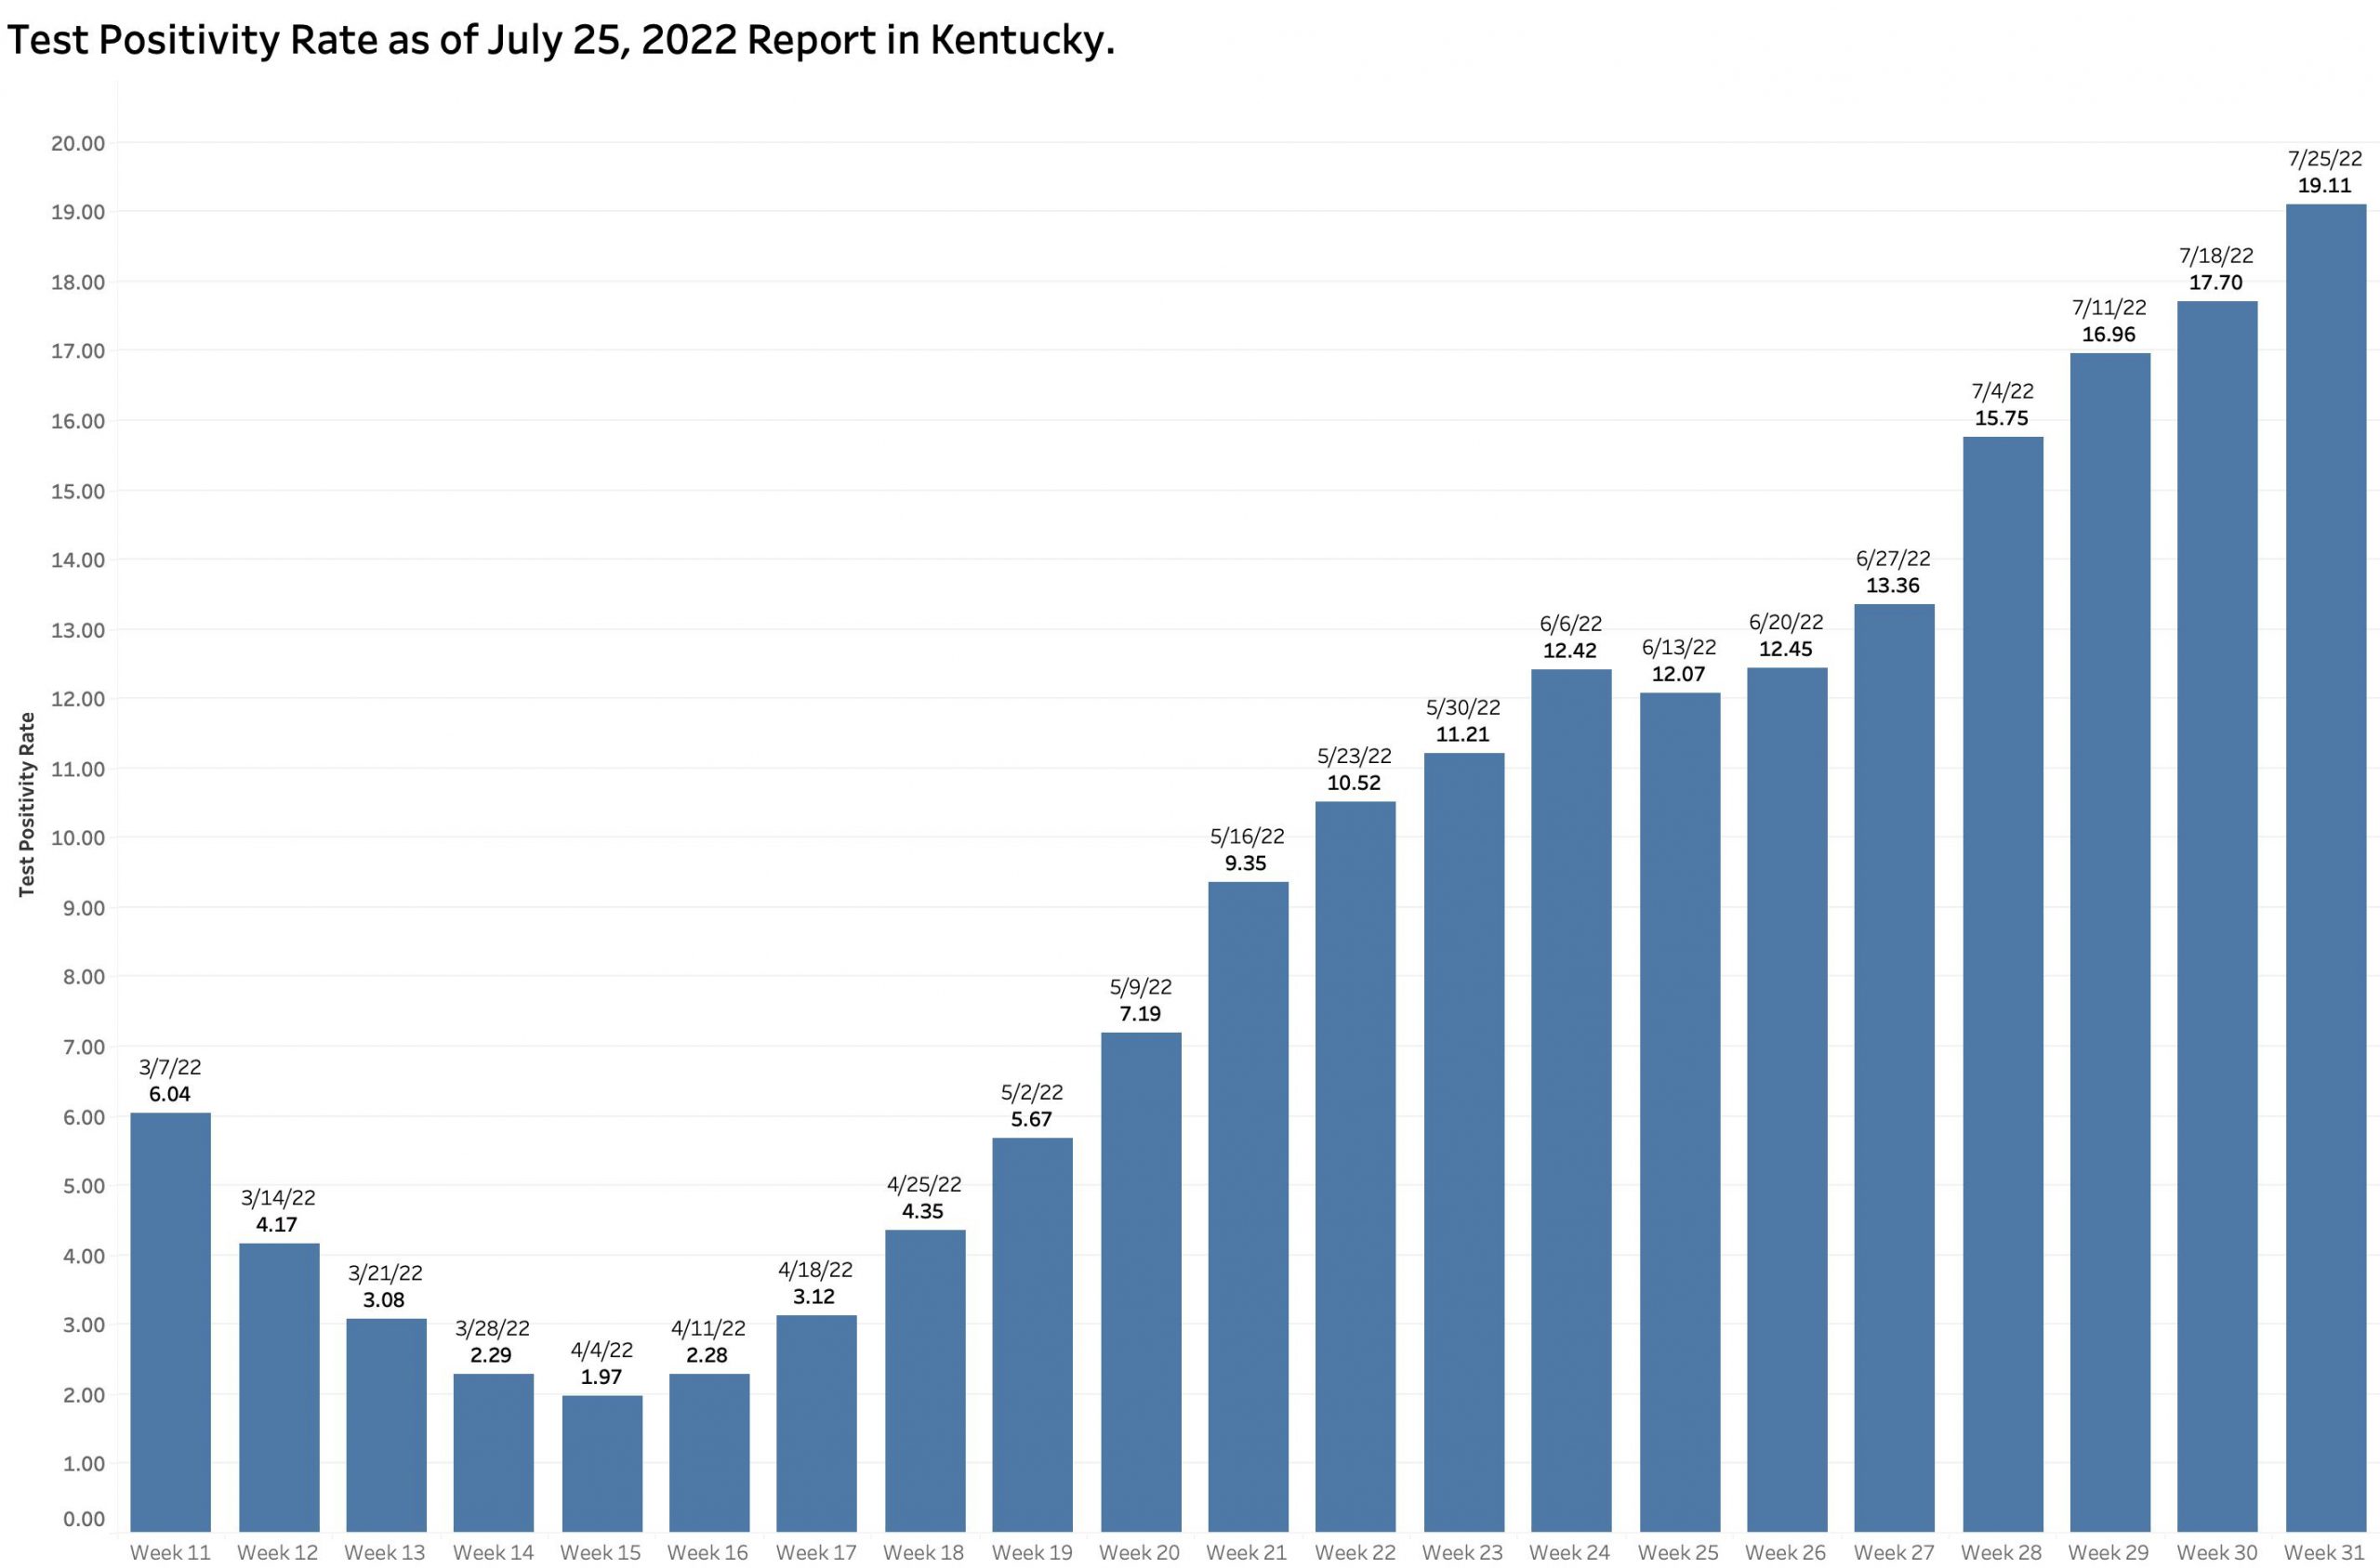
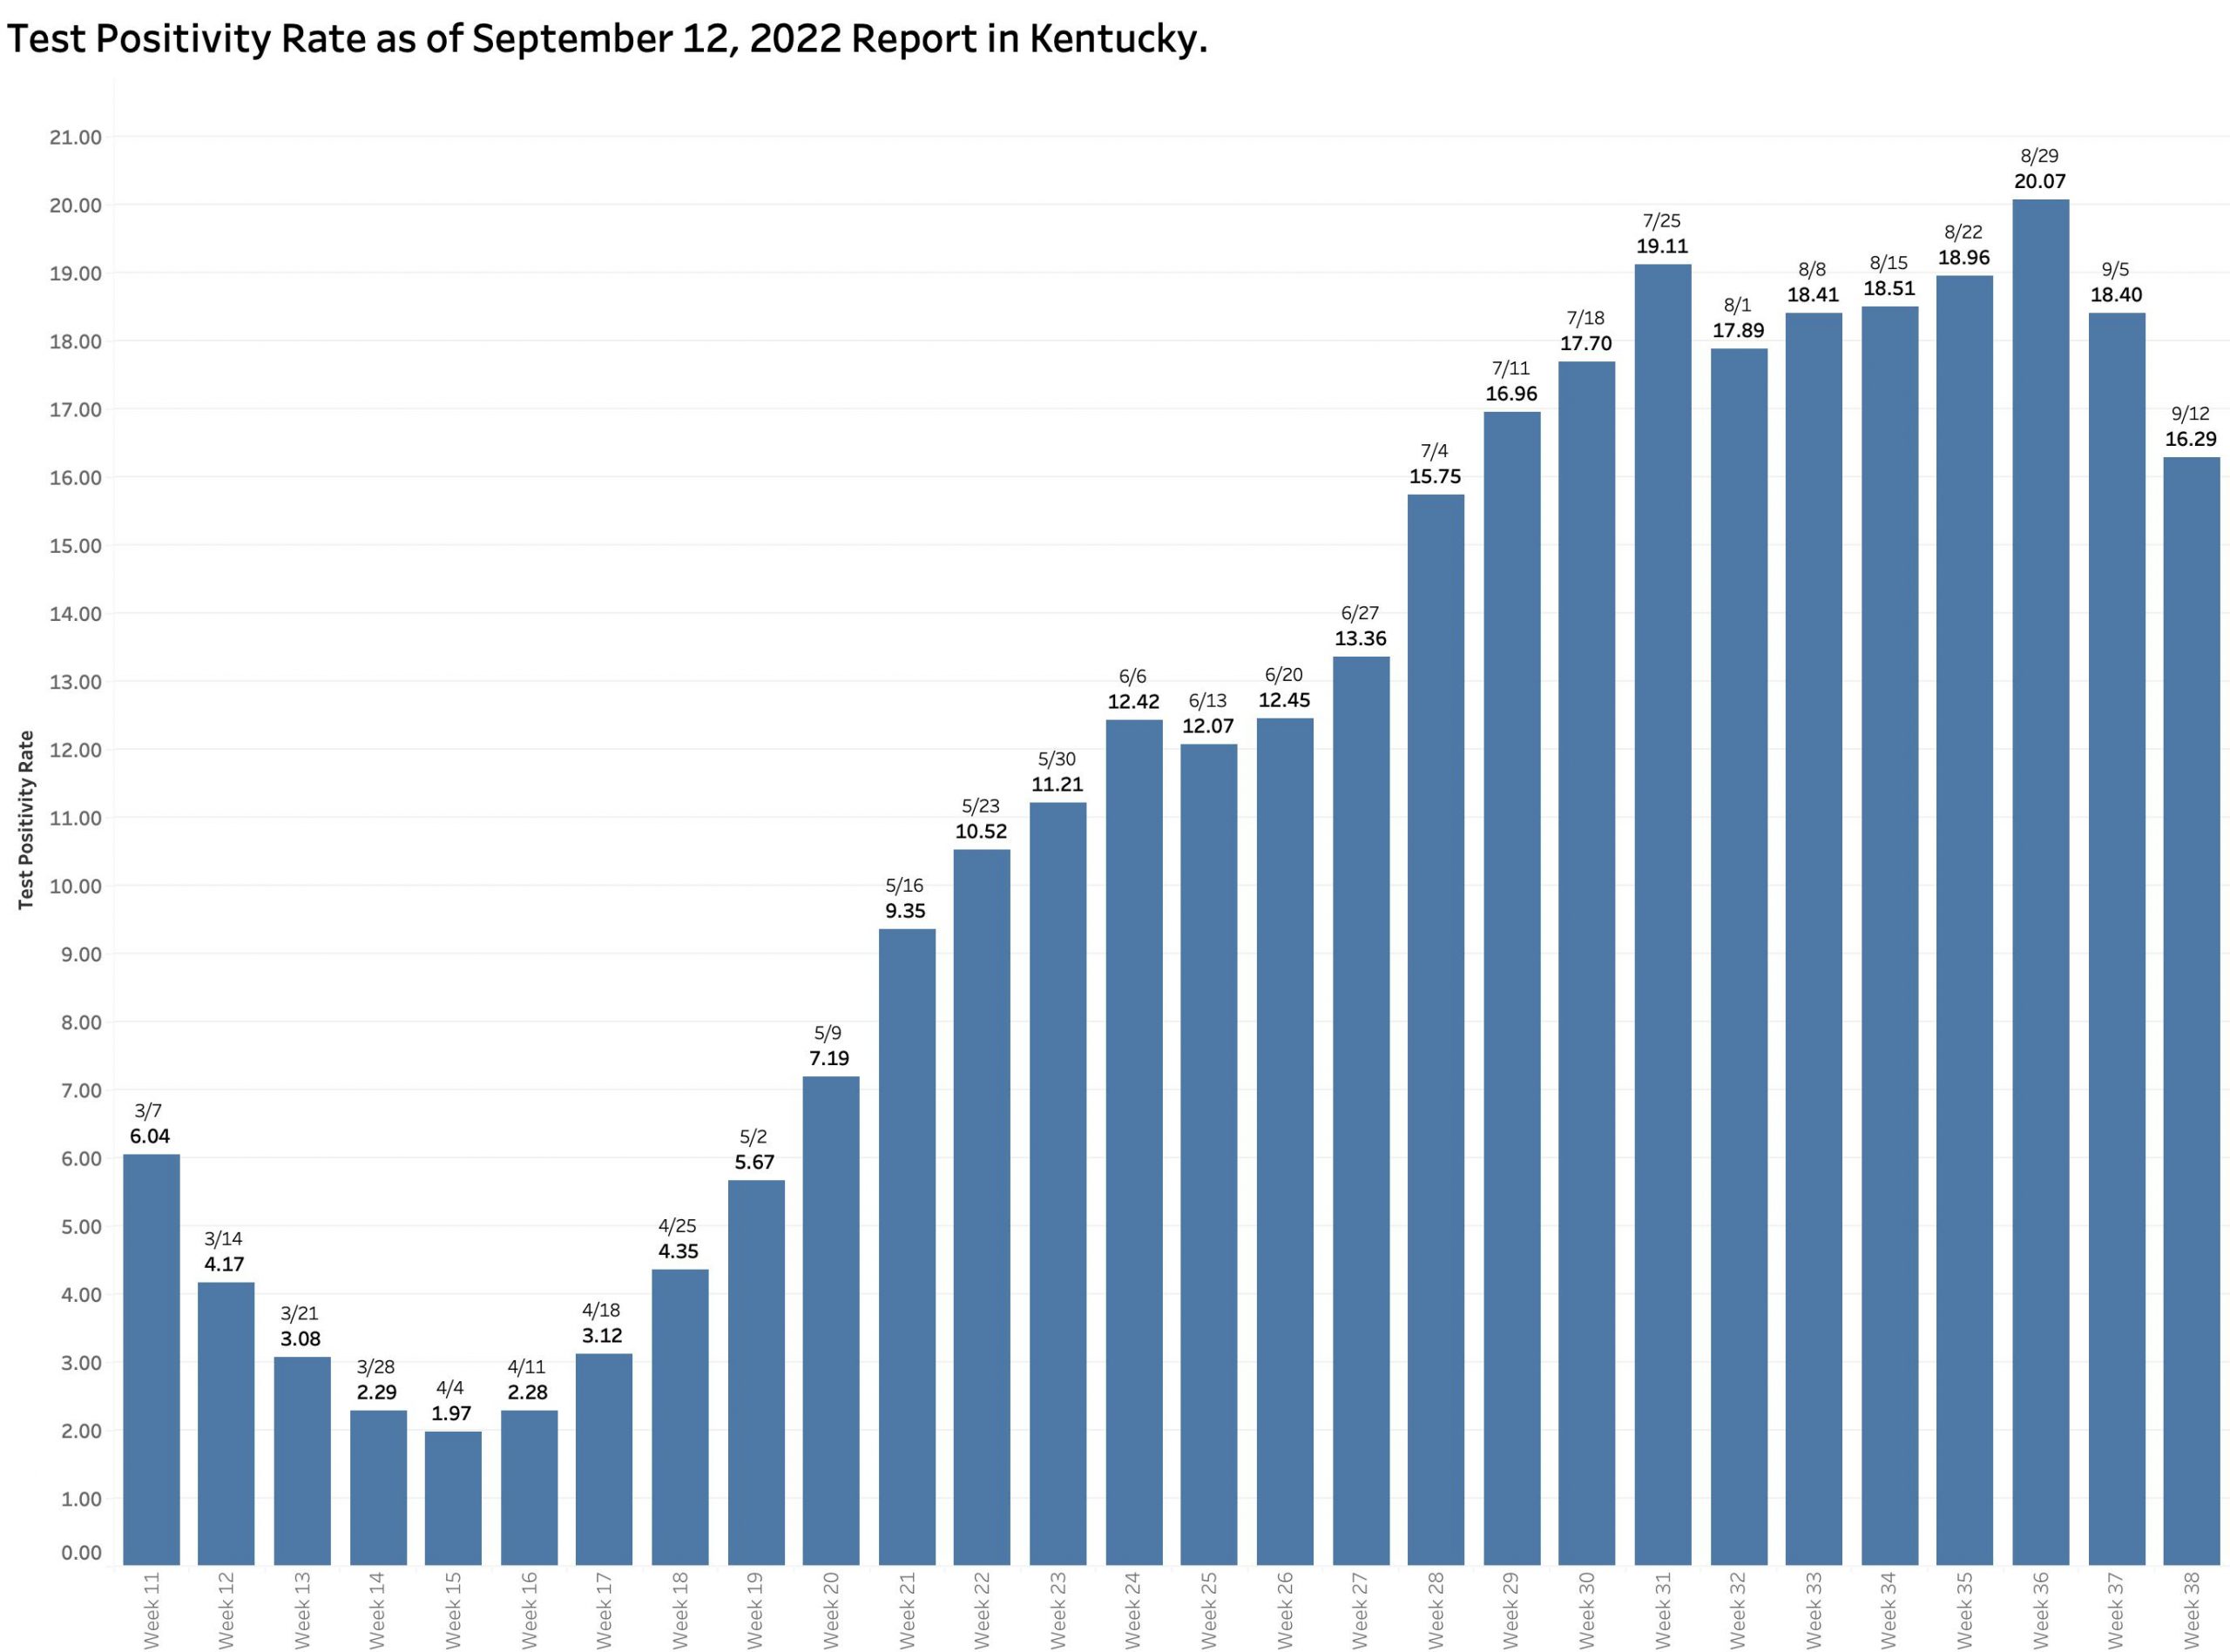
The Test Positivity Rate decreased a more modest 11.5% from the previous week to 16.3%. The last time the TPR was lower than this in the report of July 4, another national holiday.


The number of PCR viral RNA tests performed from which the TPR is calculated dropped a considerable 26.5%.

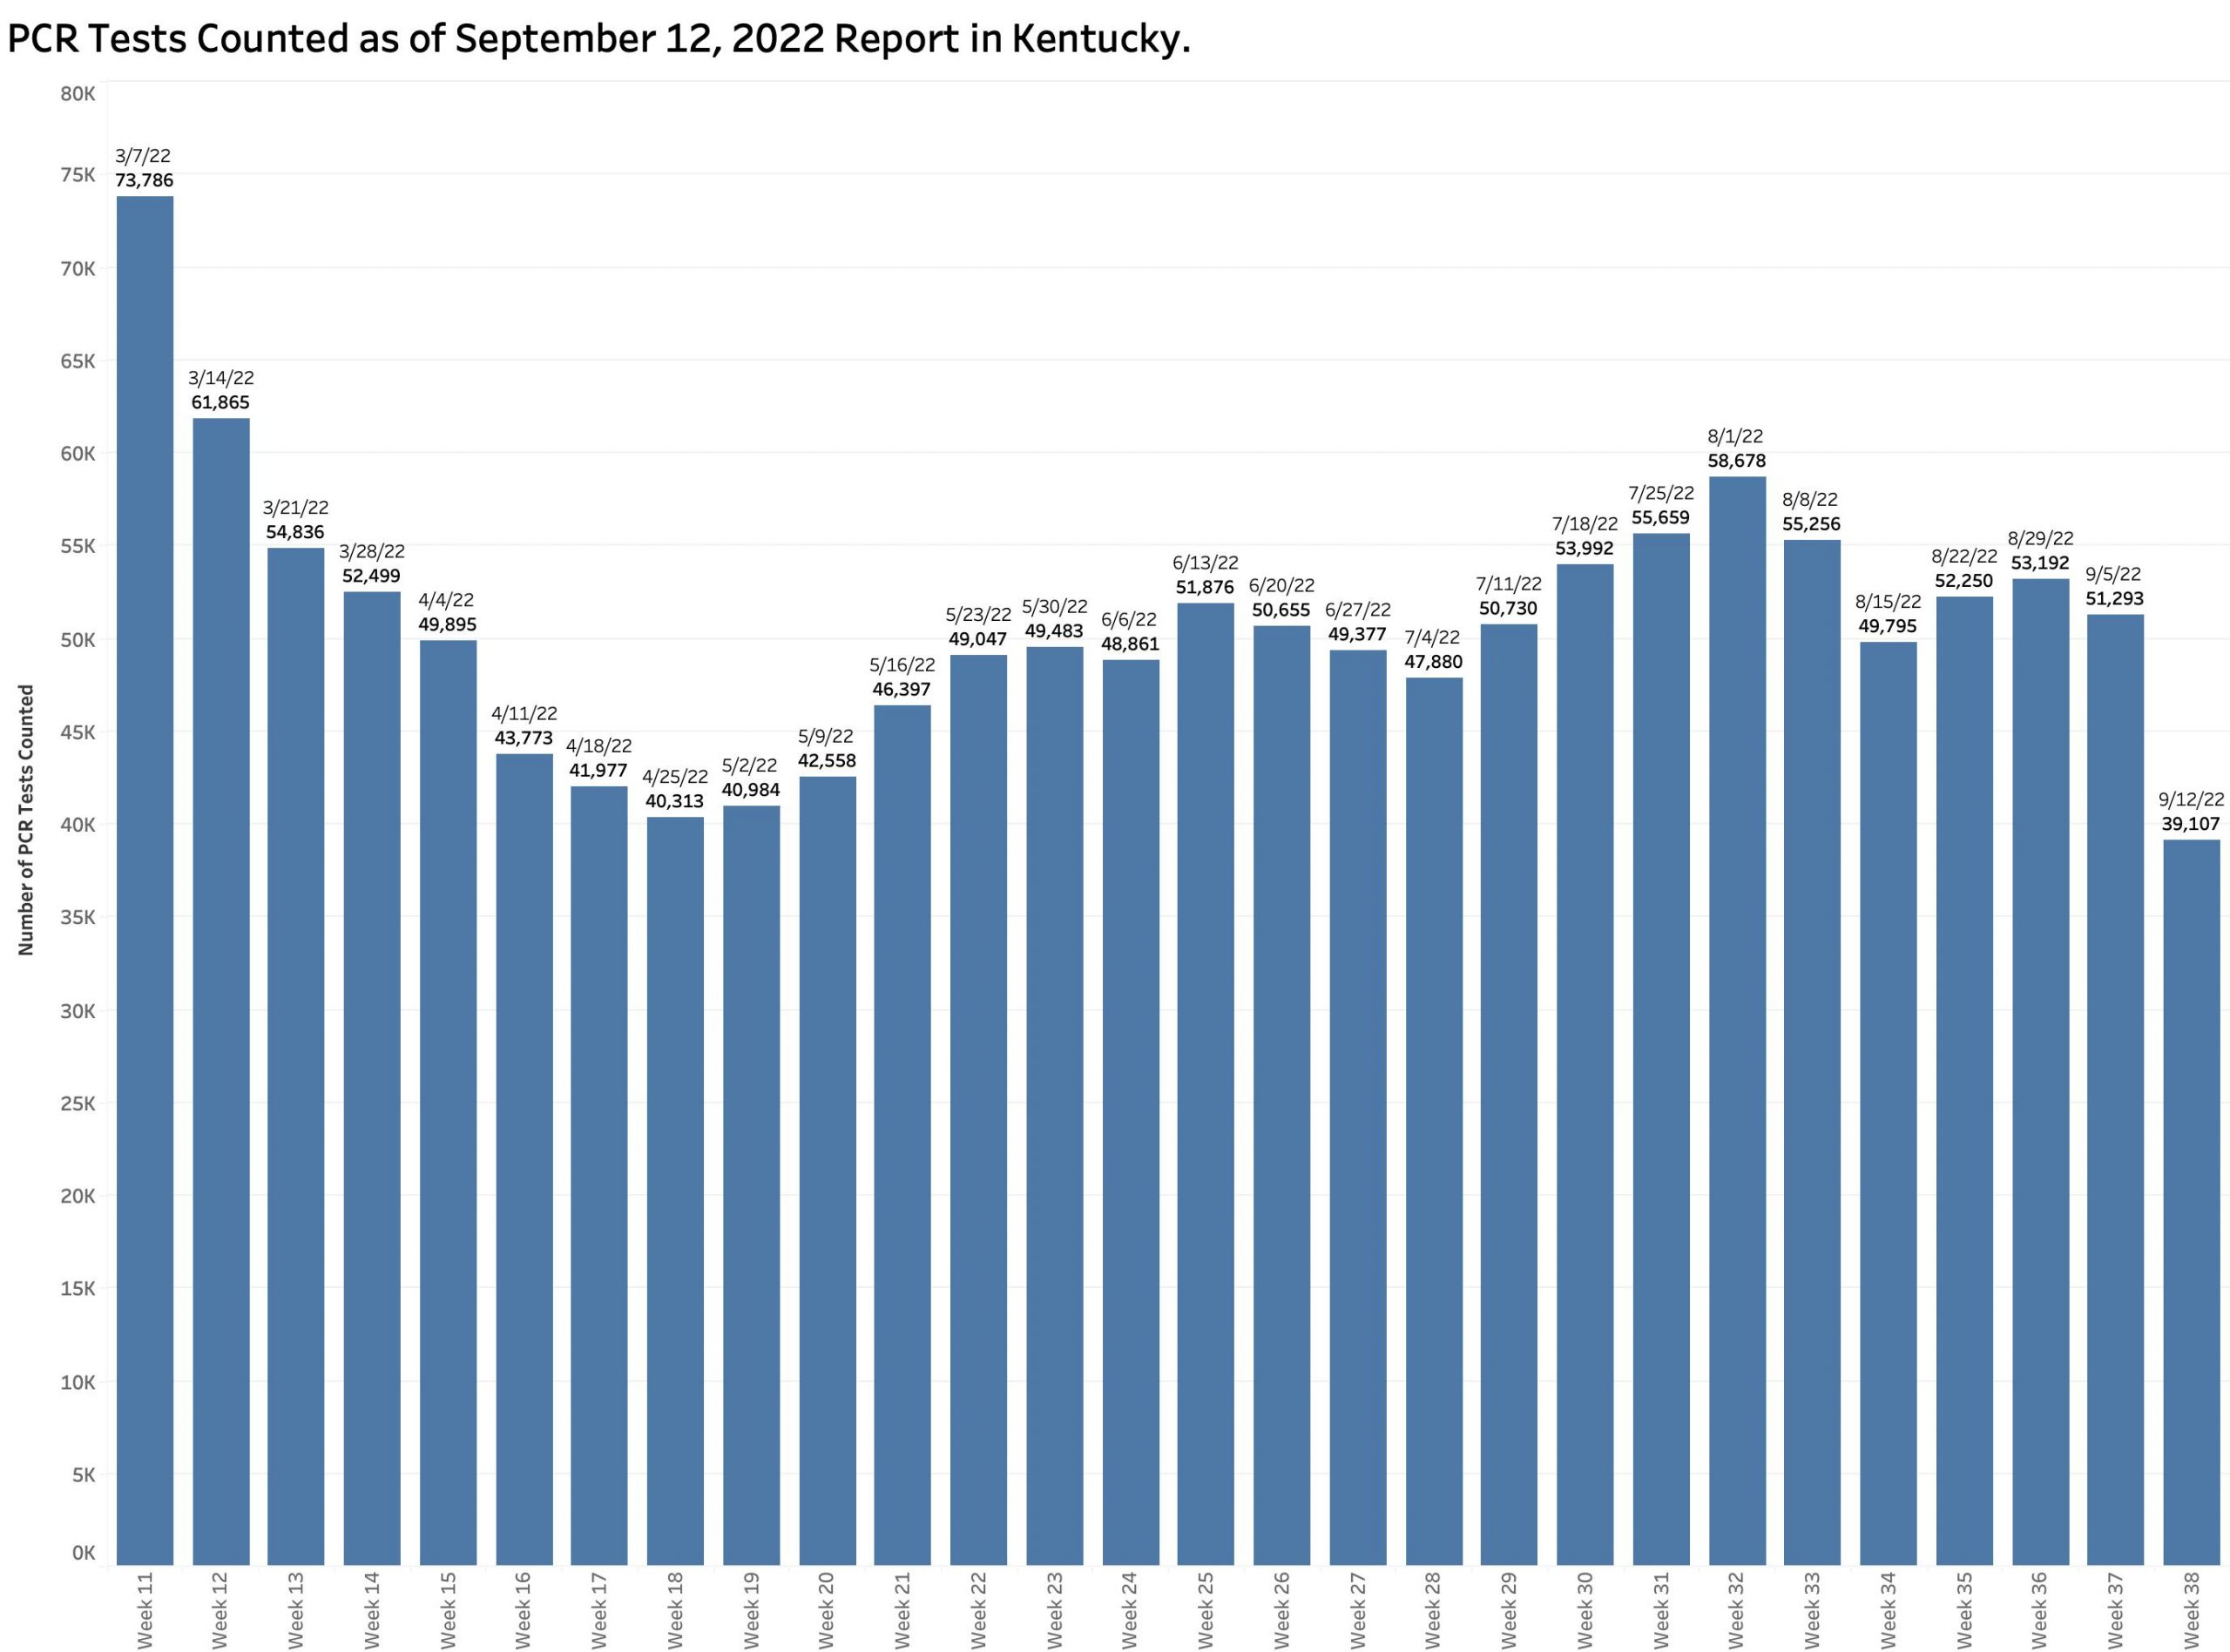
In recent months, some 70% of new cases have been regularly identified using PCR testing. [Home testing and antigen testing are not being accounted for separately at all, but likely are in number used more than PCR tests.]  Surely the reported number of new cases is lower in part due to fewer tests being done. One does not find what one is not looking for!


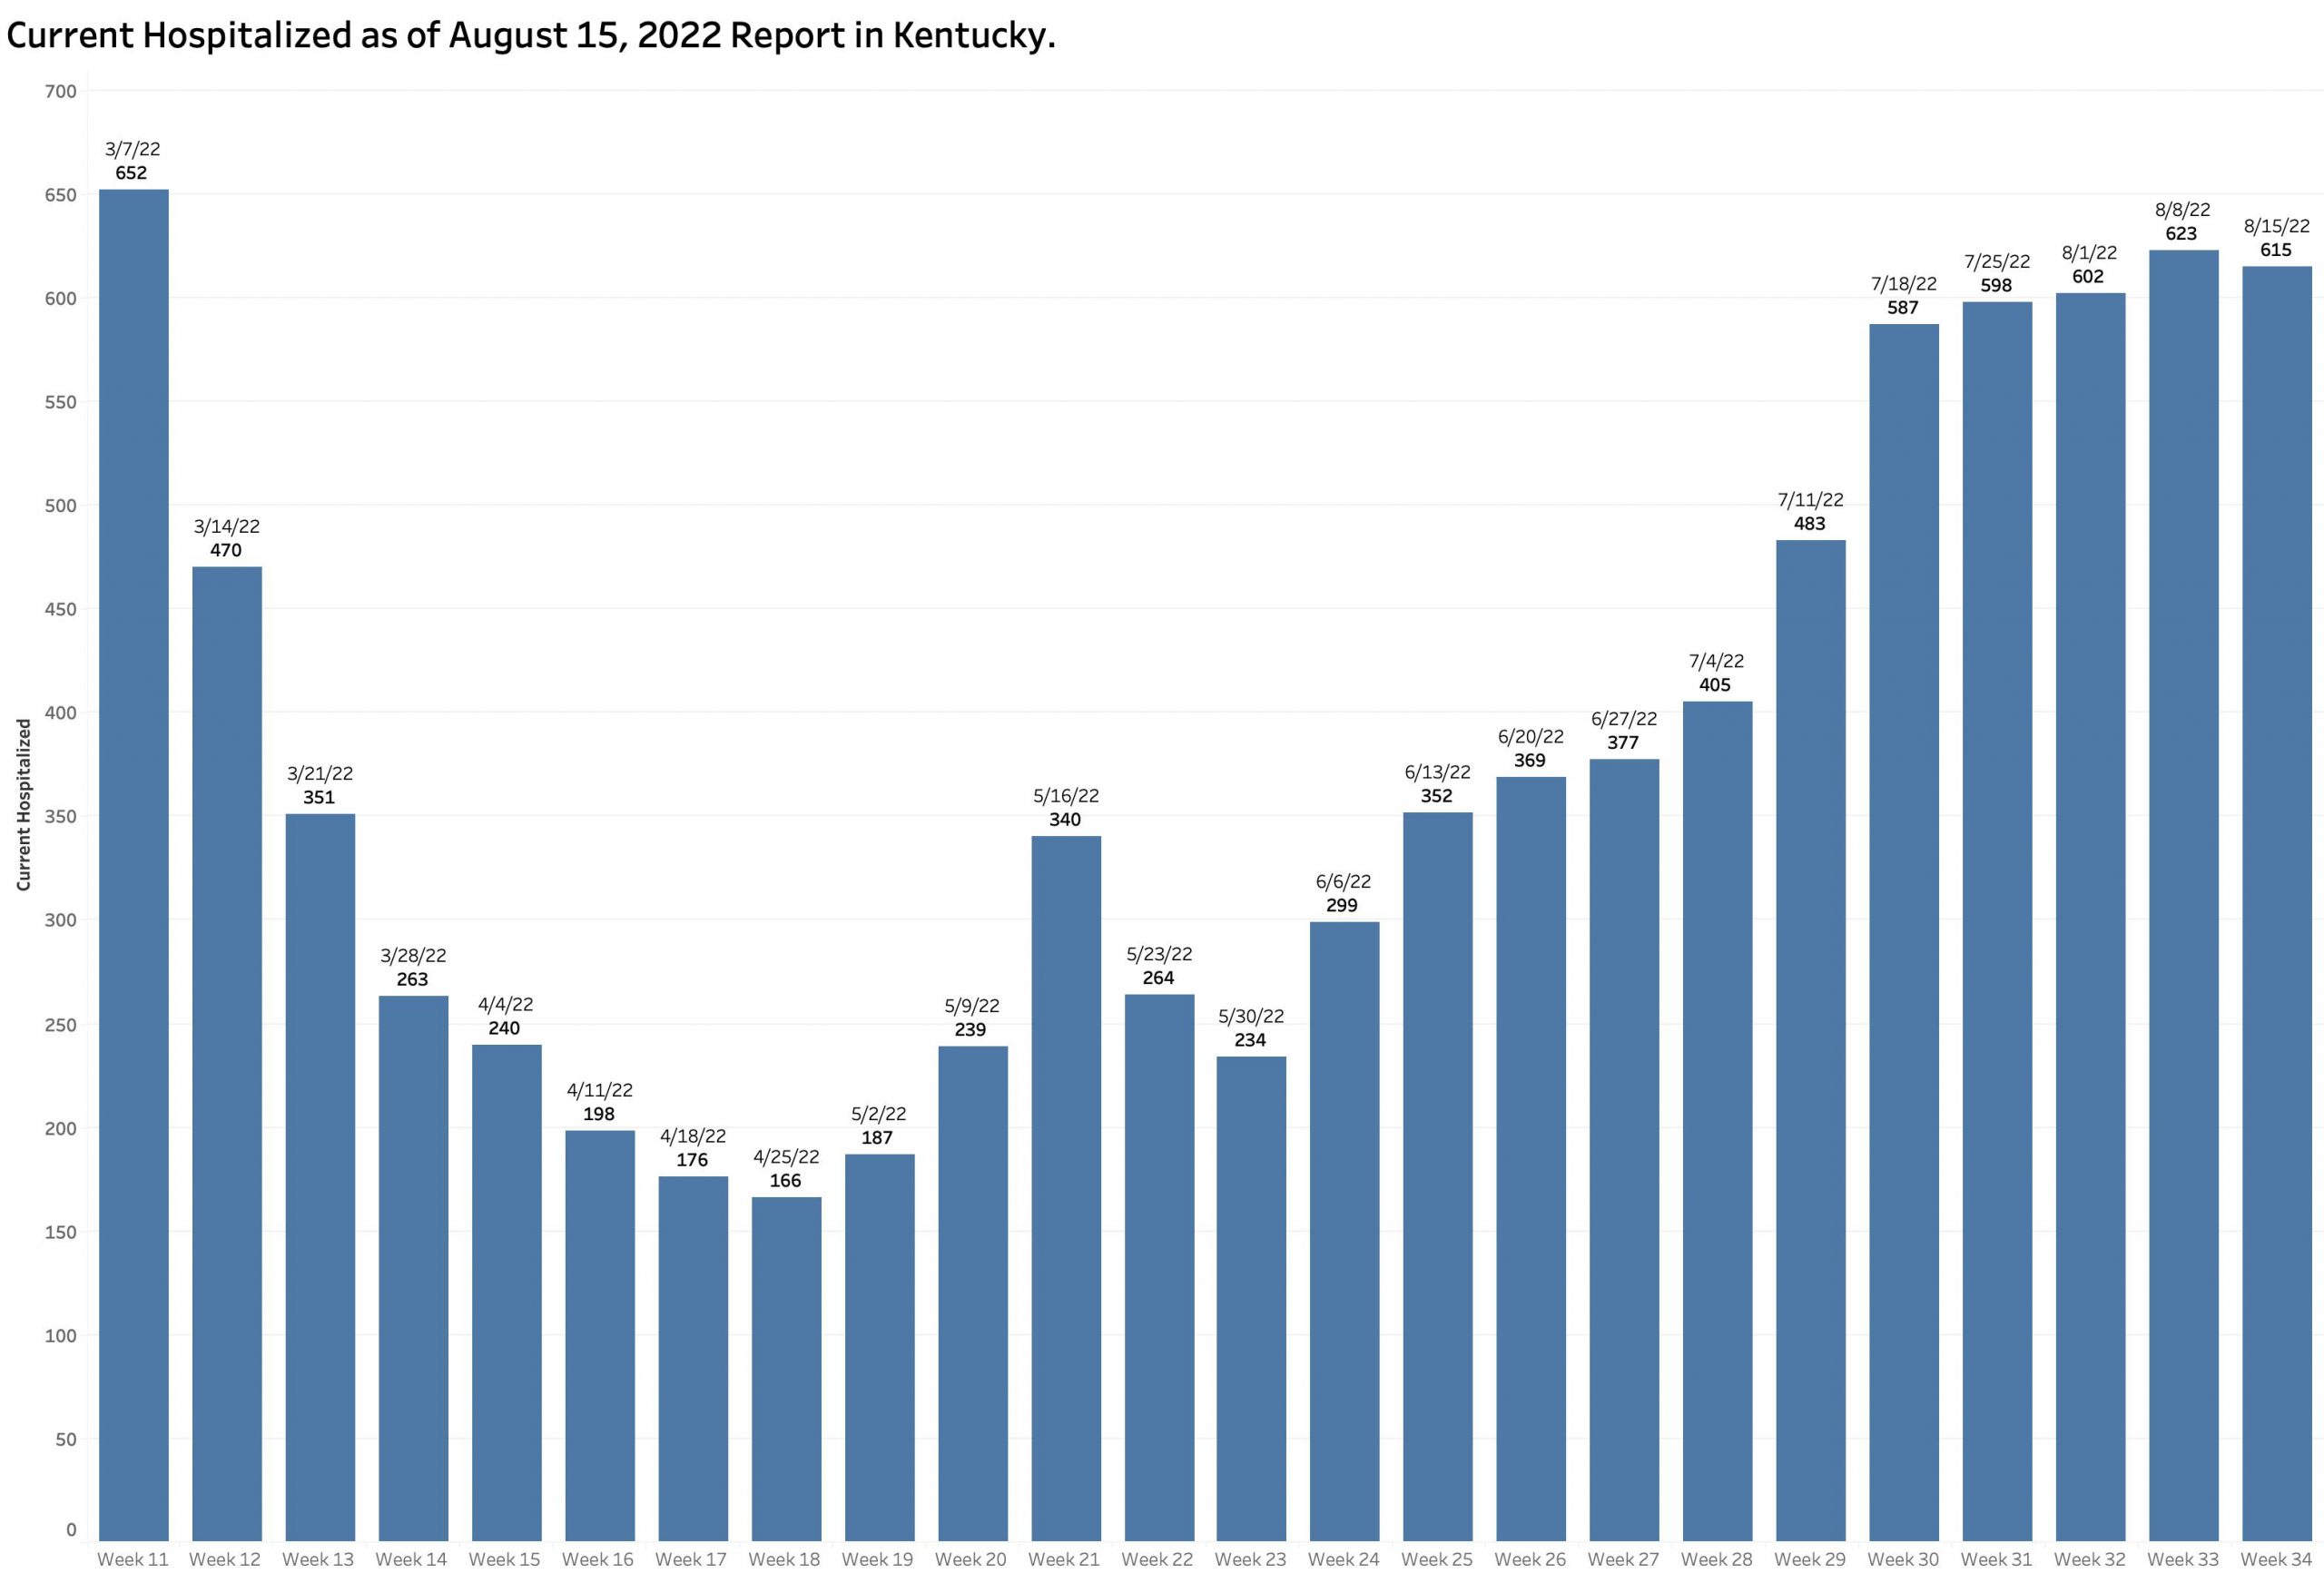
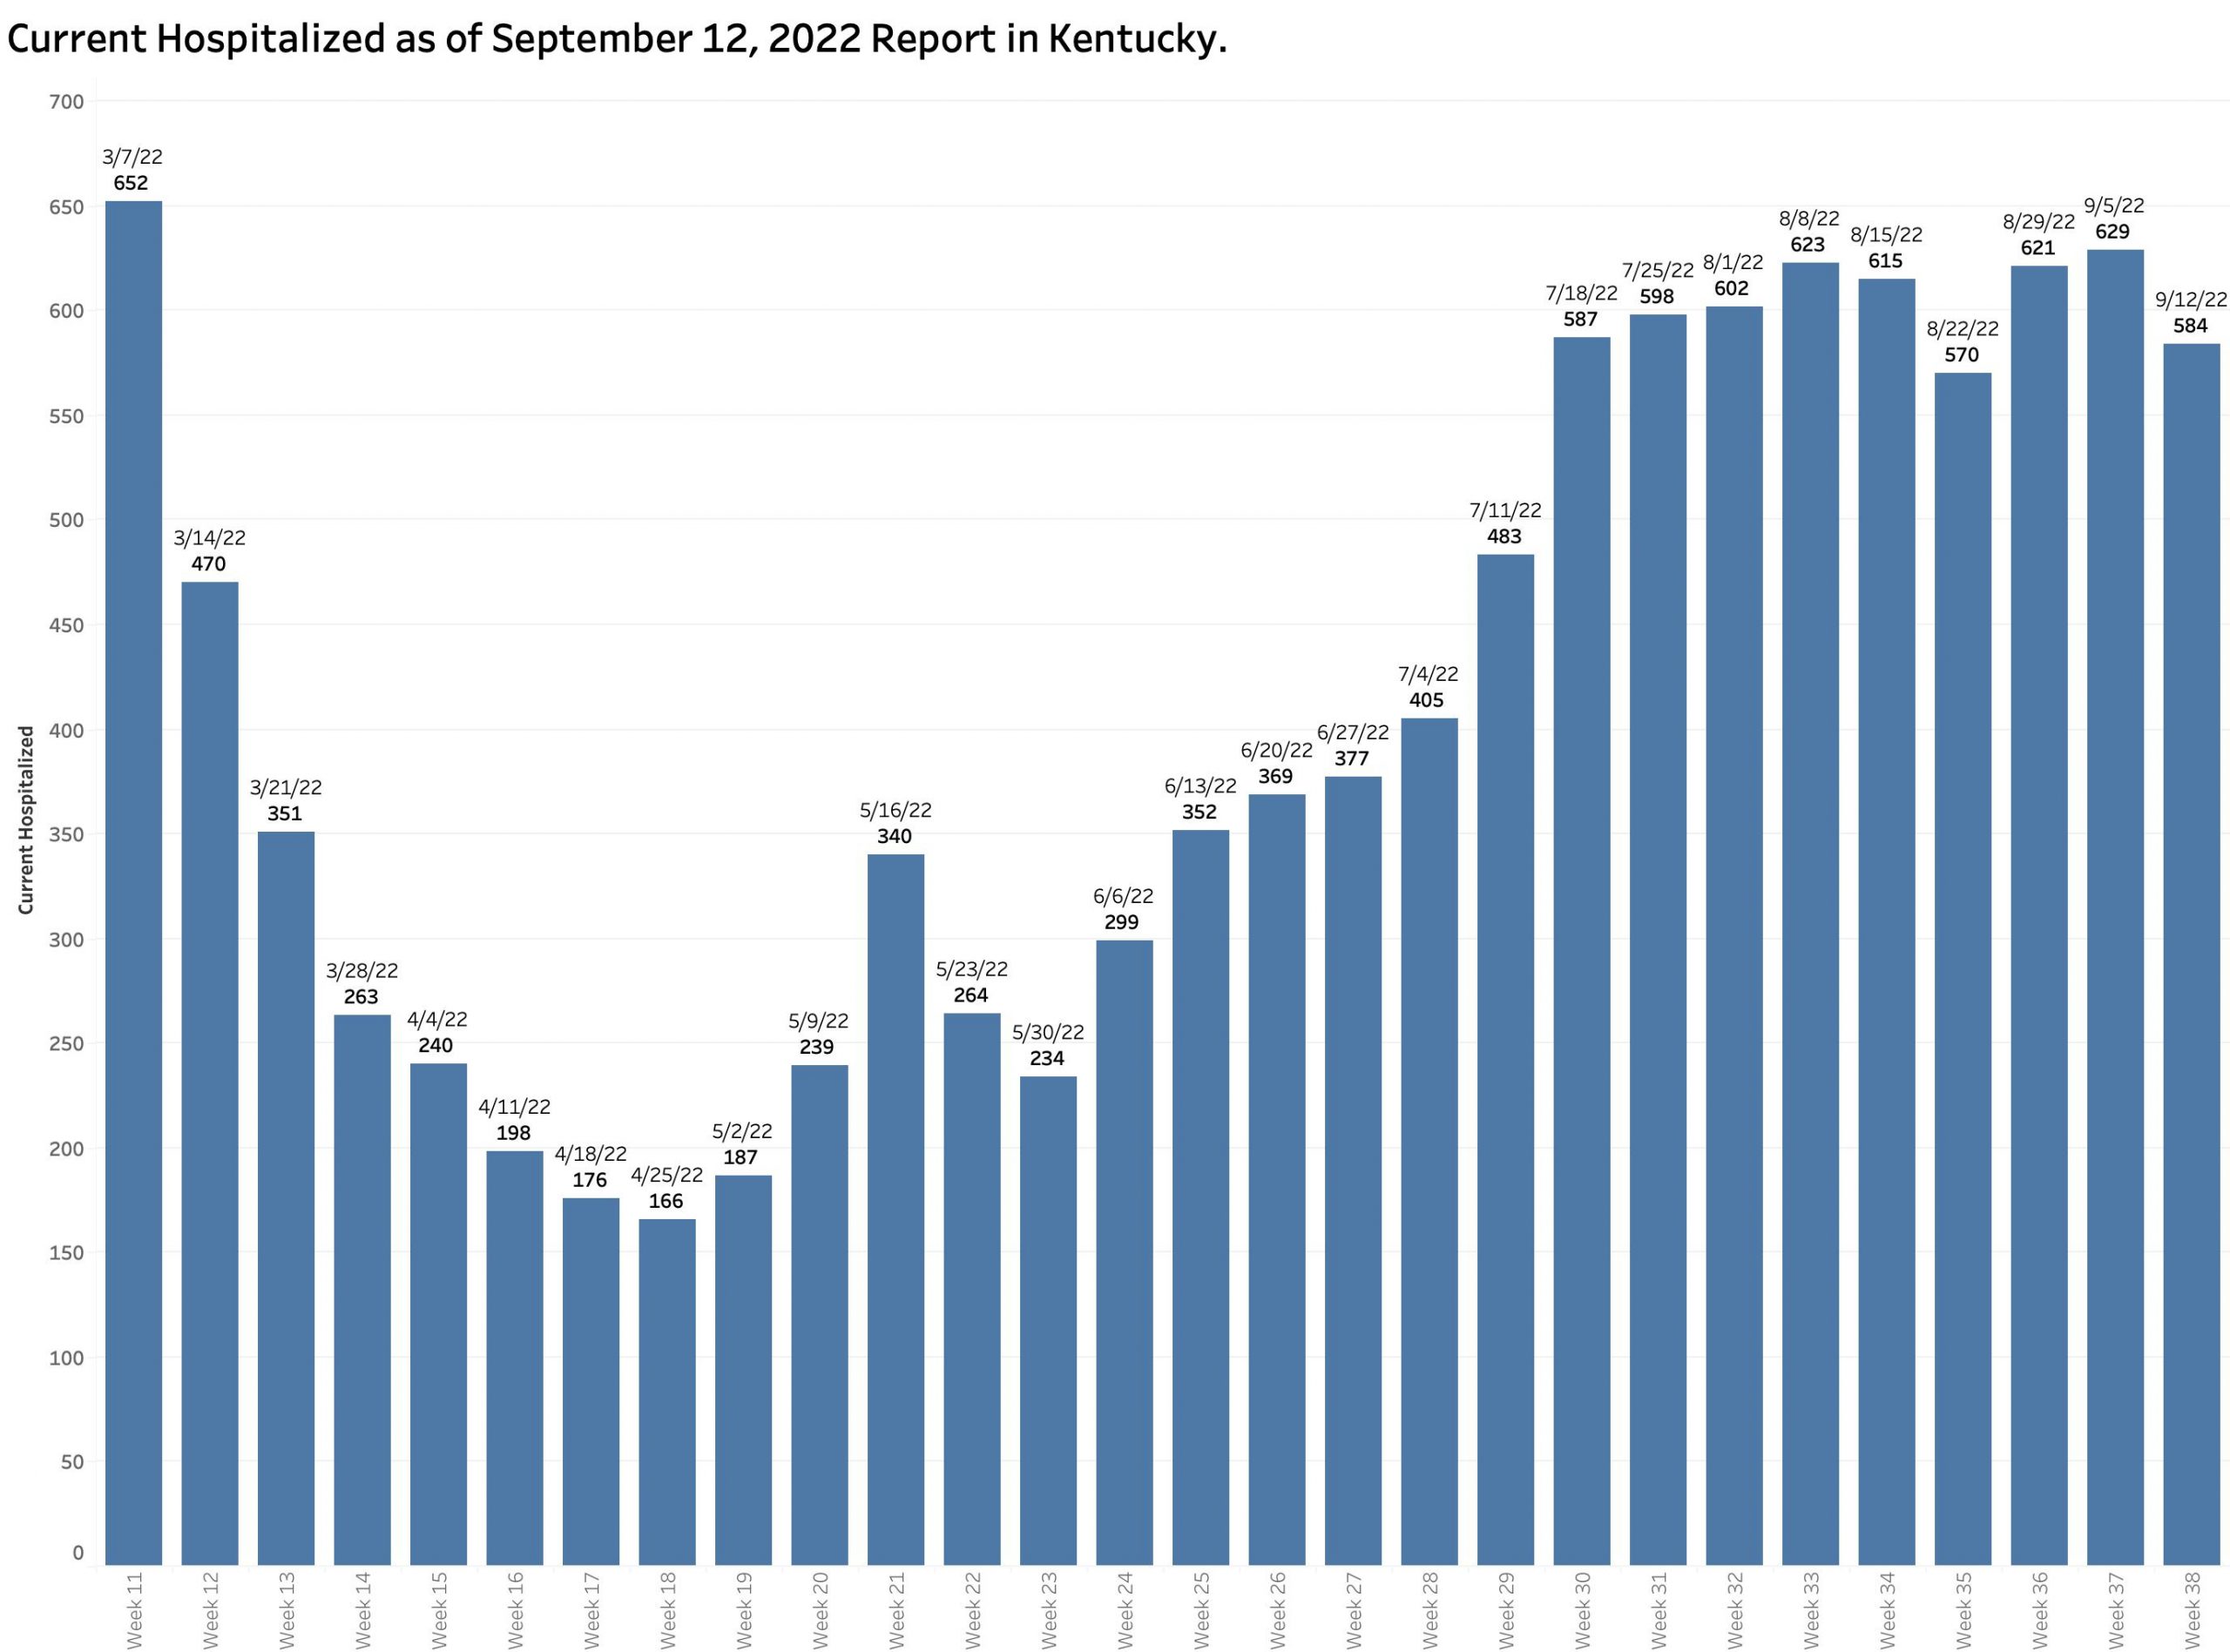
The current hospital census is reported as 584 showing little change over the previous 8 weeks.  The charts for ICU and Ventilator utilization look pretty much the same.


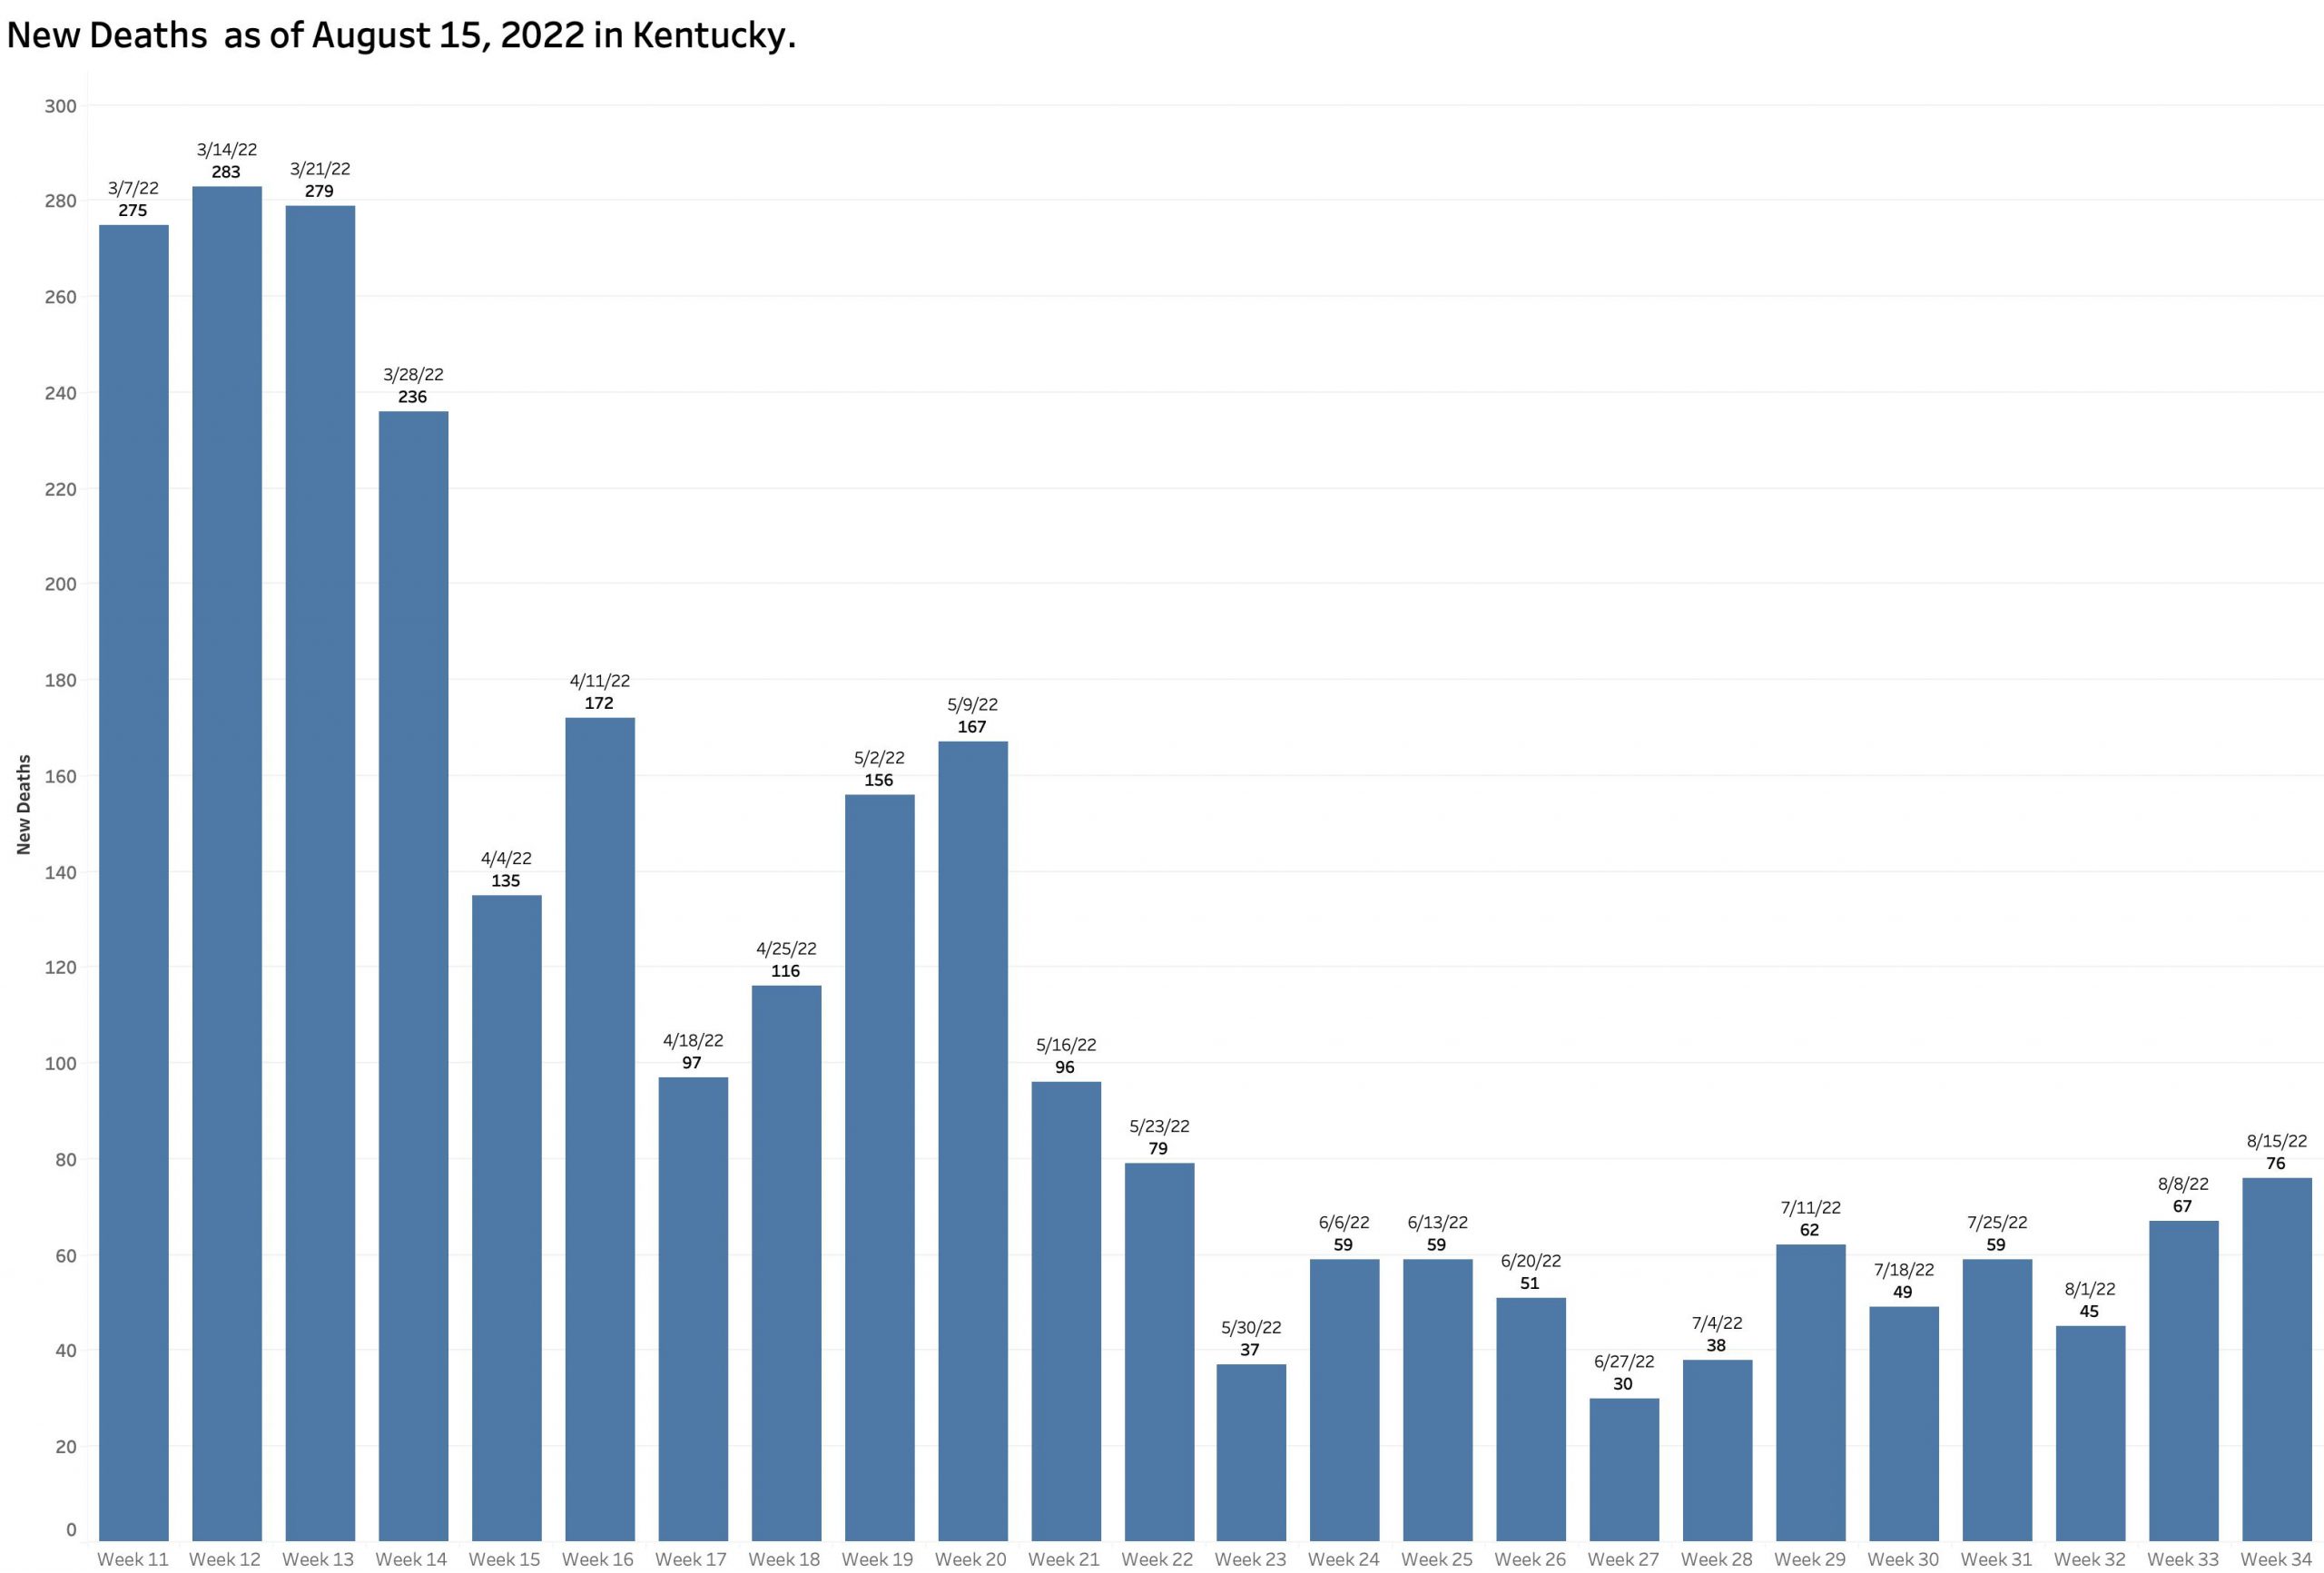
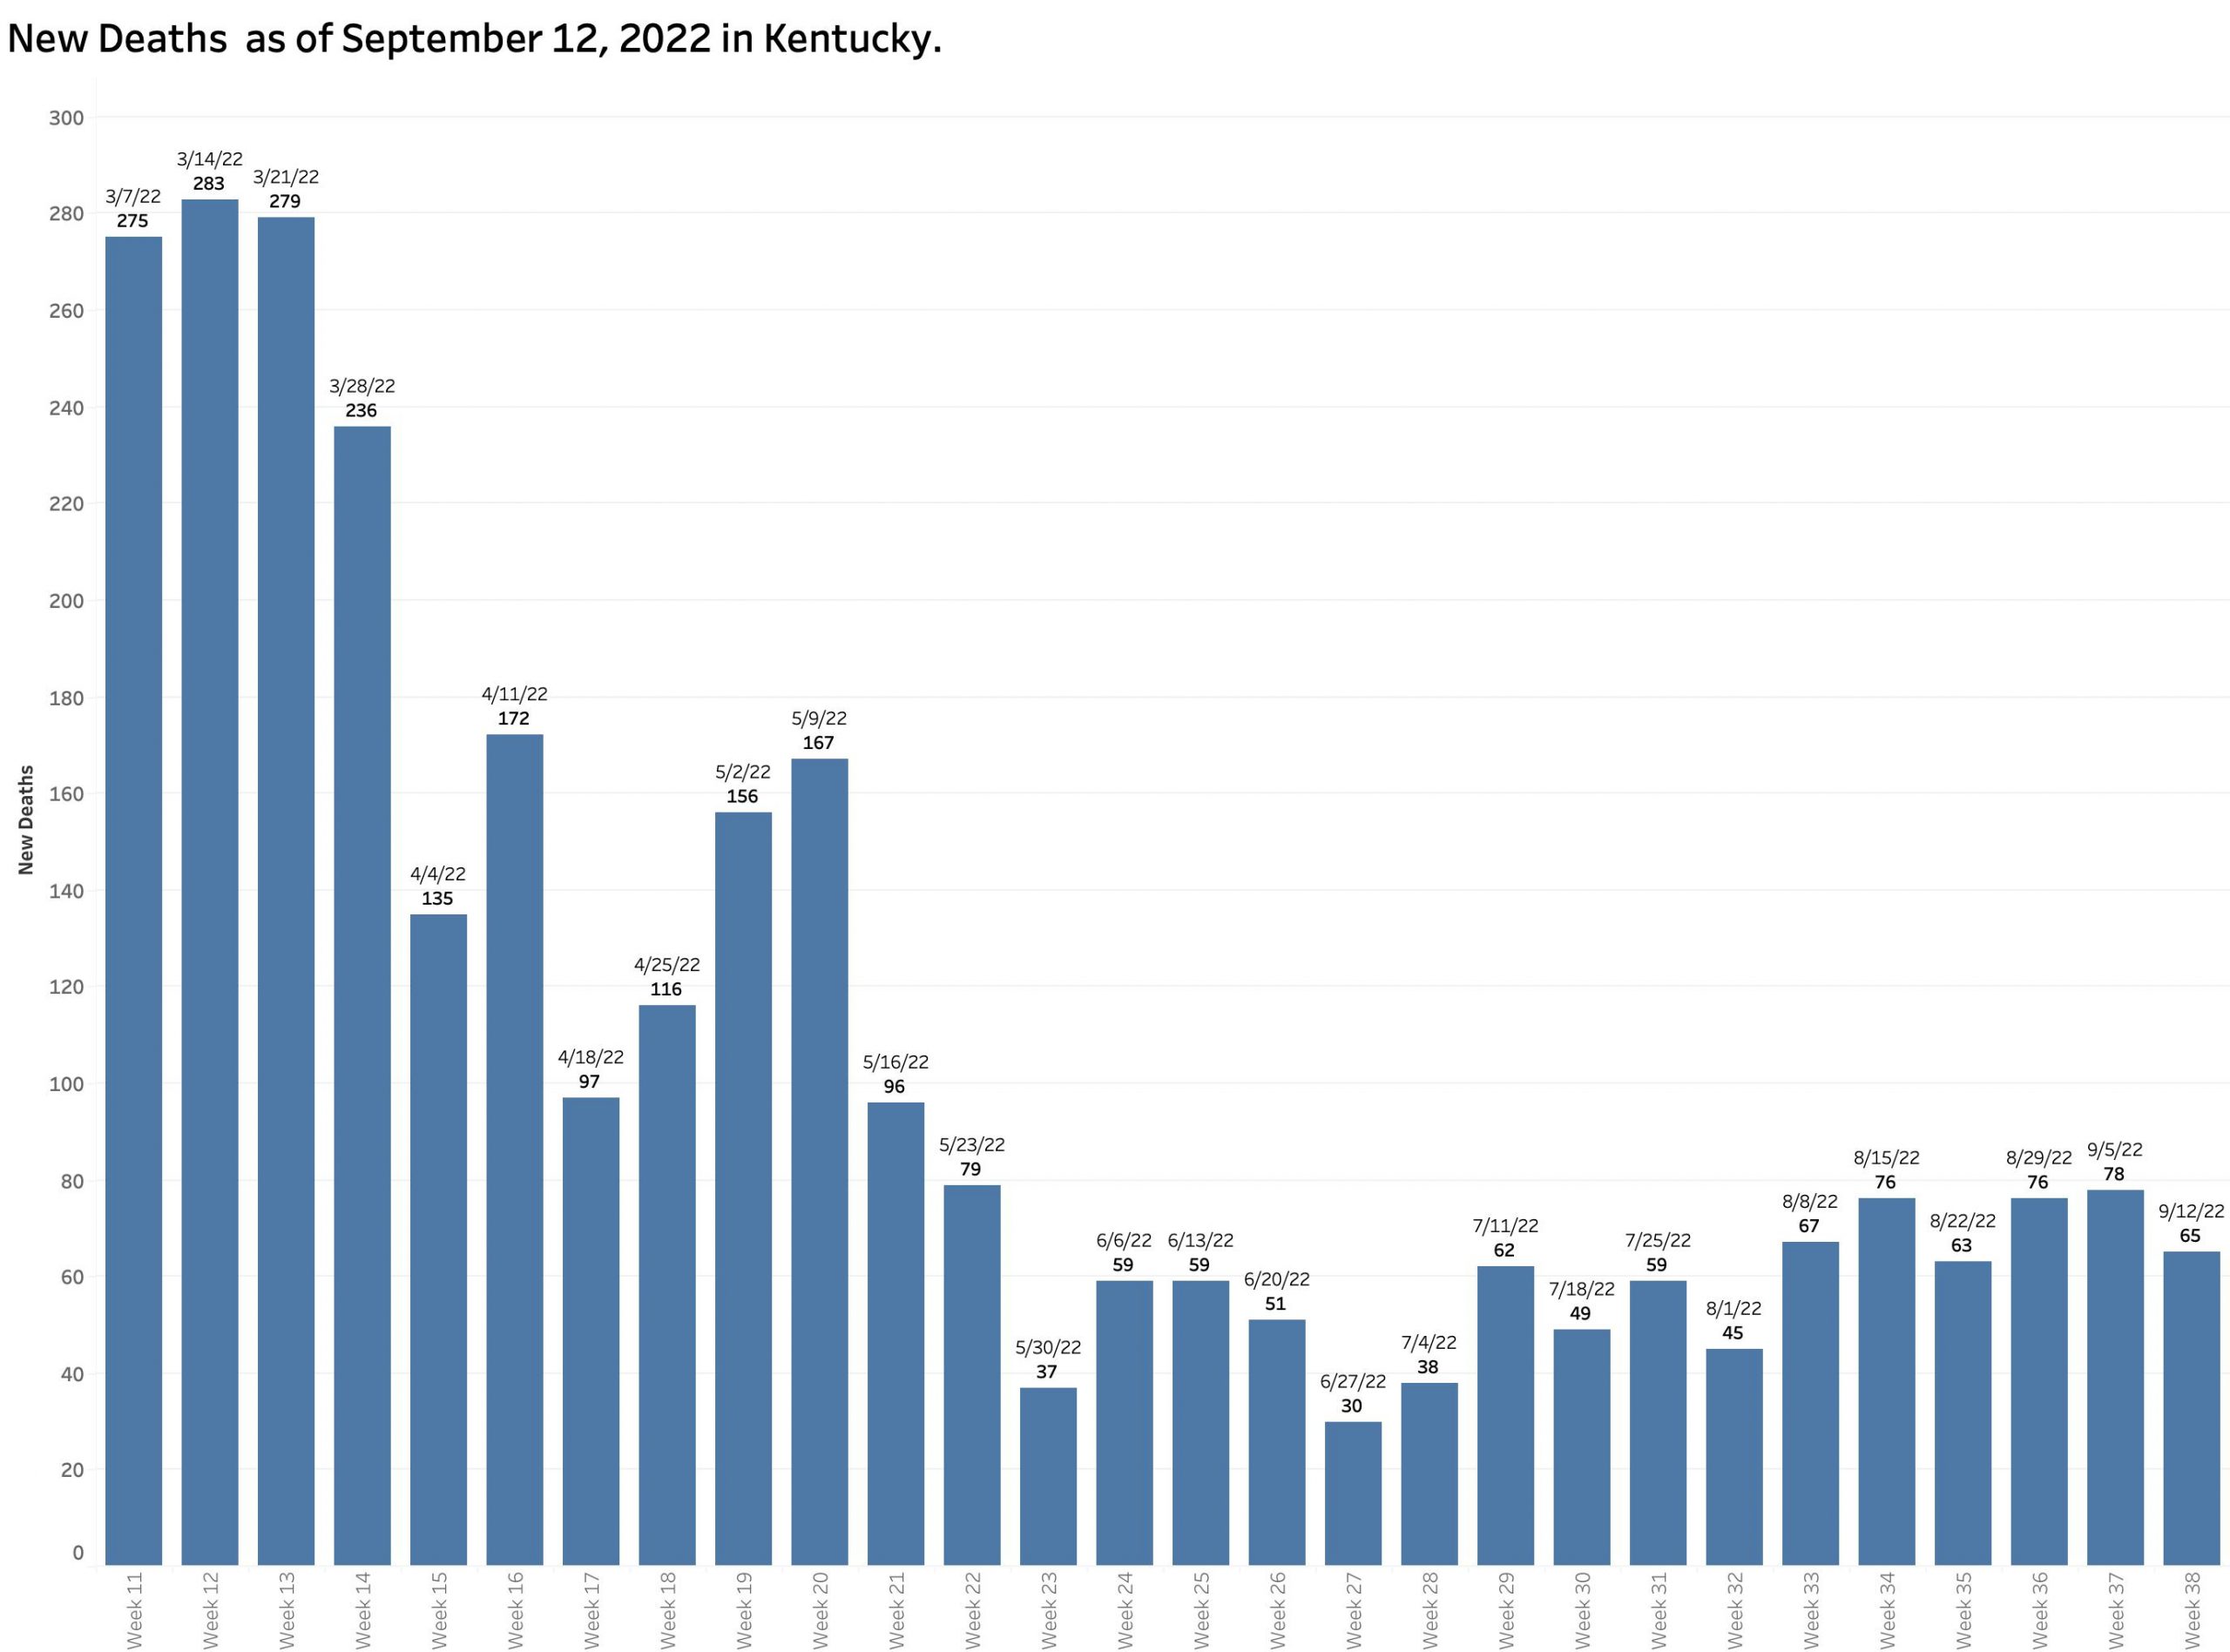
The number of new reported deaths has not changed much.  We expect hospital utilization and deaths to lag the number of new cases. Given that the objective our current national strategy of pandemic management is to limit these complications, victory cannot be claimed until these sequelae of coronavirus infection are acceptable.  I do not think they are now.


Community Activity vs. Case Incidence Rates.
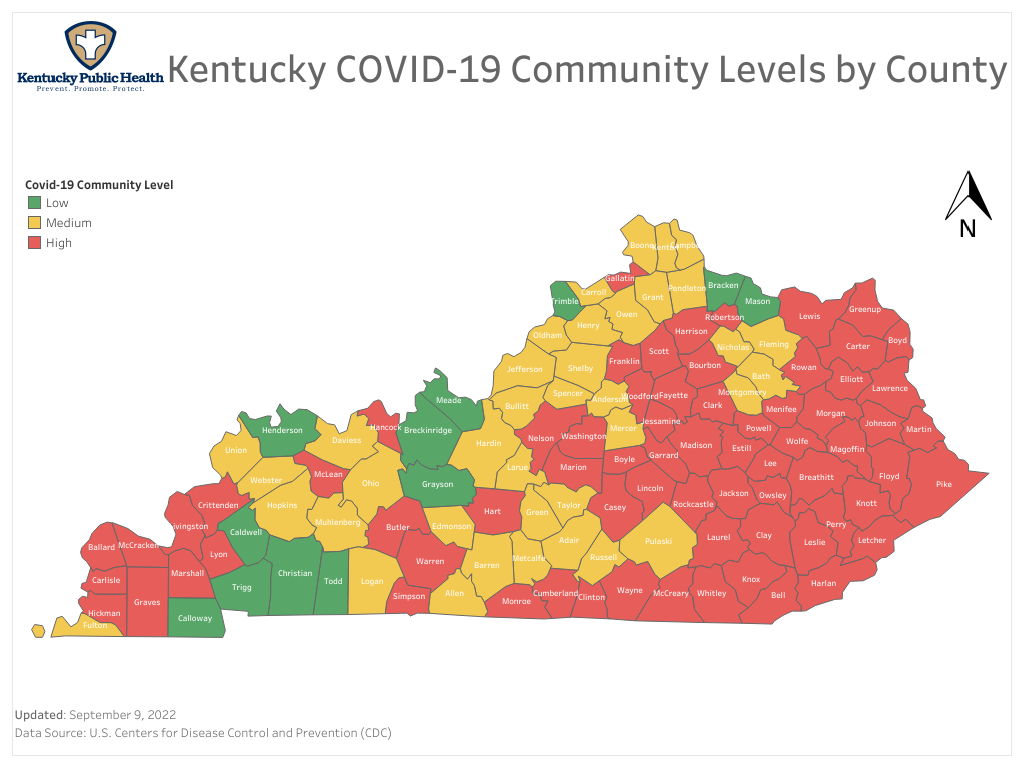
The most recent Community Activity Level map shows many yellow and even some green Kentucky Counties. A recent one-week change in Jefferson County from red to yellow is being used as a justification to eliminate a mask mandate in public schools. (I hope this is not premature as individuals 18 years and younger have recently made up as much 38% of all new reported cases statewide!)  The community level is calculated using data and a formula not available to me but takes into account case incidence rates, and hospital utilization within service areas associated with hospitals outside our state line in states with overall incidence rates that are lower than Kentucky’s.  If our incidence rates are artifactually low, so will be the assessment of our Community Levels.


Note sharp drop in number of red counties after 4th of July holiday.

Having had Covid-19 myself at least twice, no one wants this epidemic to fade into more of a manageable endemic infectious illness than I.  I do not see that we are there yet.  I will get the new bivalent booster as soon as it becomes available and urge the people I care about do the same. I will continue to wear a mask in public spaces.  I do not think that makes me a bad person!

Peter Hasselbacher, MD
Emeritus Professor of Medicine, UofL
13 September 2022

Is Kentucky’s Covid-19 Status Stabilizing? How Can We Tell?

Our body politic is tired of dealing with COVID-19 and has been for some time. The push-back from so many directions, the effectiveness of a variety of both medicinal and non-medicinal interventions, and the reality that a majority of us (including me) have already been infected by existing strains of the causative virus has led us to a posture of dialing back virtually all disease mitigating measures. This change in approach showed up “officially” in a revised set of relaxed recommendations from the CDC related to fundamental public health measures including masking, testing, isolation, and the like. All this in the face of the facts that people are still getting sick, still entering hospitals, and still dying. The fact is that in a world where Covid-19 is perceived to be part of the woodwork of society, there is a level of disease mortality and morbidity that we implicitly accept. The same tradeoffs of benefit against harm exist across virtually any other public policy or individual decisions we make.

Our Current Posture:
Is Kentucky – the “United we stand, divided we fall” state – making the right Covid choices? That we are divided in so many ways is not a matter of debate. Readers of these articles will appreciate that I and others have significant reservations on how we as a state or nation have handled the current epidemic or on our ability to handle other contemporary or the inevitable future public health issues we face. Kentucky is among the states with a “do nothing” legislature. I think it is showing.

Kentucky as a Covid hotspot.
The New York Times has one of the better Covid-19 update scoreboards. Somehow, it still manages to publish daily county-specific counts of cases, deaths, hospitalizations, immunizations, and other relevant information. As of yesterday, Kentucky was not in a good place. We lead the nation with an average daily recent case incidence of 55 per 100K, behind only Puerto Rico and Guam. Our daily average hospitalizations put us at #6. In a map of disease “hot spots,’ Kentucky stands out like a sore thumb. In a listing of daily new-case incidence rates for all US counties, the top 4 are in Kentucky as are 9 of the top 20. Even before the disastrous recent floods in southeast Kentucky, those counties as a group had the highest burden of new cases in the state. The social and economic disruption resulting from the flood puts those folks at even higher risk of illness of all sorts.

While it can be argued that matters are “stabilizing” or even declining nationally, we are currently within the ranges of the previous two years that were deemed unacceptable. Hospitalizations and deaths continue to rise, albeit slowly. Data collection, never optimal, has deteriorated in completeness and timeliness. I do not know what to make of Kentucky’s own home-grown date collection. Since March of this year, Kentucky updates its Covid-19 data only once a week on Mondays and does not provide a state-wide county or date-specific database available for independent public analysis. I have been doing the best I can for this series of articles by combining each weekly report into an Excel file that I make available here. An initial look at this week’s Kentucky numbers may indicate that we have stabilized over the past 4 weeks, it certainly cannot yet be said that things are trending better and the limitations of our ability to capture accurate and timely information become even more apparent. I present some graphic updates below.

New Cases:
In its report of August 15, the state posted a weekly count of new cases of 14,409. This new case number has hovered around 15,000 per week for the past 4 weeks. For the past week, this translates to an average of 2058 new cases daily.

New weekly cases as ofAug 15. Which way will they go? How many uncounted cases are there?

Incomplete reporting:
It can be assumed that for a variety of reasons that the number of New Cases as tallied does not reflect anywhere near the actual number of people who get infected. A second look at how Kentucky reports its cases reveals the ongoing weakness of our statewide identification and reporting systems that is shared widely across the nation. As part of its weekly summary of new cases, the state provides a running “Total of Cases.” In 7 of the 9 weeks of reports since June 20th, the increase in the aggregate counts of Total Cases exceeded the number of New Cases. The combined number of “New Cases” in past 4 weekly reports was 60,599 but the increase in aggregate Total Cases was 13,482 more than that – an amount of nearly a week’s worth of recent counts. These additional cases included those presumably identified and reported centrally to the State’s Public Health Department too late to be included in the counts of the individual current weeks. In my thinking, this means that we missed an opportunity to recognize the onset of an exponential rise in epidemic activity. Of course, if we lack the tools or willingness to do anything about it, this delay or incomplete capture of cases may not make much of a meaningful difference. Below is a chart of the weekly increment in Total Cases since mid-March. At least some of the peaks of the last 4 weeks would have shown up in a chart of daily New Cases.

Increment in total cases from the week before.

Test Positivity Rate:
Our Test Positivity rate remains high at 18.5% and in not going anywhere fast. In any case, this represents only a convenience sample of those getting tested for the virus by PCR RNA methods and reported electronically to the state. The number of individuals being tested weekly by PCR tests on which our TPR rate is calculated has not changed much over the past 4 months and may be declining.

Kentucky’s own Test Positivity Rate. Staying high.

Overall Incidence Rate:
The number of New Cases per 100K population statewide as calculated is 35.3 per 100K and has been decreasing for the past 4 weeks from a high of 42.9 but remains quite high. A map of counties “in the red” on the state’s current Incidence Rate Map has been looking a little better in general, but 92 counties (77%) are still in the red with some counties consistently with very high rates leading the nation.

Overall state incidence rate per 199K. Coming off a high place. County maps improving slightly also.

Hospitalizations:
Current hospitalizations remain high and are slowly increasing as counted. It cannot be said that infections from the current viral strain are clinically trivial. New strains will come which may be better or worse. More of my friends are getting infected or affected. How about yours?

Current daily hospitalizations

Deaths:
A background drumbeat of deaths continues.


In closing, I must confess that I am losing confidence in my ability or anyone else’s to judge where we are headed. I see the same shortcomings playing out in our current handling of the Monkeypox epidemic as were exhibited for the COVID one – or for that matter earlier epidemics from which we failed to learn or were unable to prepare for the next. The world is tuning inside-out in many geologic, environmental, and social respects. Such turmoil over the ages has been associated with disease and other disaster. We in our 21st Century United States are not immune from the old or new troubles.

Peter Hasselbacher, MD
Emeritus Professor of Medicine, UofL
Founder, Kentucky Health Policy Institute

Prescription Drug Pricing Reform in the Inflation Relief Bill

Can it really be a negotiation?

The United States House and Senate are on the cusp of passing what remains of the original “Build Back Better Bill” into a pared-down “Inflation Relief Bill.” What remains in the bill remains to be seen, but should it pass, it contains a major section, “Prescription Drug Pricing Reform,” that includes a “Price Negotiation Program to Lower Prices for Certain High-Priced Single Source Drugs.” The ability of the government to negotiate or have any sort of control over drug pricing is probably the one issue most resisted by the pharmaceutical industry. The bill is difficult for mere-mortals to understand with references to various internal and external laws. I do not fully understand all of it yet. In brief, the bill allows Medicare to “negotiate” with drug manufactures for 10 to 20 drugs at a time per year over the next few years. We customers will not see much effect for a while. Medicare will select the drugs to be negotiated from among the top 50 Part-B and Part-D drugs ranked by the total cost to Medicare and its beneficiaries. Since the top 50 drugs make up almost half of Part-D total drug costs, the potential impact on Medicare beneficiaries and drug companies alike may be great. The remainder of this article will explore the top-50 drugs of pre-pandemic 2019.

For the purposes of this article, I used Medicare’s Public Use File: Part-D Utilization 2019 Drug Summary. The file summarizes the total drug cost and unique numbers of prescribers and beneficiaries for each of 1847 generic (chemical-name) drugs, broken down additionally into 3380 brand names or marketed versions of each generic. These are presented below in list and tree map formats.

Continue reading “Prescription Drug Pricing Reform in the Inflation Relief Bill”

Covid-19 In Kentucky Expanding at Increasingly Exponential Rate. What, me worry?

Despite only partial data collection, 108 of Kentucky’s 120 counties are “in the red zone” for community spread. None are at less than “substantial” incidence rates. The explosion of cases is most marked in counties with smaller populations. Recommended public and personal health responses are widely ignored despite increasingly exponential epidemic growth of new cases, test positivity rates, and overall incidence rates. Hospital, ICU, and ventilator utilization are on the move upwards albeit at slower rates. As school opening approaches in early August, the proportion of new cases in individuals age 18 or under is beginning its expected increase. Much the same can be said about most of the rest of the country as the BA.5 variant of the virus continues its run.

In addition to the as-yet ill-defined medical condition of “Long Covid,” the country is suffering from an overall Covid-fatigue that expresses itself clinically and politically as giving up trying to do anything to mitigate the spread or morbidity of Covid-19. Having probably contracted Covid-19 twice myself– three times if you count my Paxlovid rebound– I am understanding of, or at least have some sympathy for those who feel we are powerless to do anything to recover the lifestyles we may have enjoyed previously. It is my opinion that adopting a posture of futility is a bad error.

Much is being written by individuals with more public experience and authority than I. In its monthly update to Kentucky practitioners by the Department of Public Health last week, it was reported that vaccination and booster shots are associated with a more than three-fold decrease of risk of contracting Covid-19. The risk of death from this infection is more than 16-fold less. Over the past year, 67% of Covid-19 deaths in individuals over 60 were unvaccinated. For those younger than 60 a staggering 90% of Covid-19 deaths were in the unvaccinated! Death is not the only thing that can go wrong to our collective physical or economic health.

Except for perhaps worsening of pimples, protecting oneself and others by masking when feasible does not worsen one’s health and will protect against other respiratory illnesses. It astounds me that so few of use utilize this simplest of non-medical public health measures!

That which does not kill us can still make us weaker!
(Apologies to Nietzsche!)

The longer the epidemic runs in force, the longer the disabling disruptions to our daily lives and economy will also take their tolls. We will likely have to learn to deal with a new endemic disease, but for now, can do better.

Enough rambling. A few charts follow.

Peter Hasselbacher, MD
Emeritus Professor of Medicine, UofL
26 July 2022


Incidence Rate map as of 7/25/2022. 108 Counties in the red.


Over past two years, Test Positivity Rates strongly correlate with emergence of new cases.